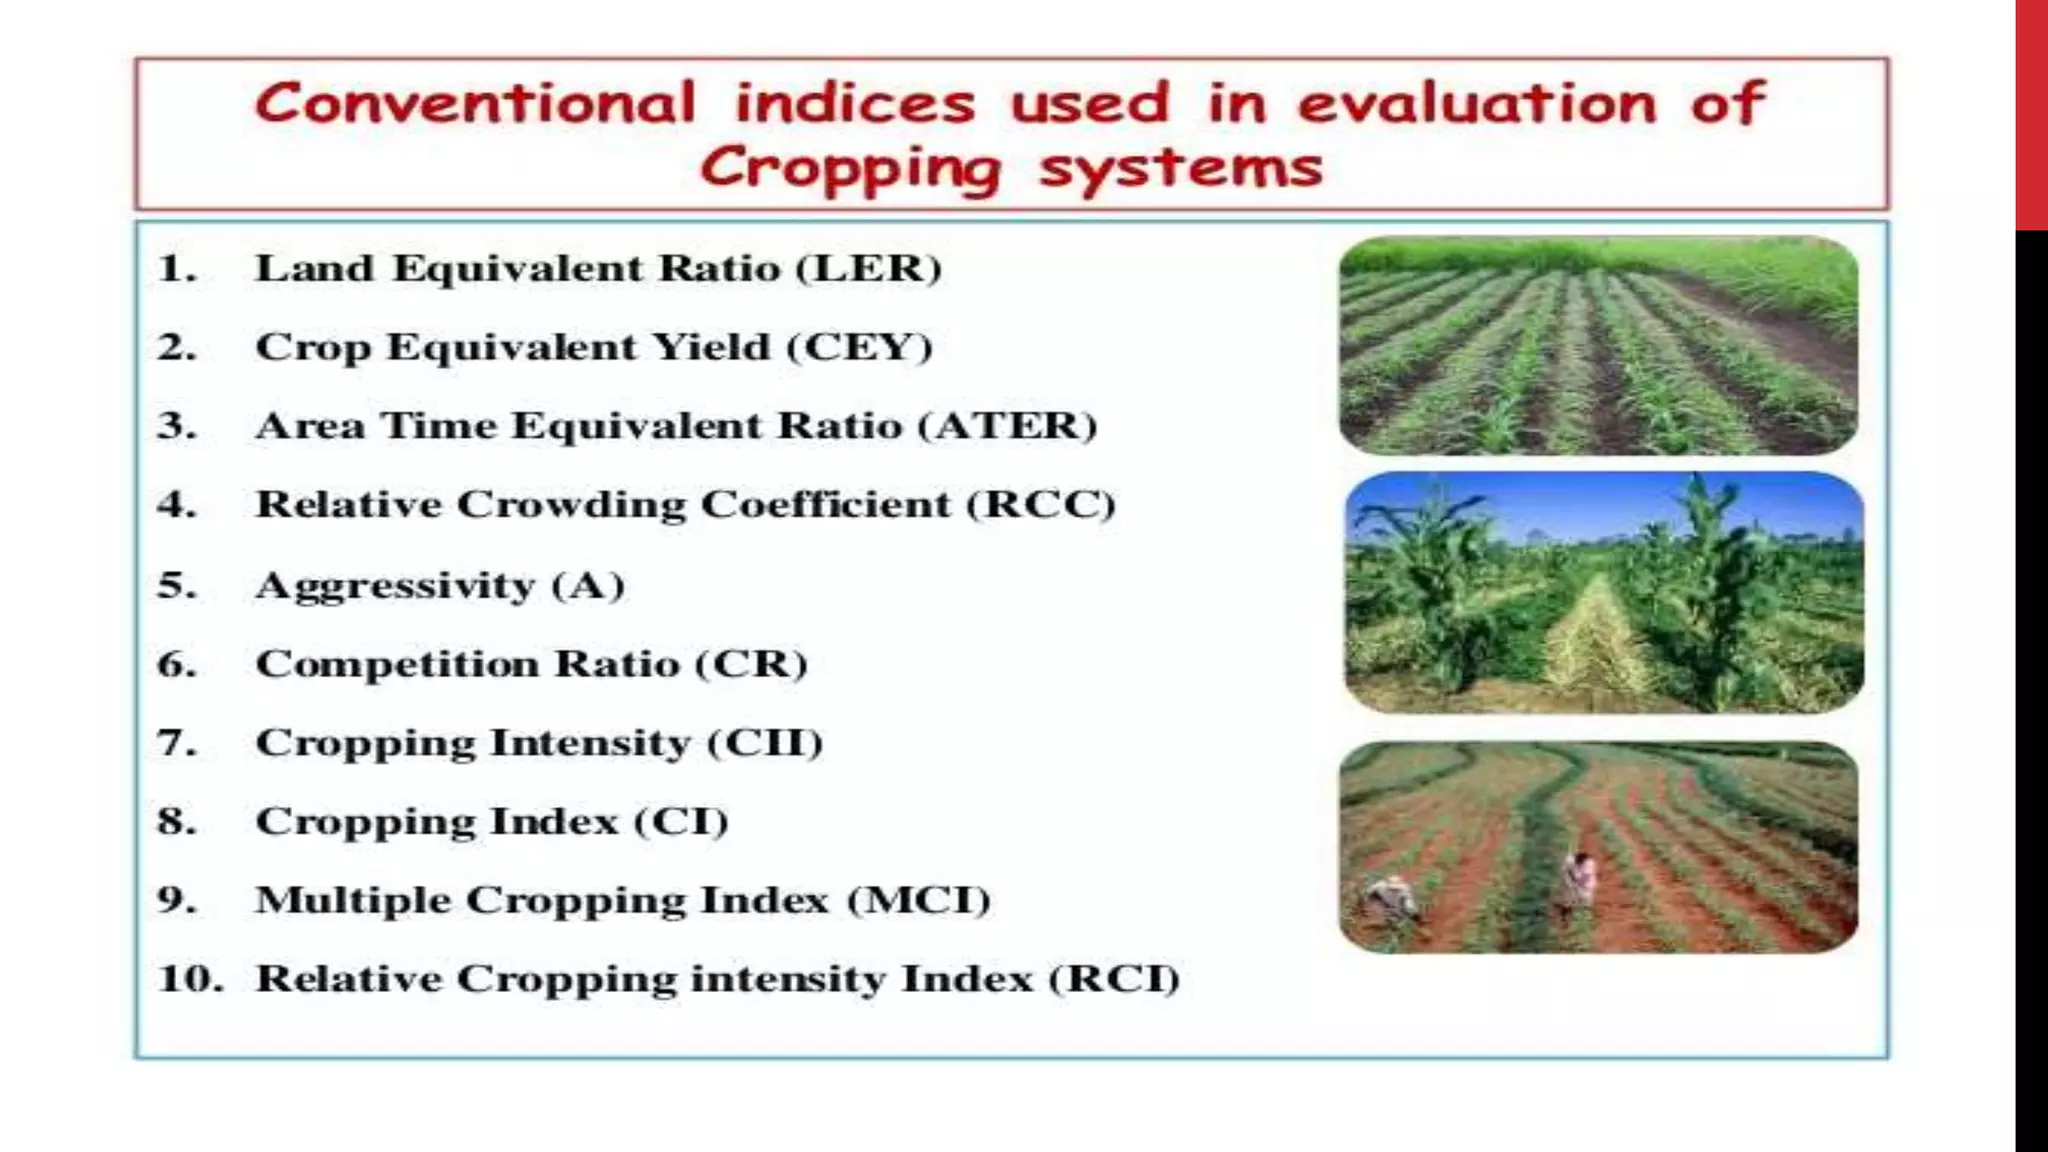
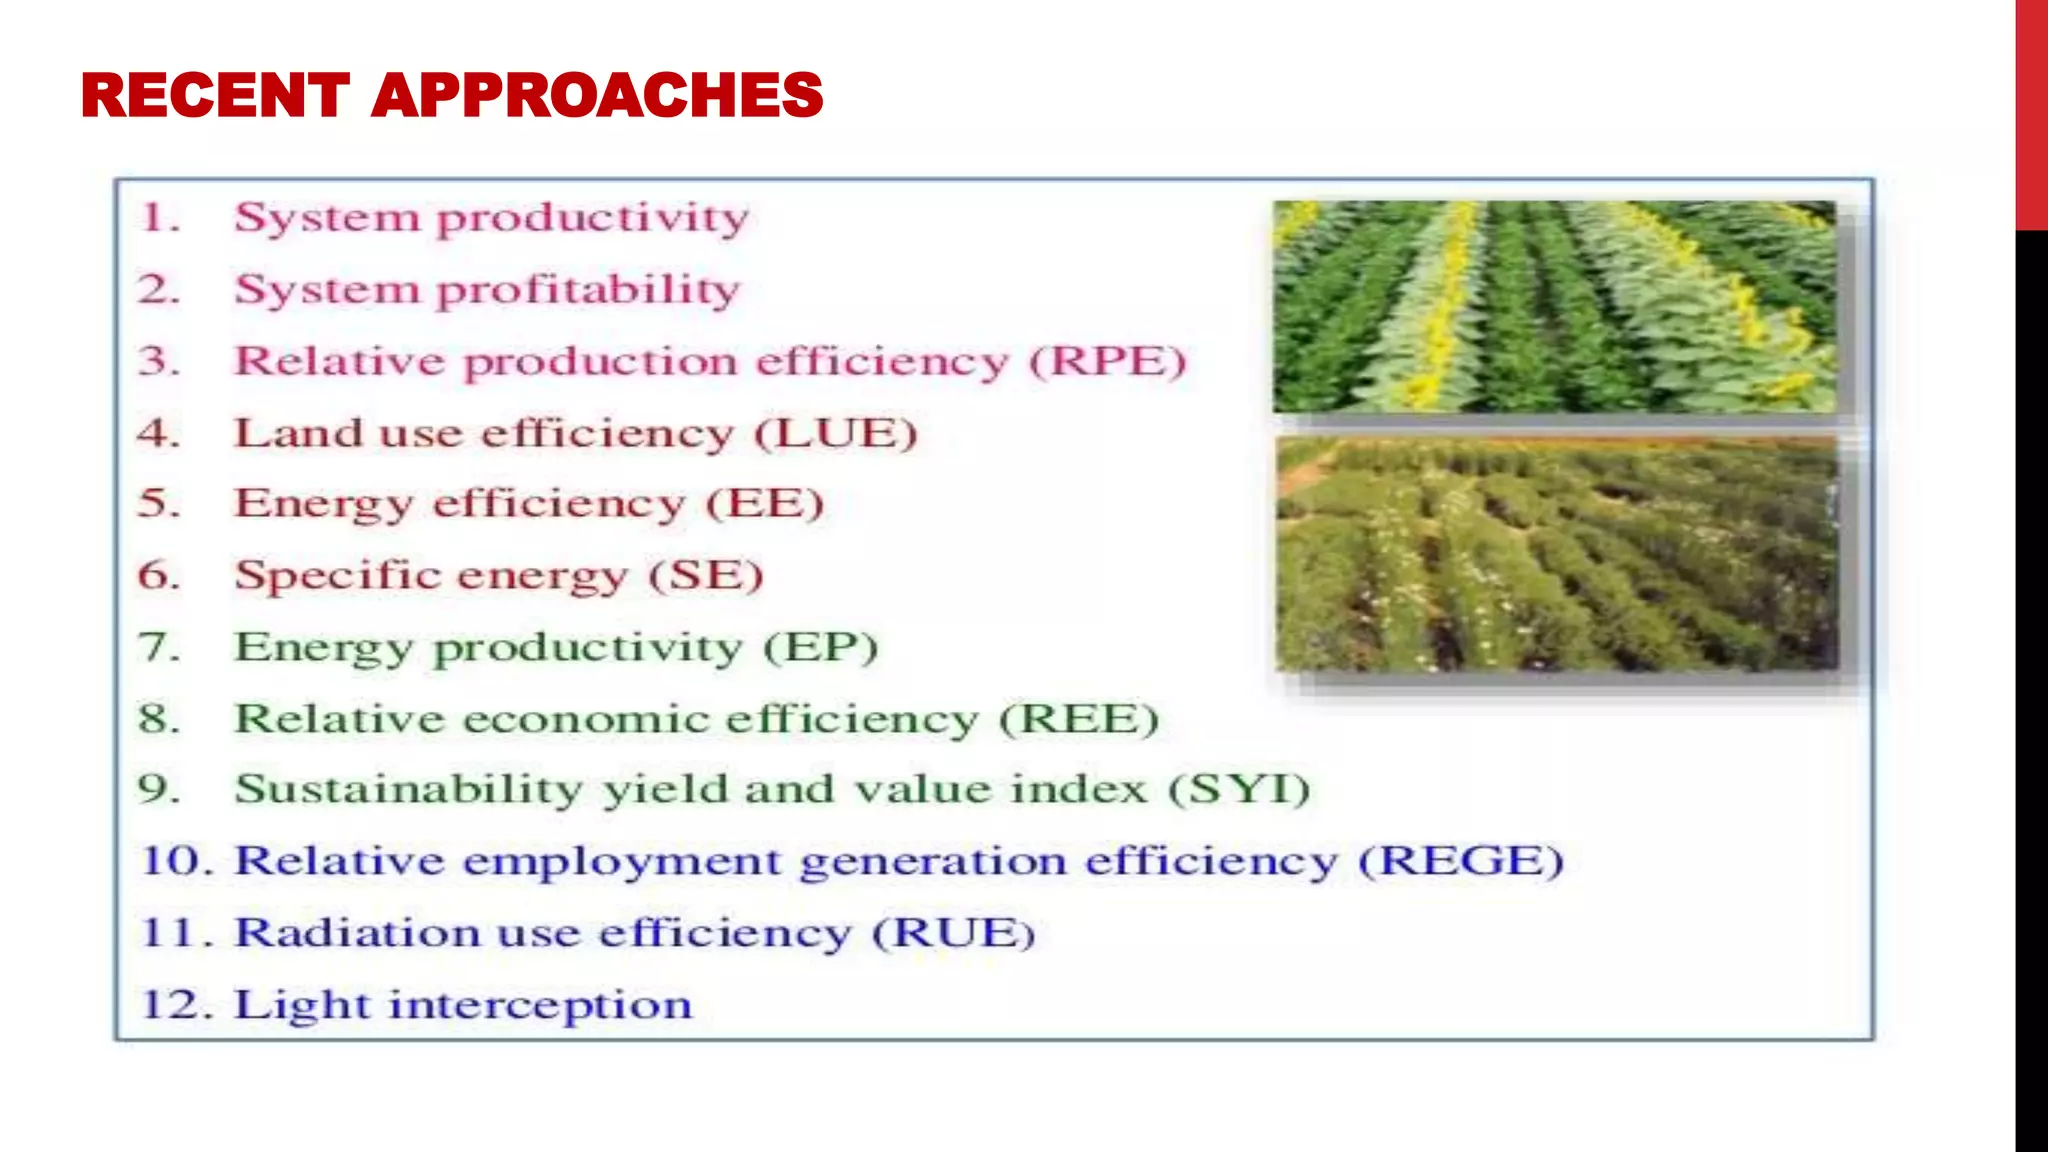
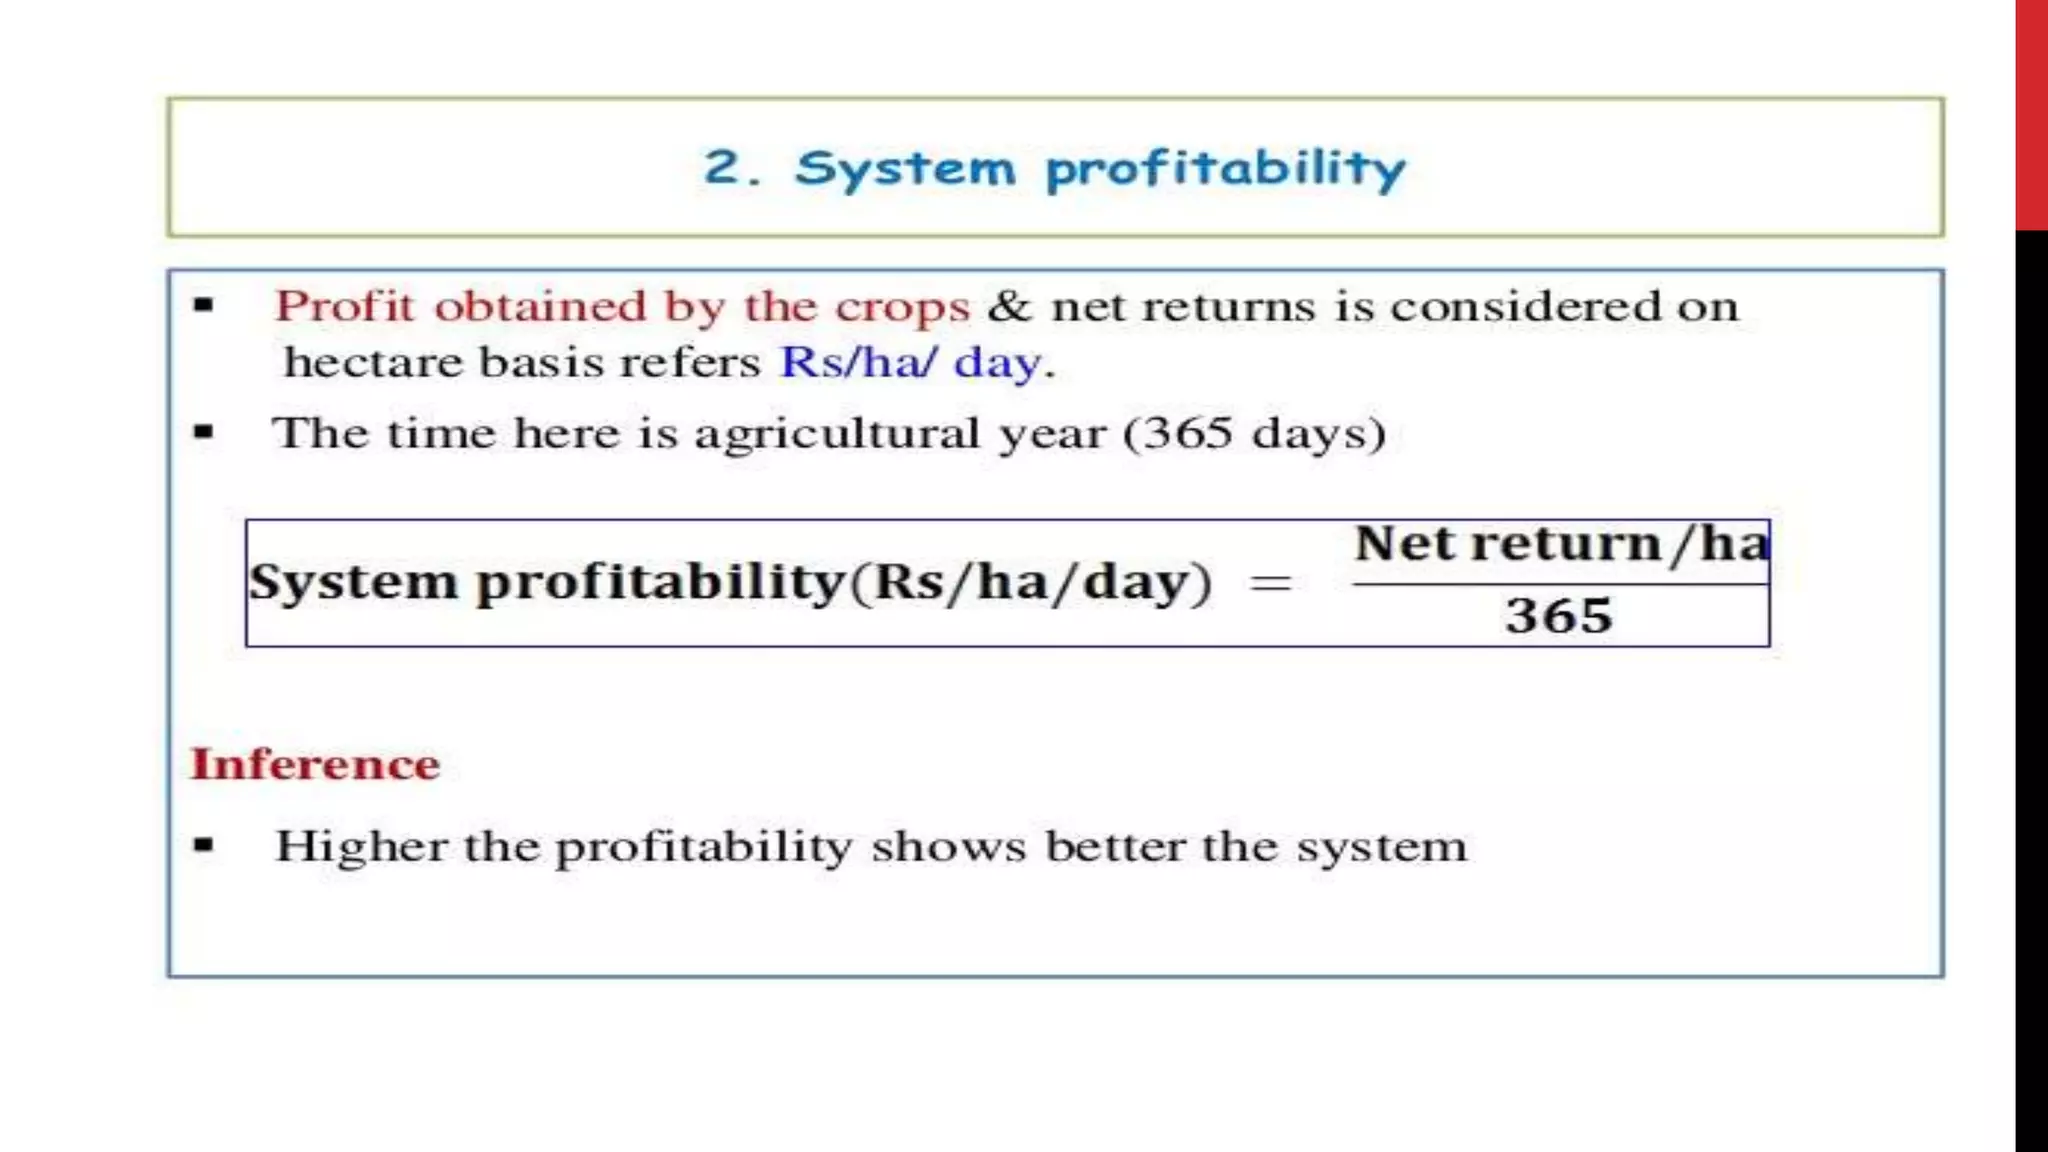
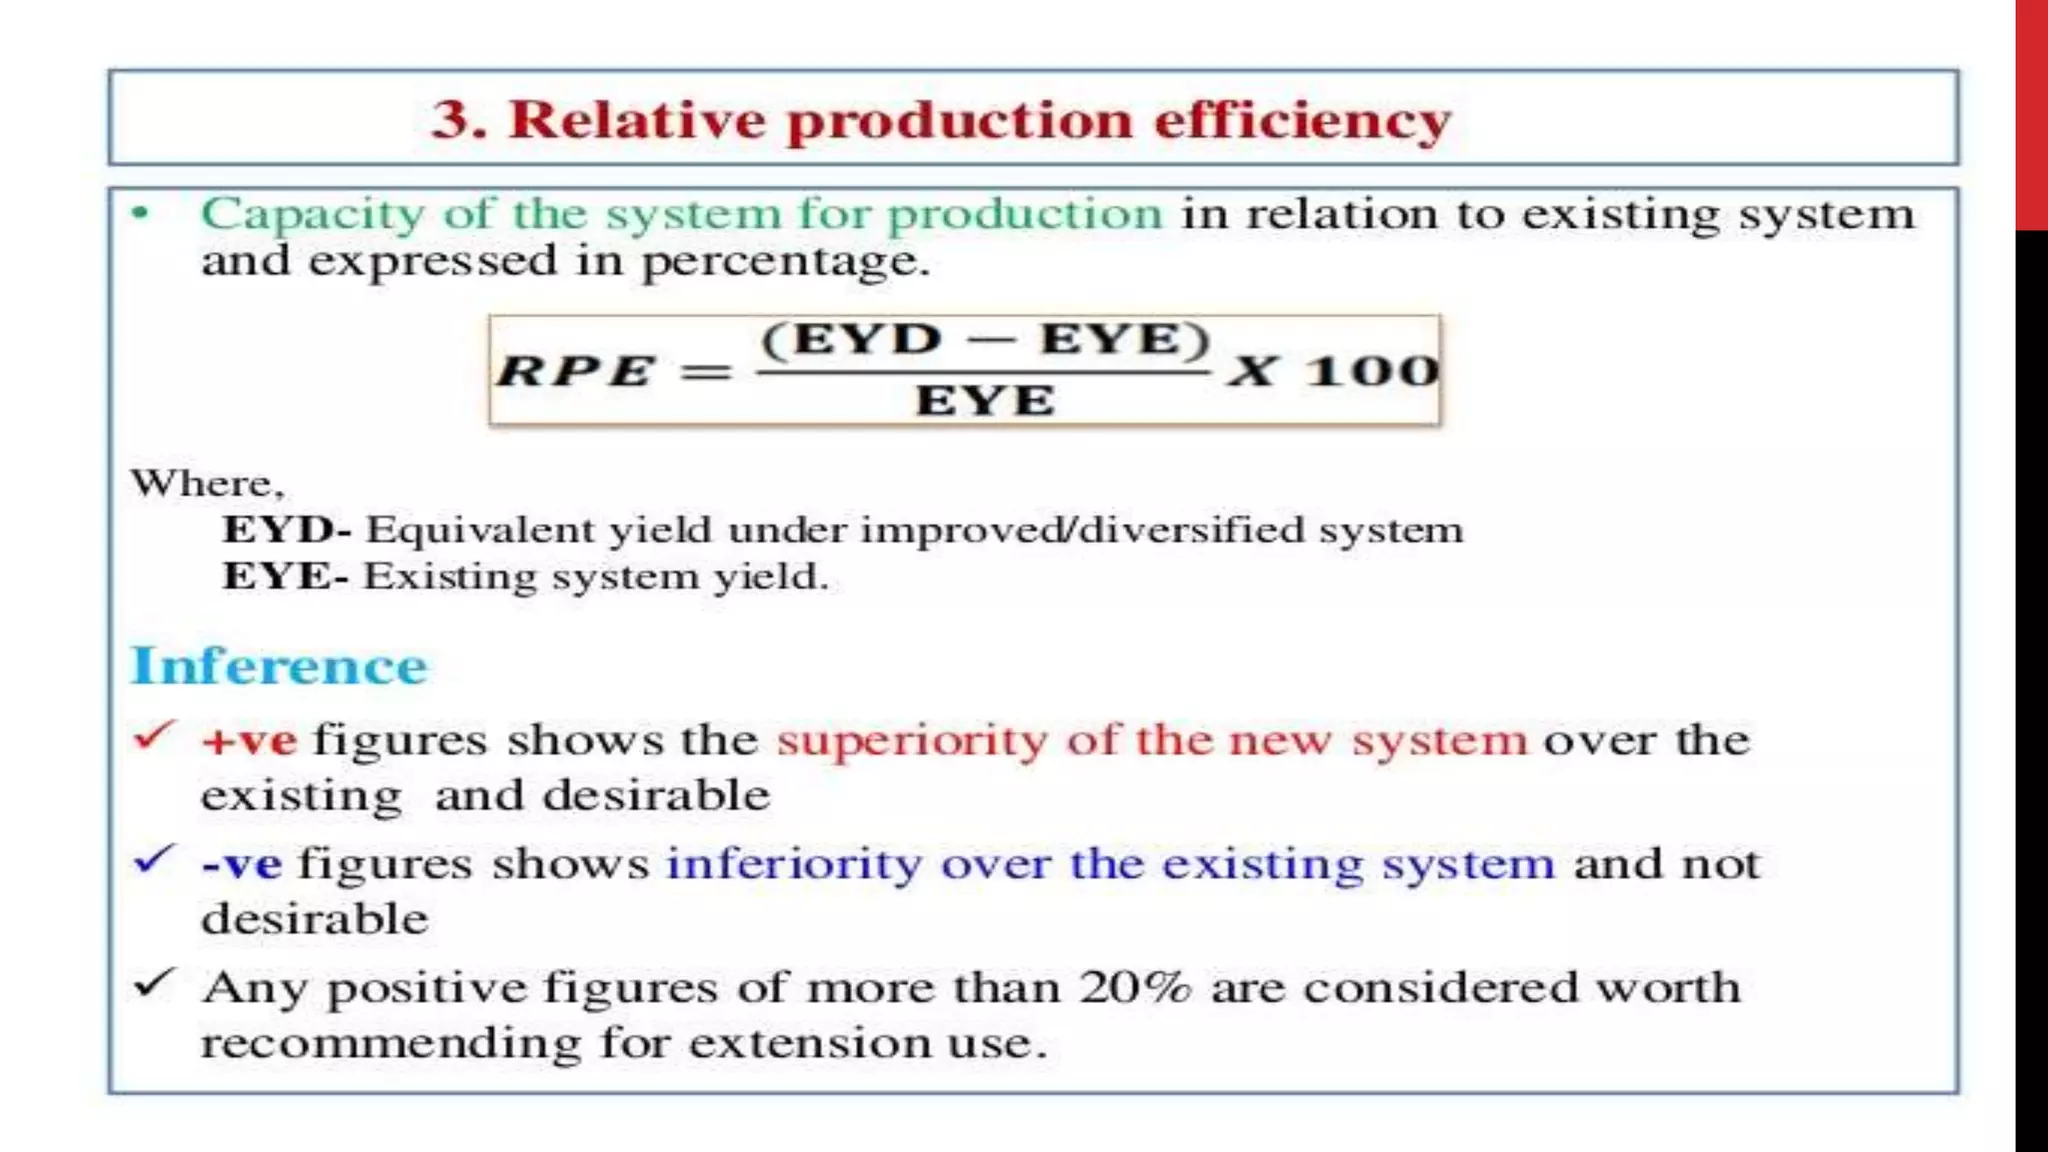
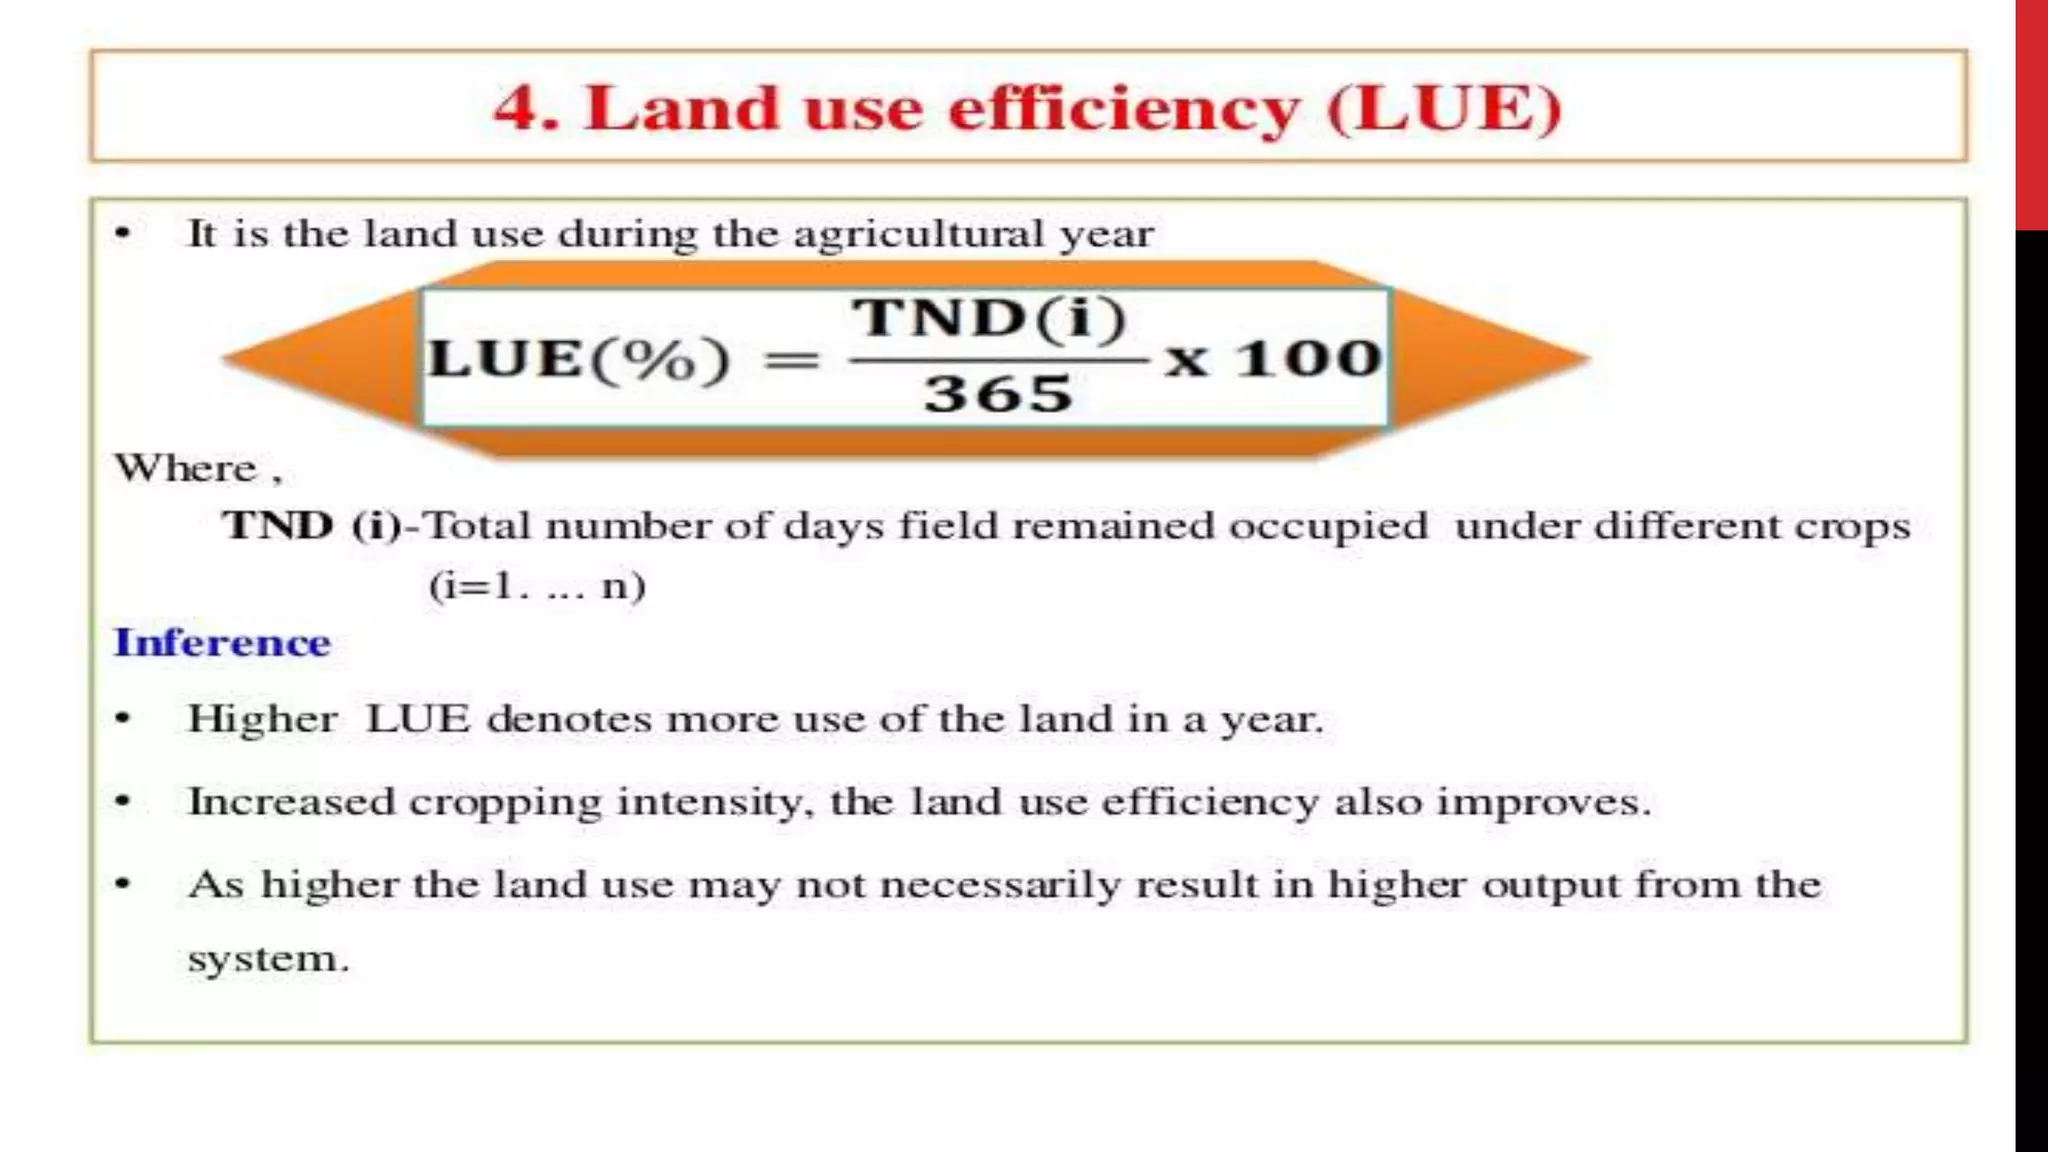
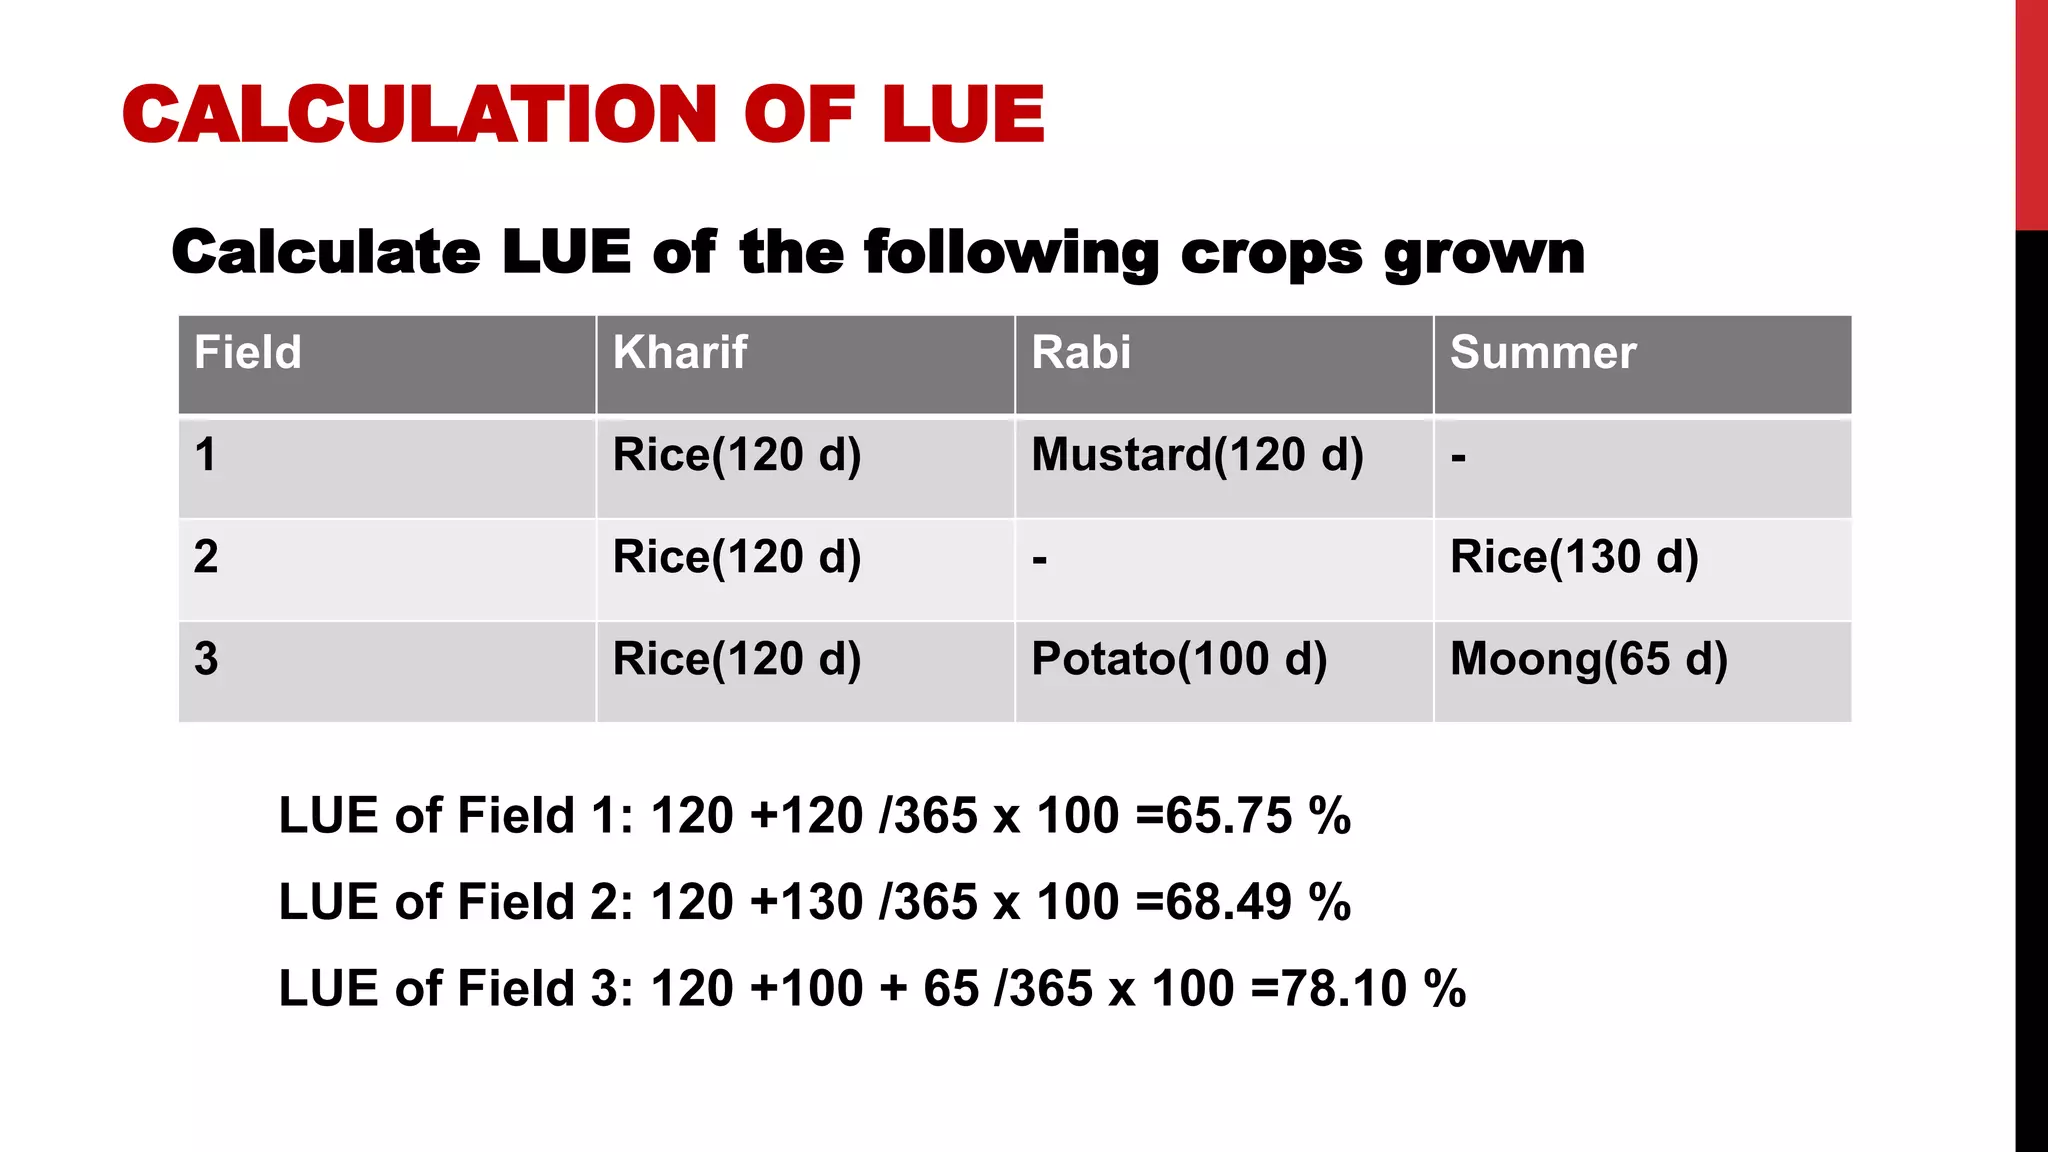
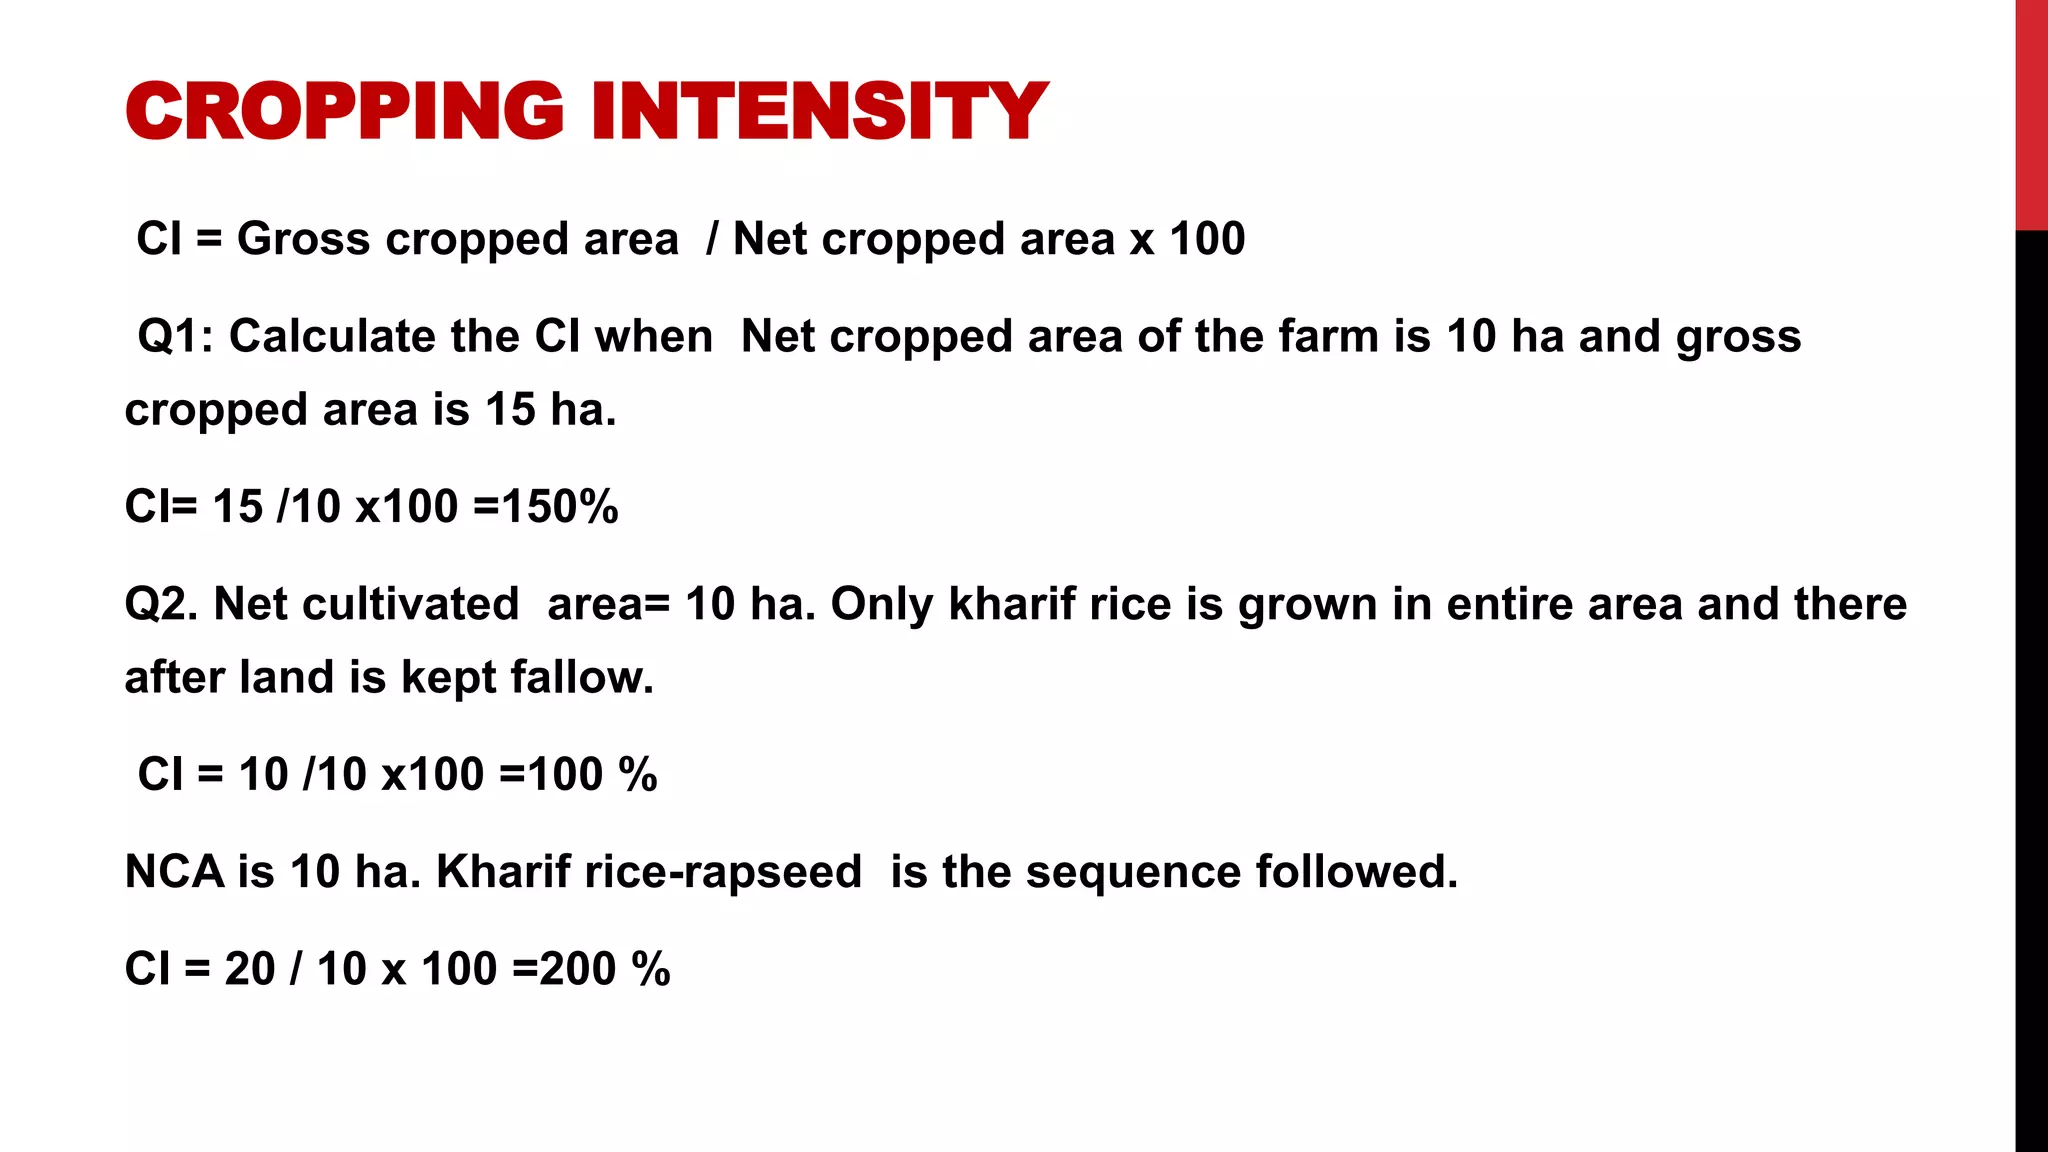
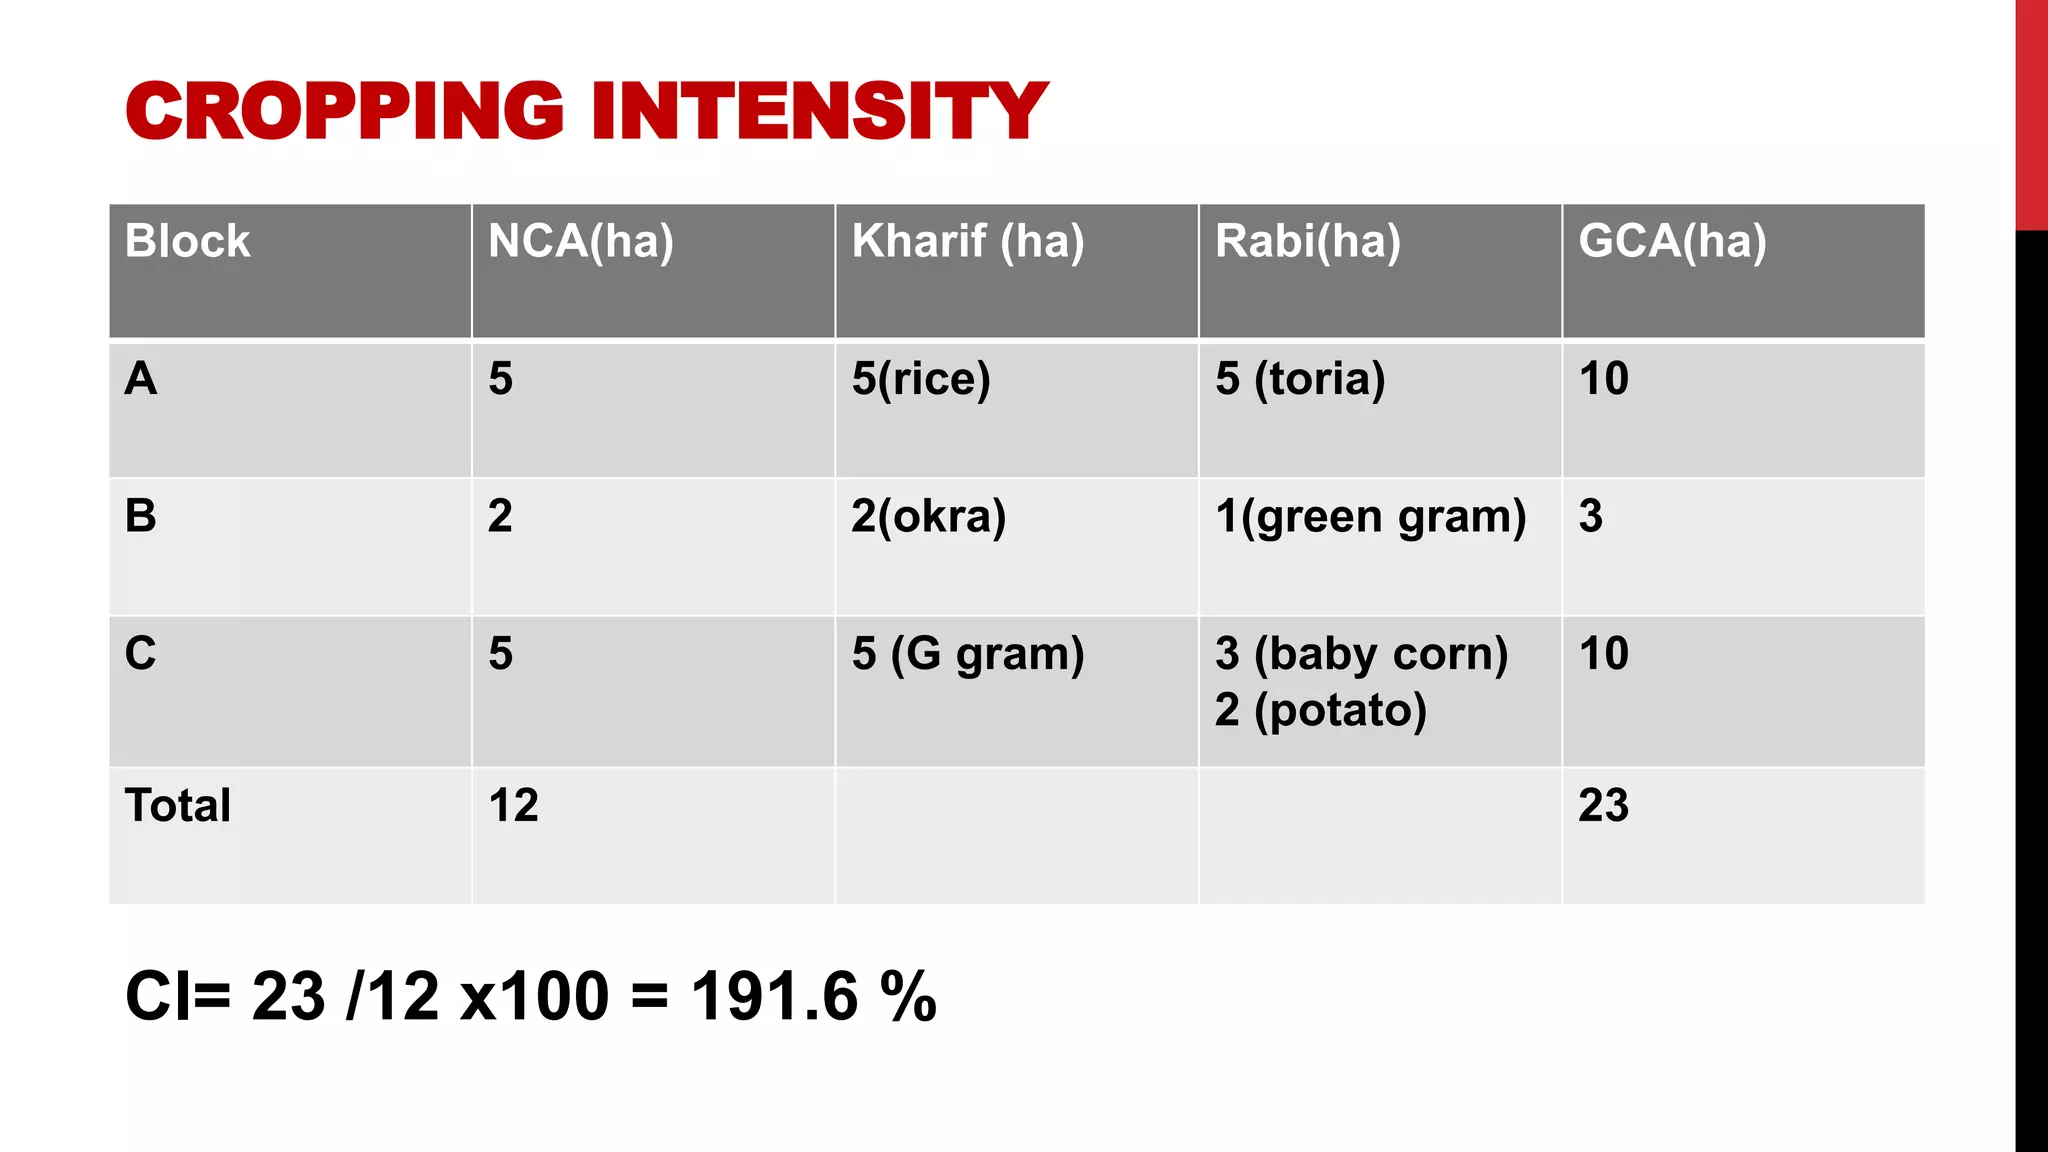
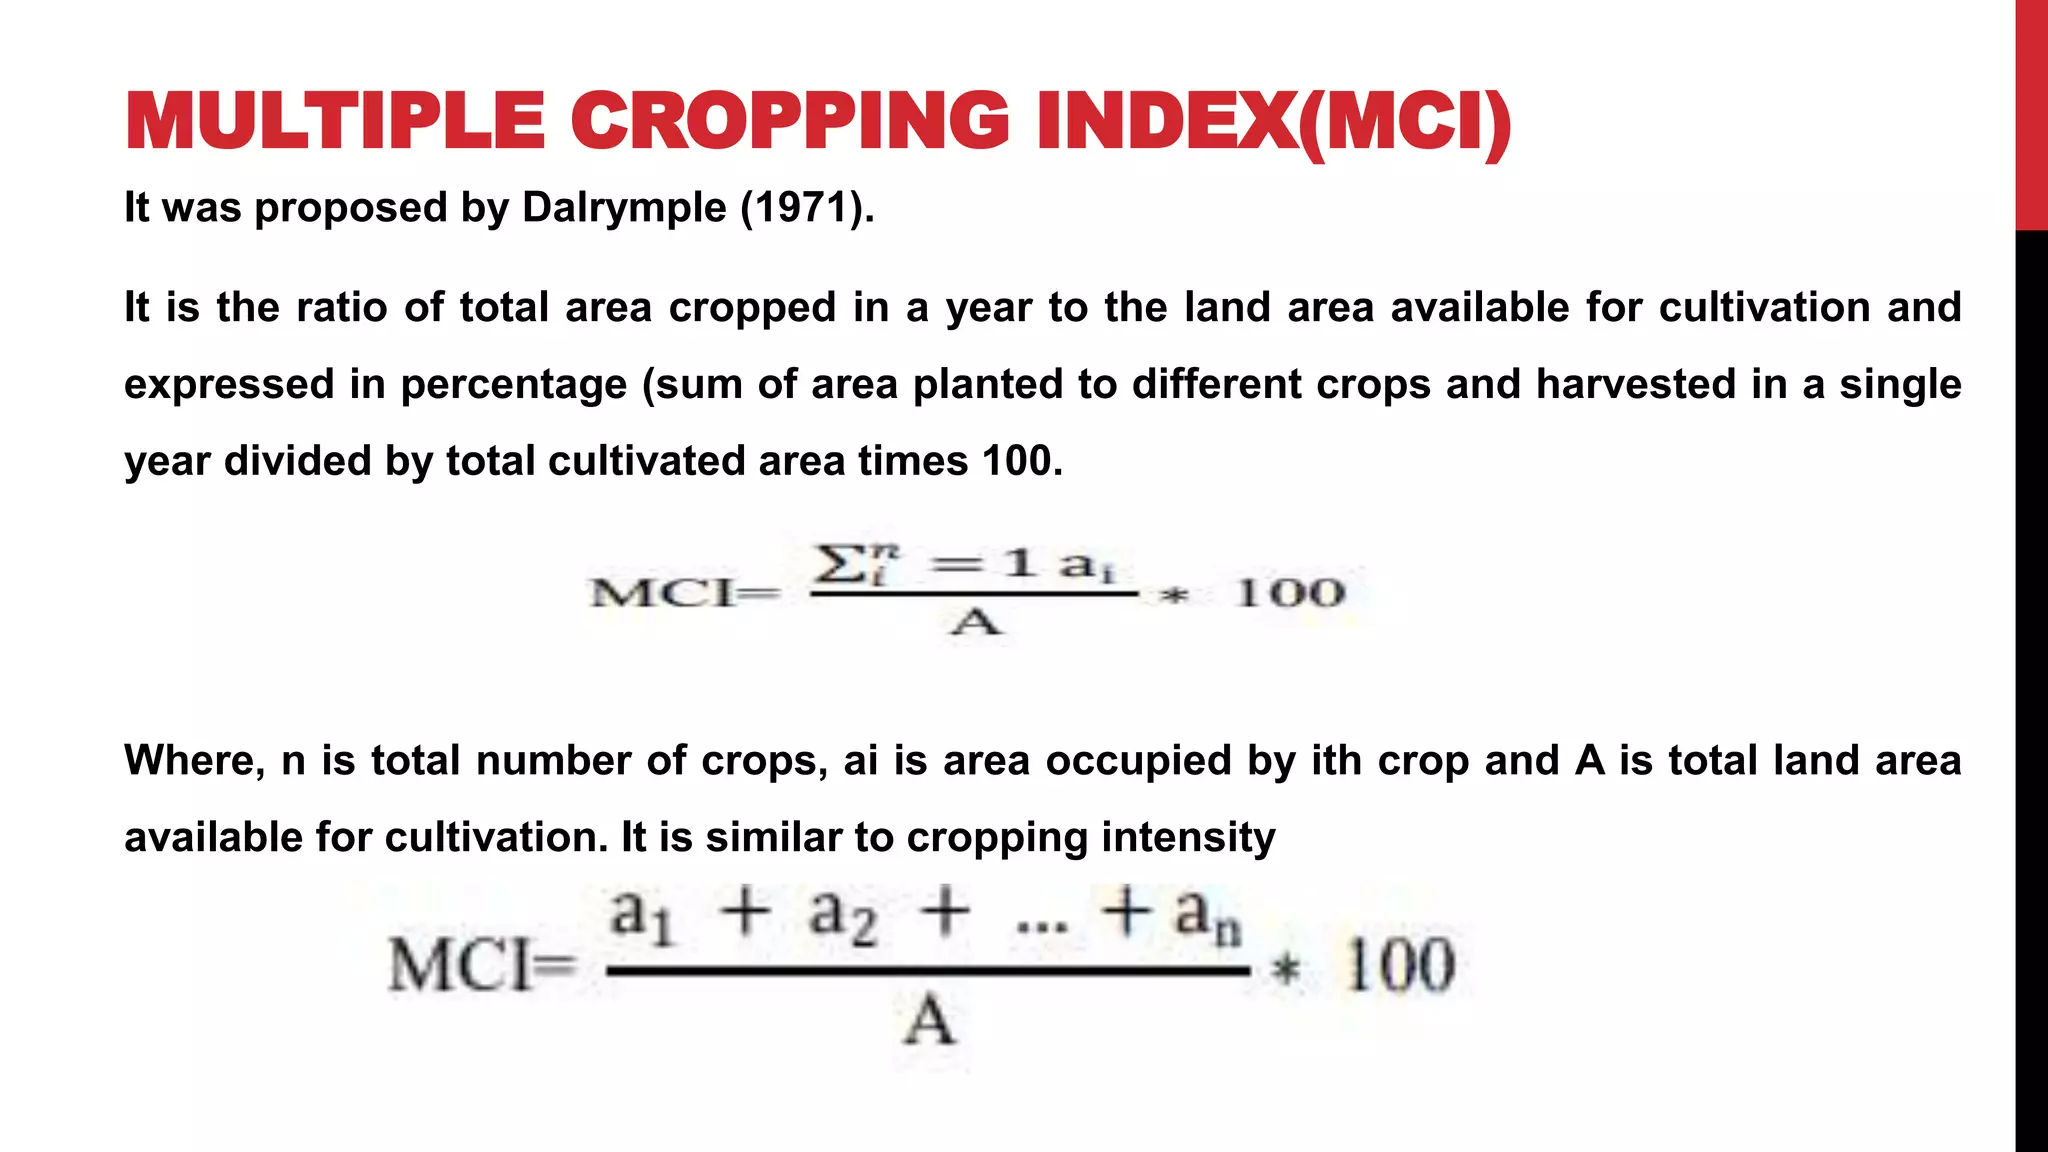
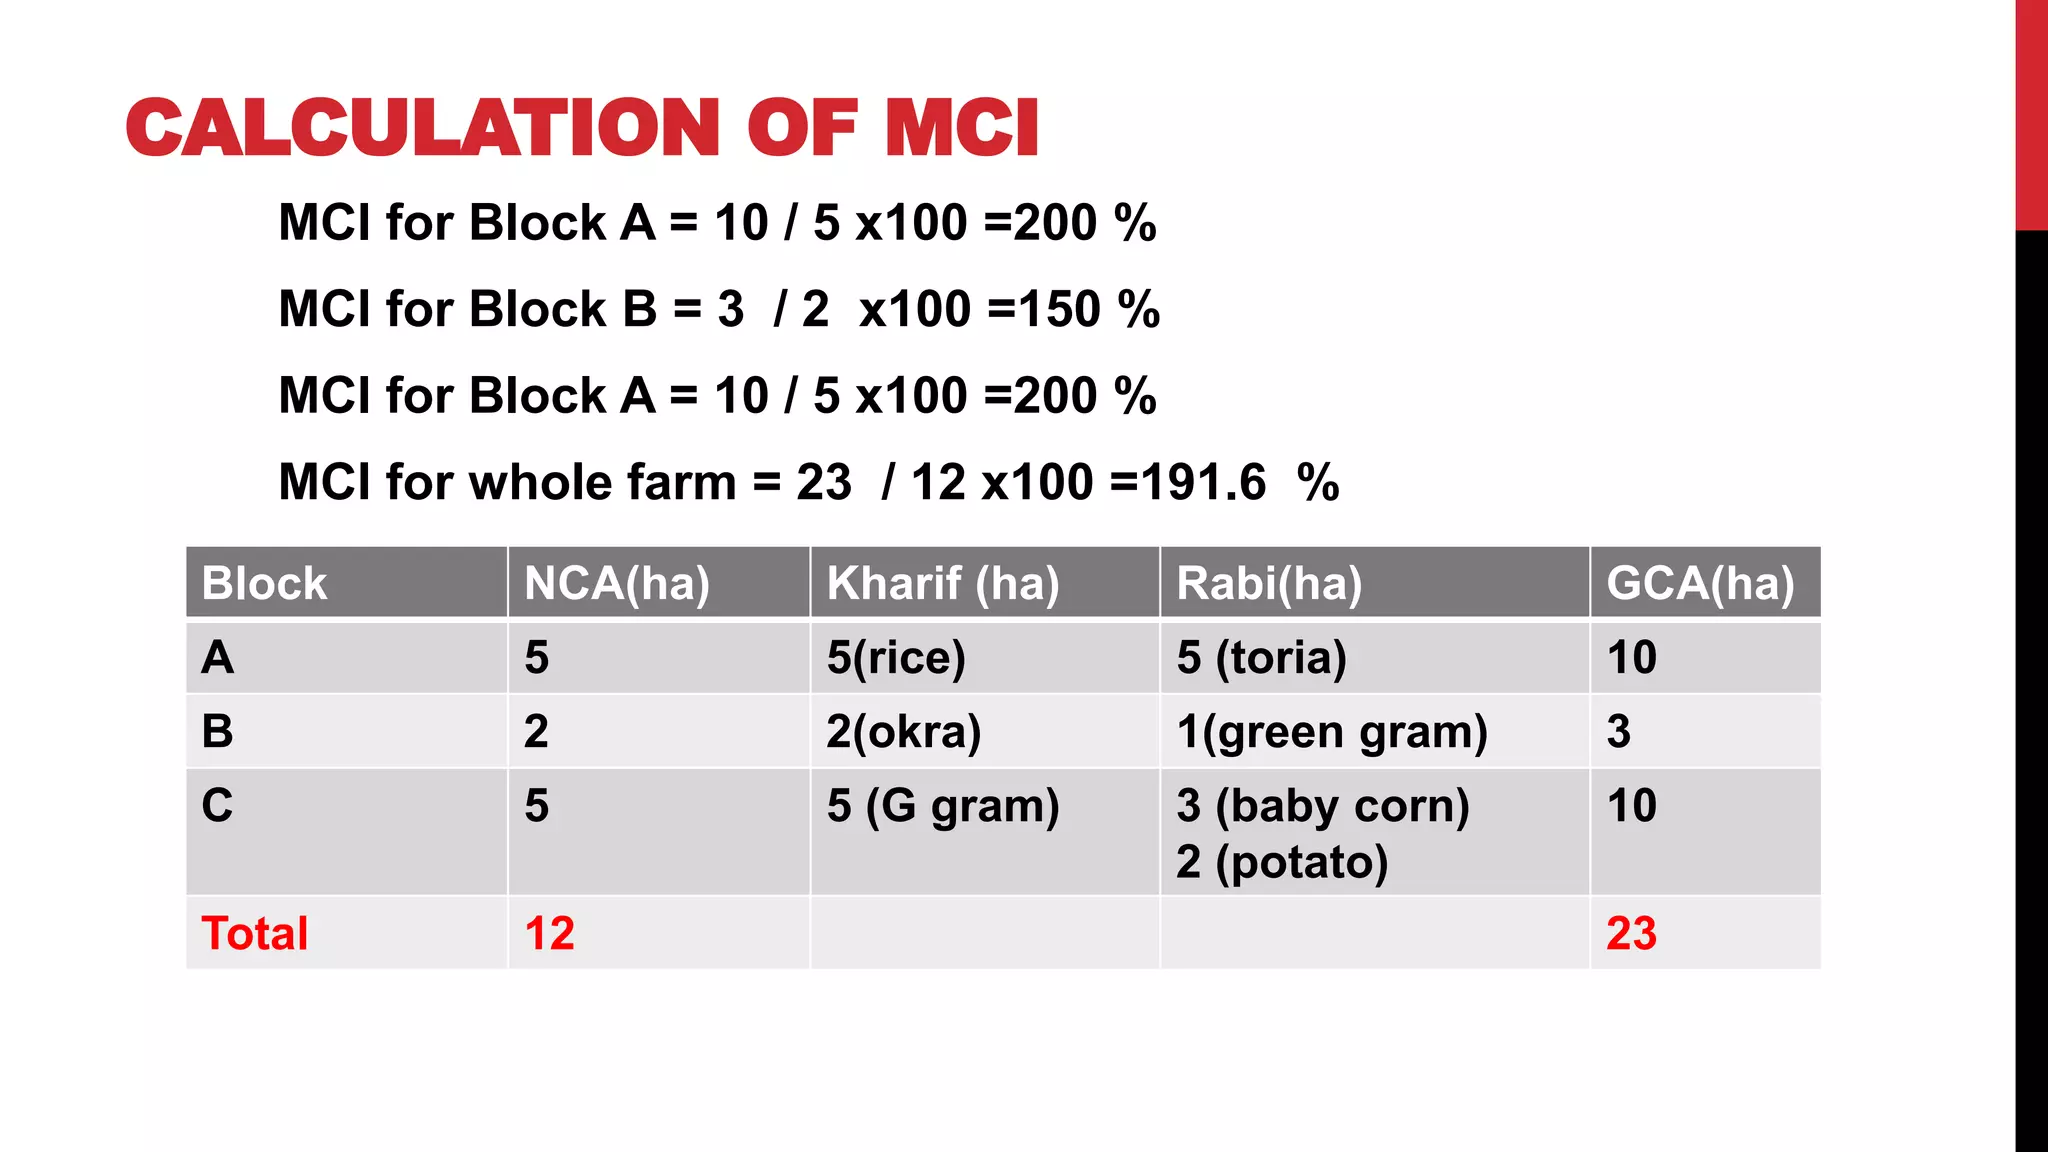
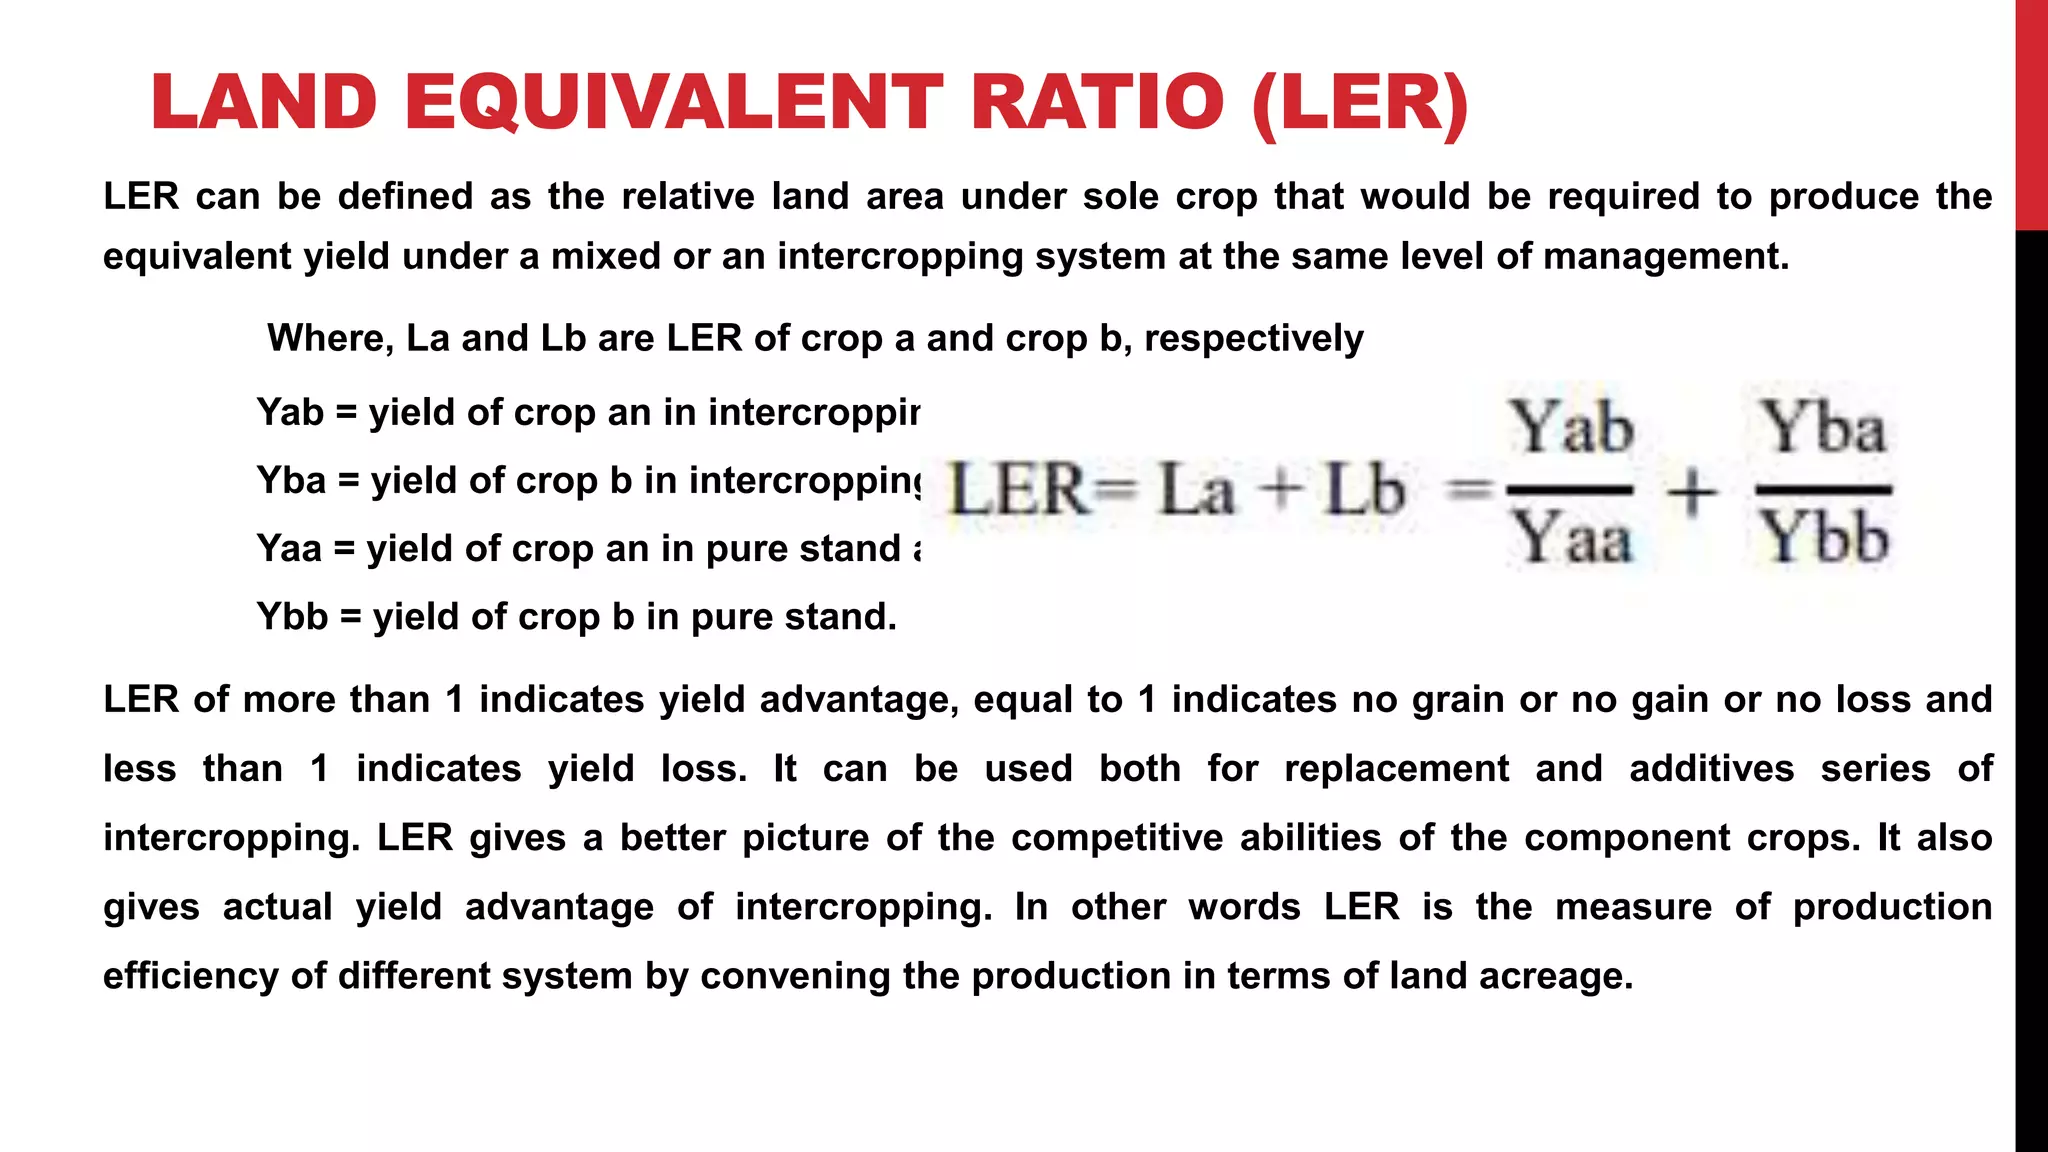
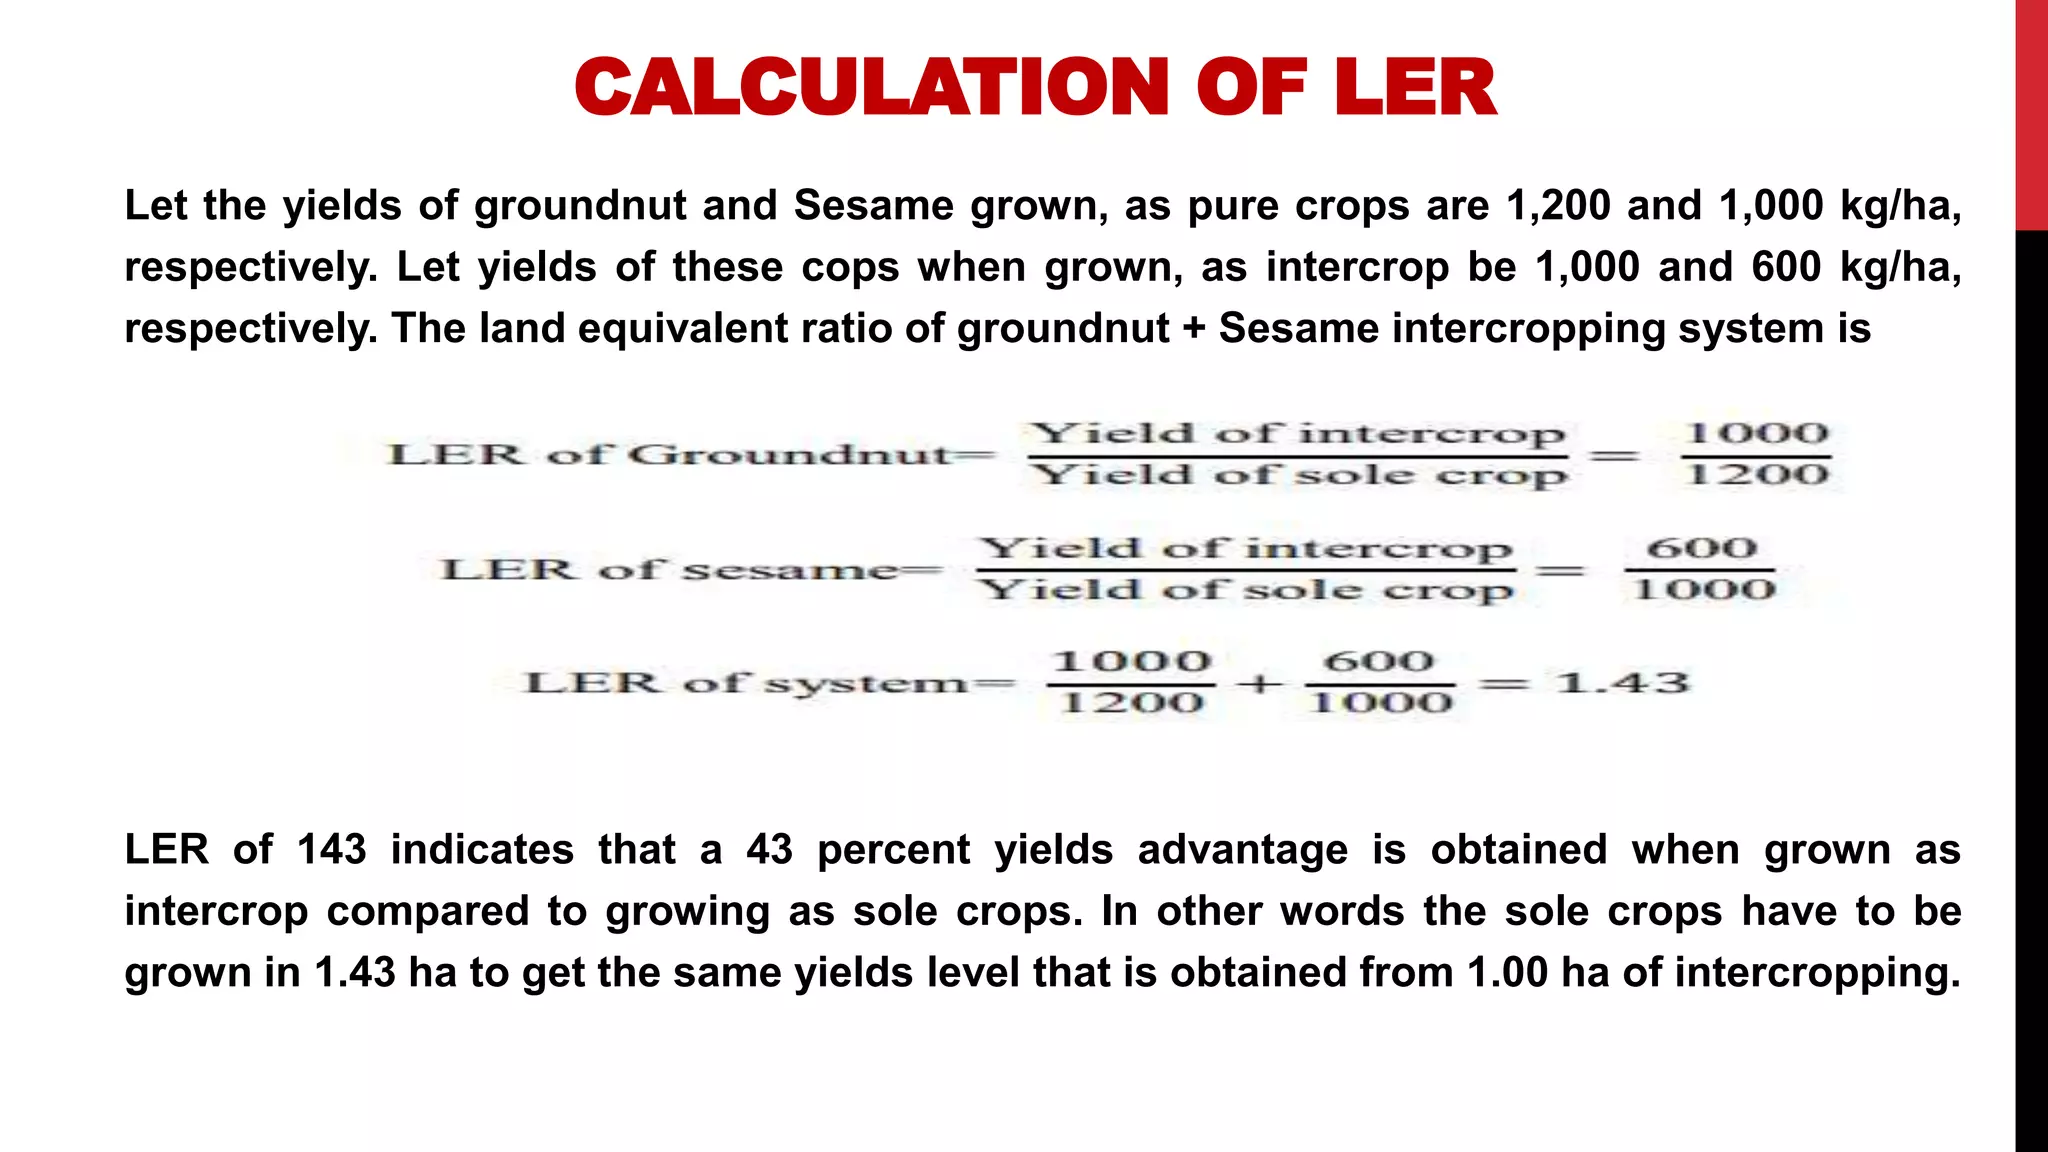
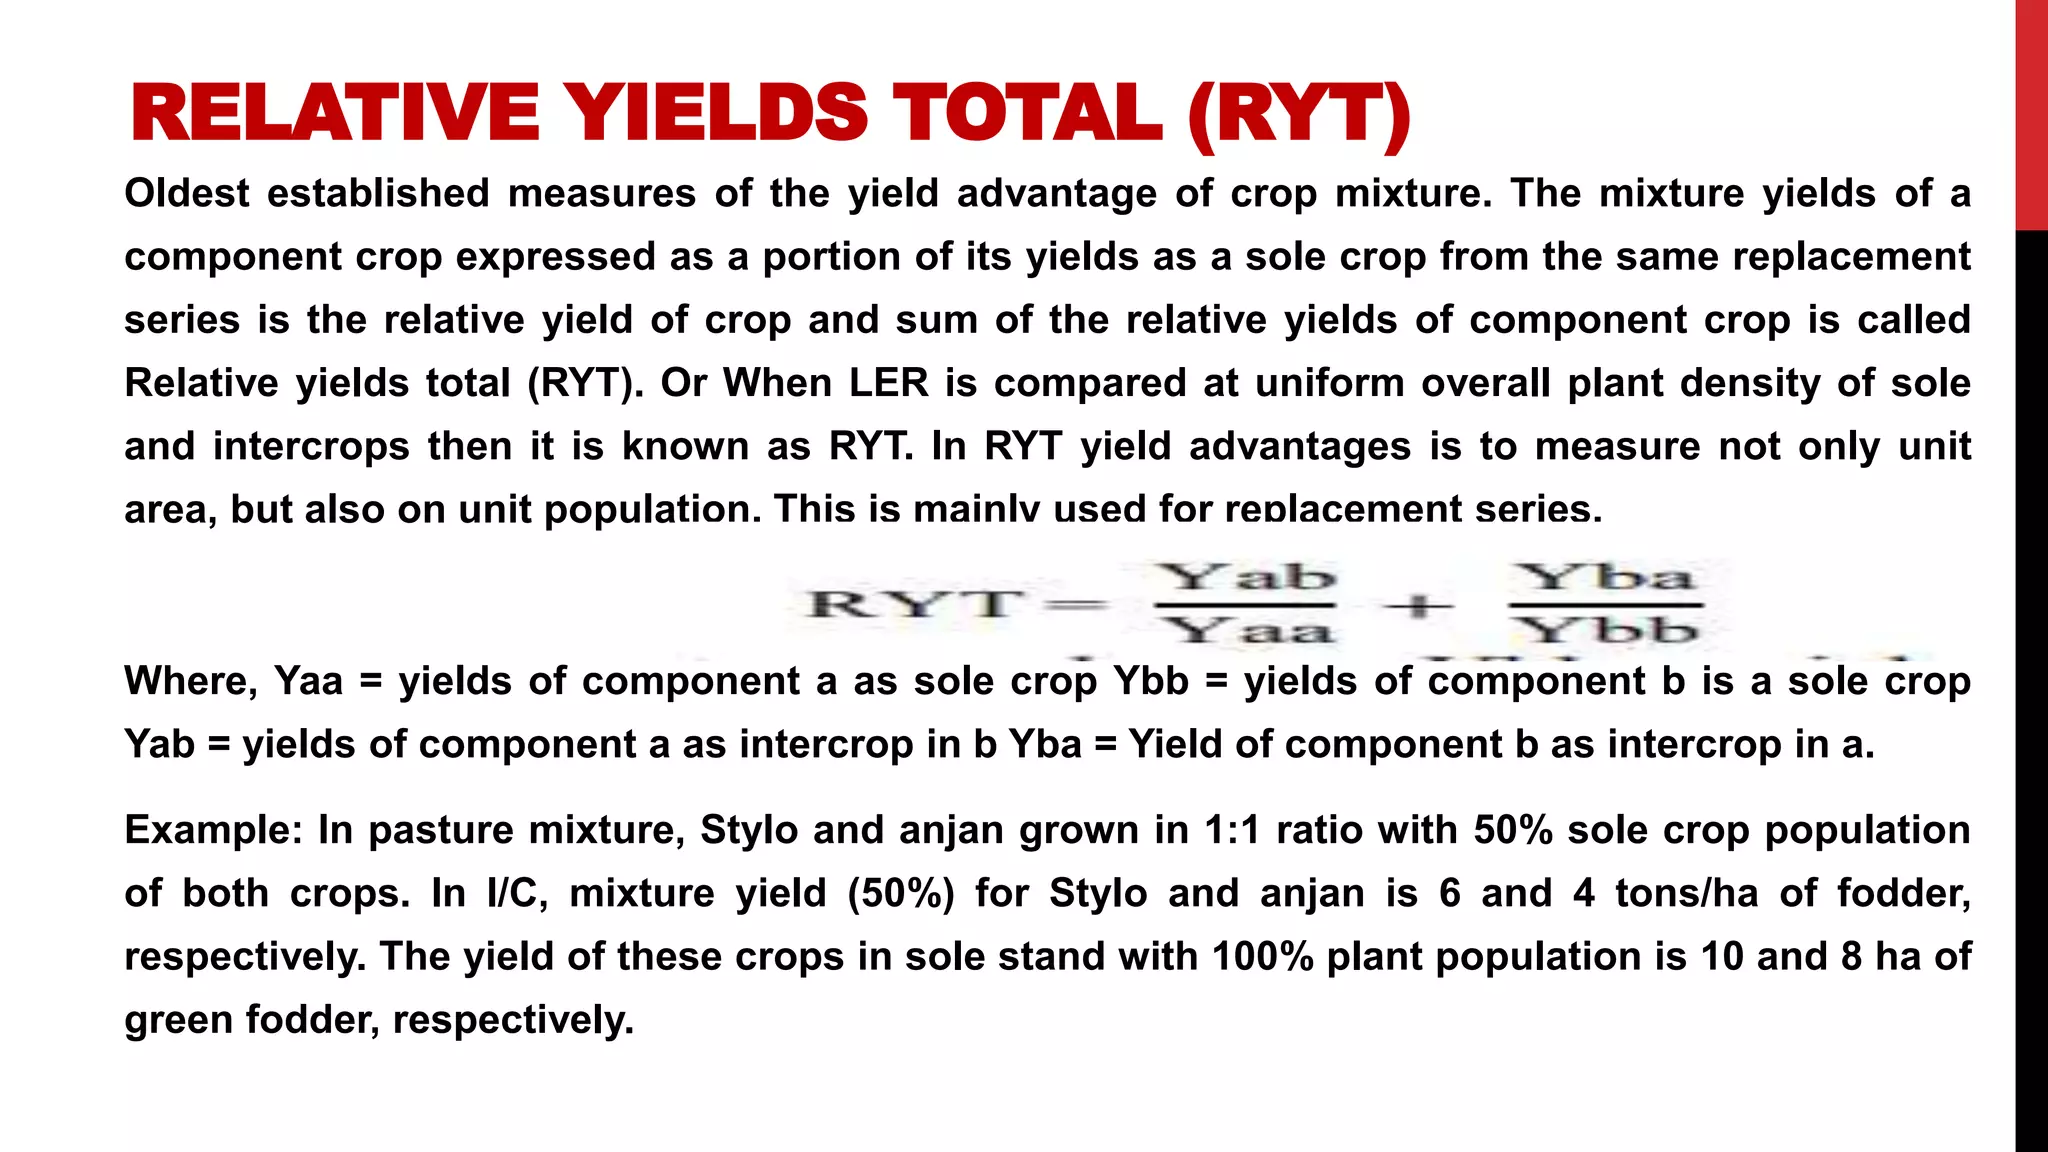
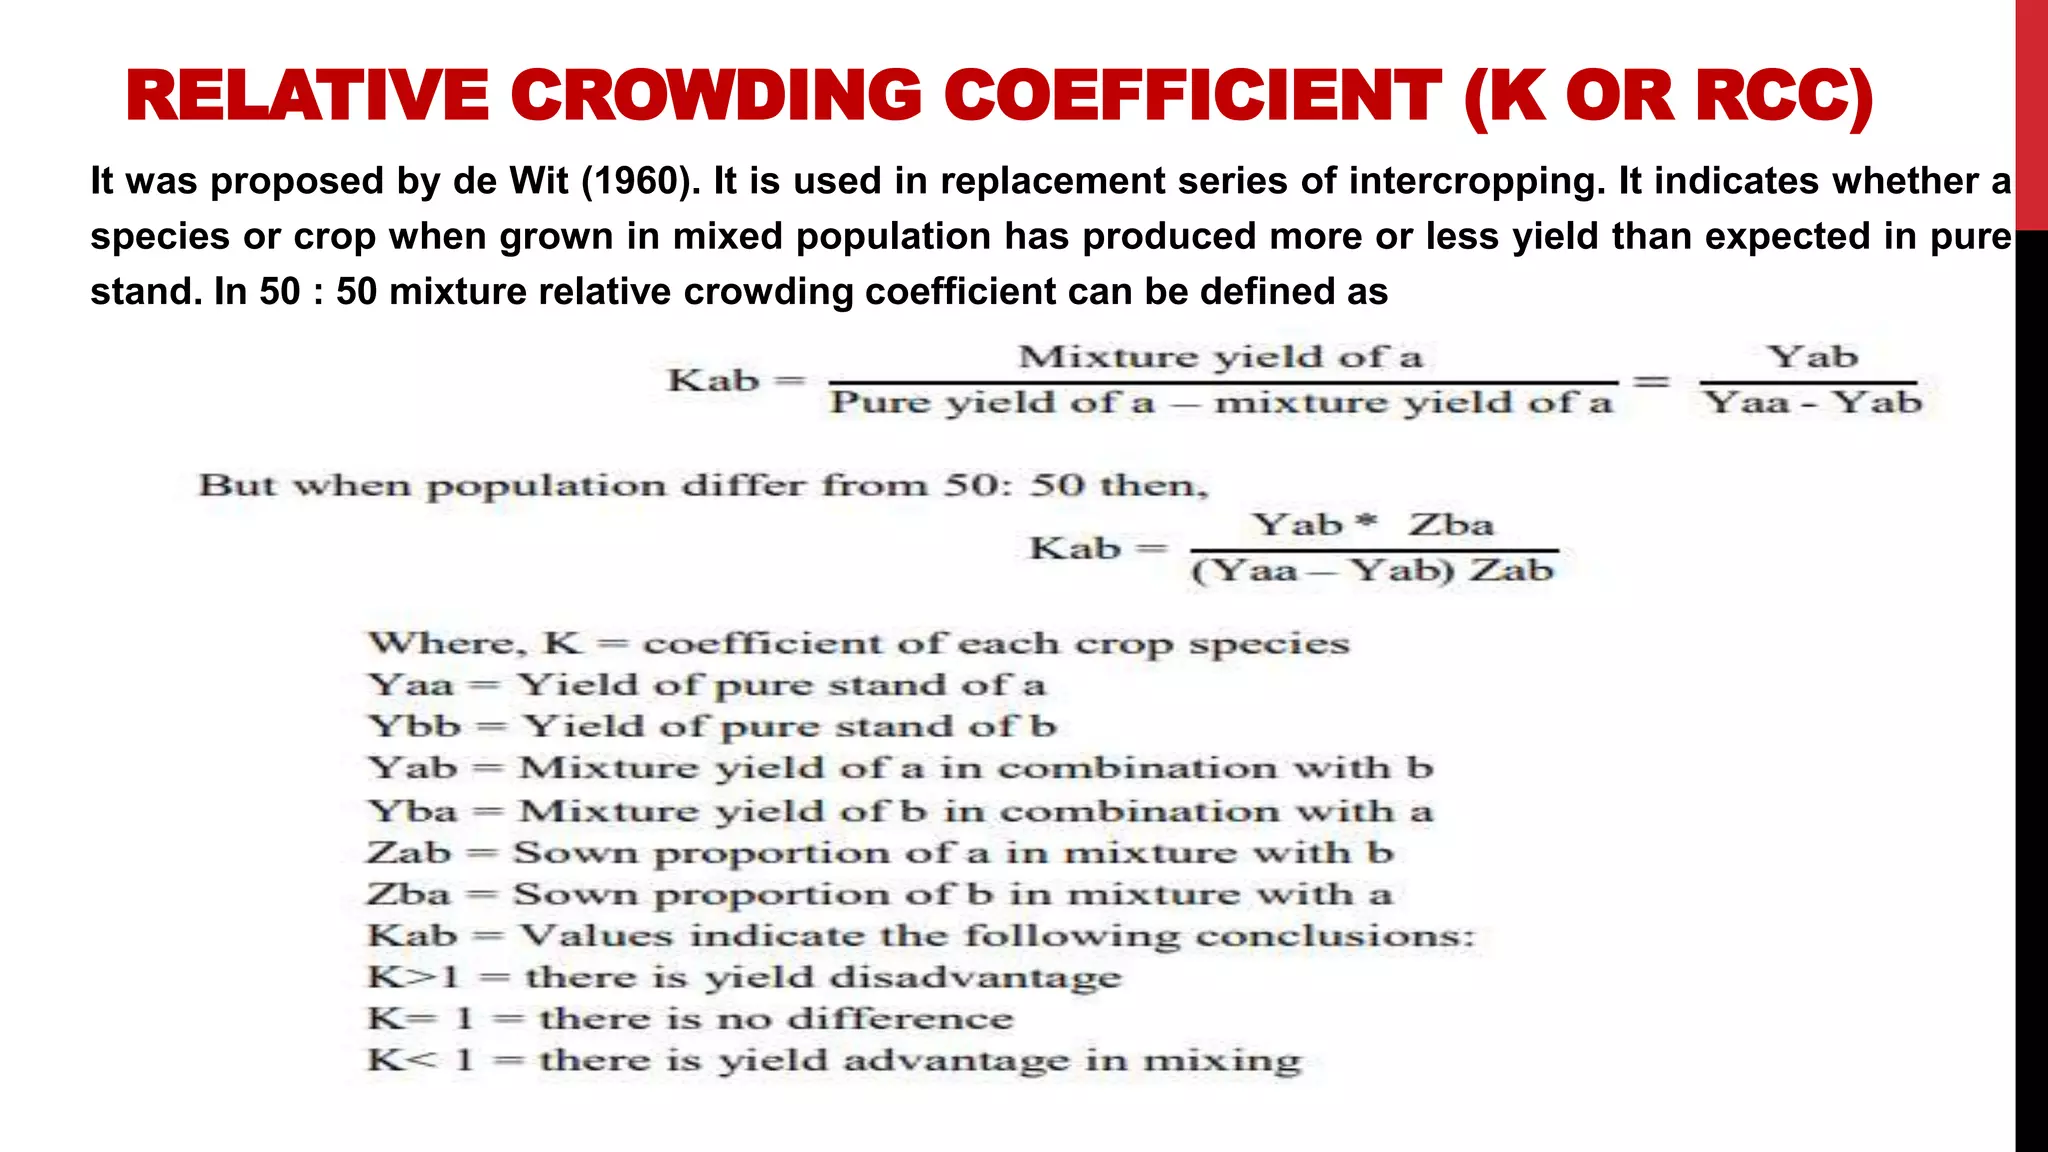
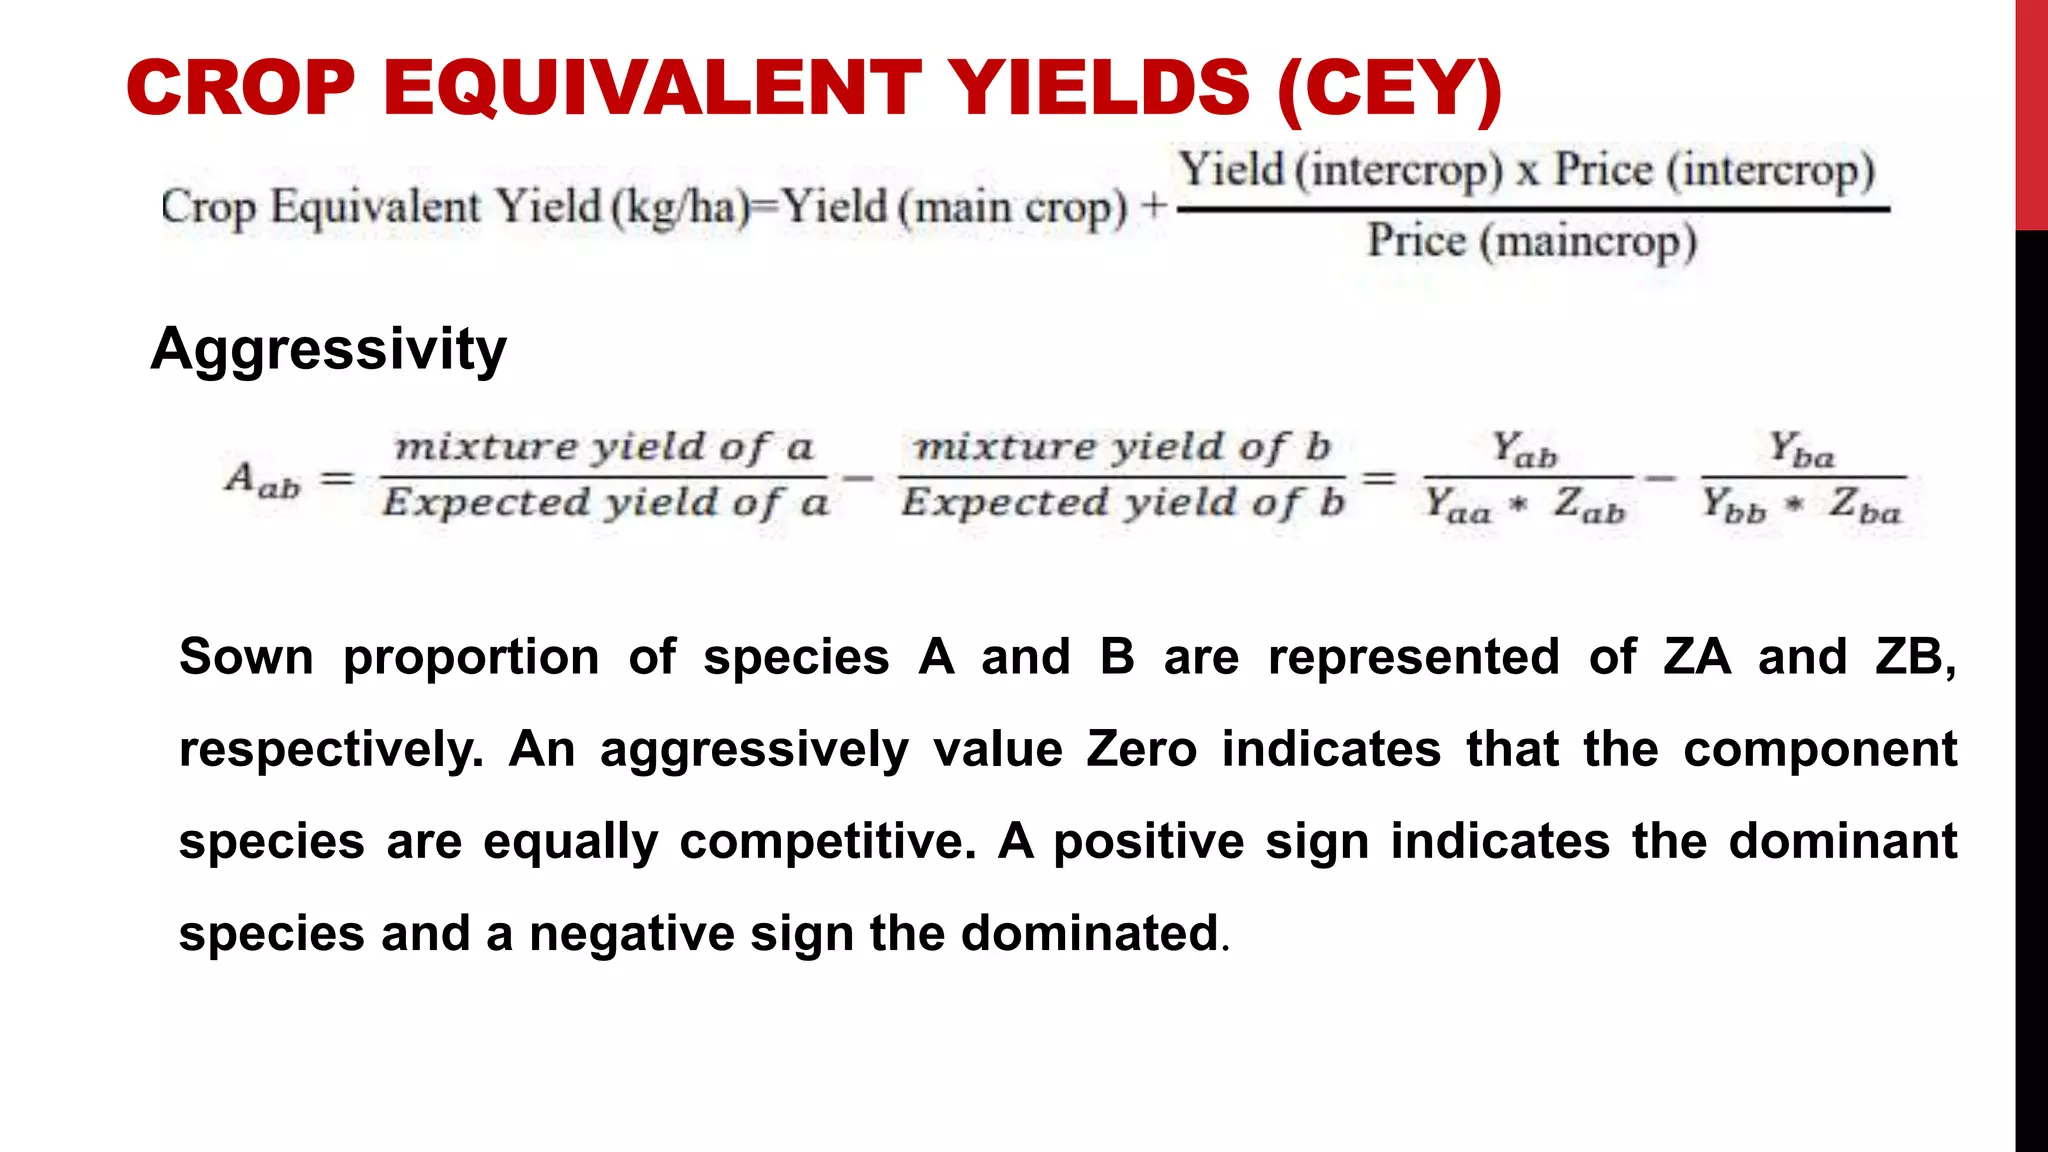
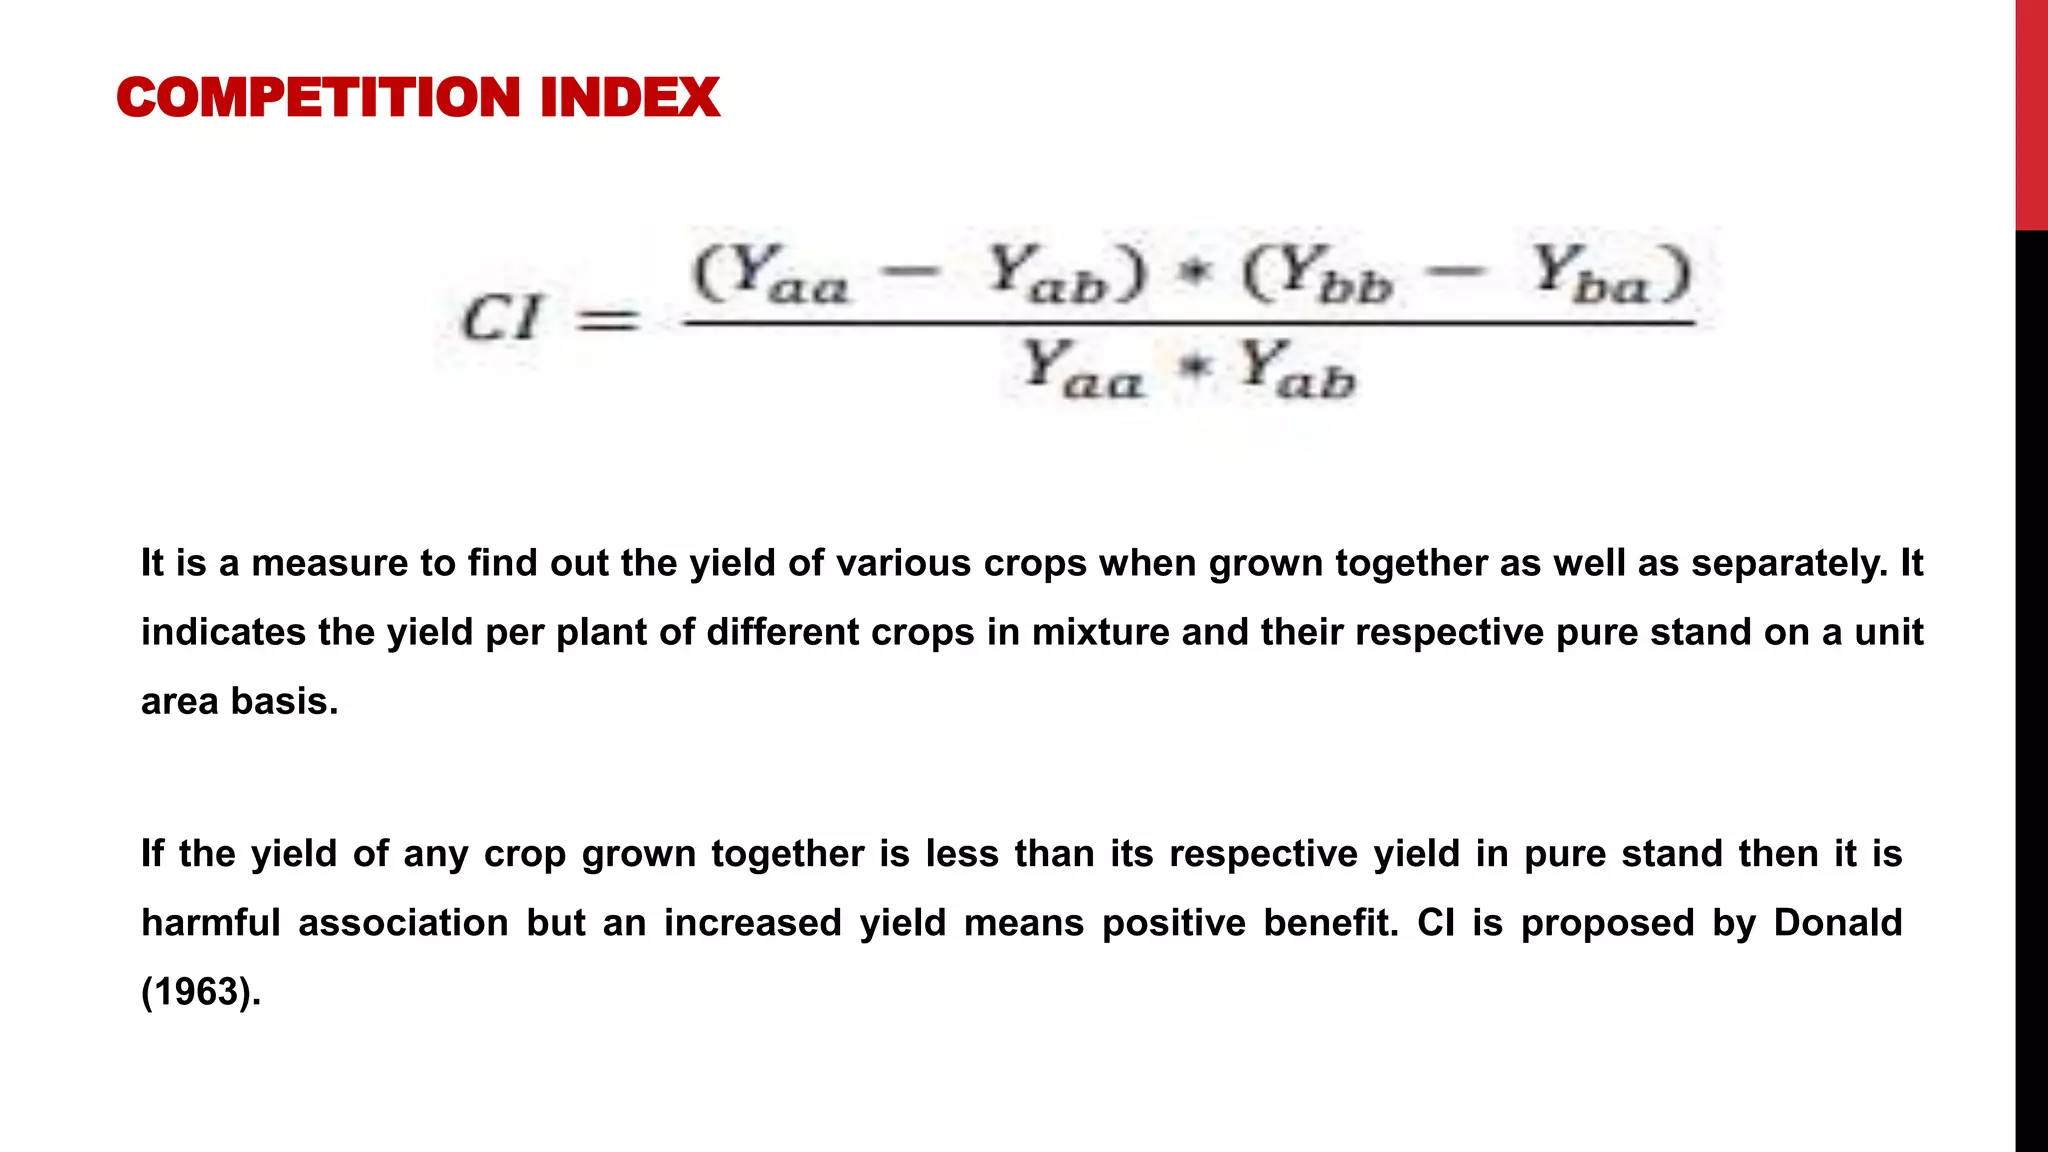
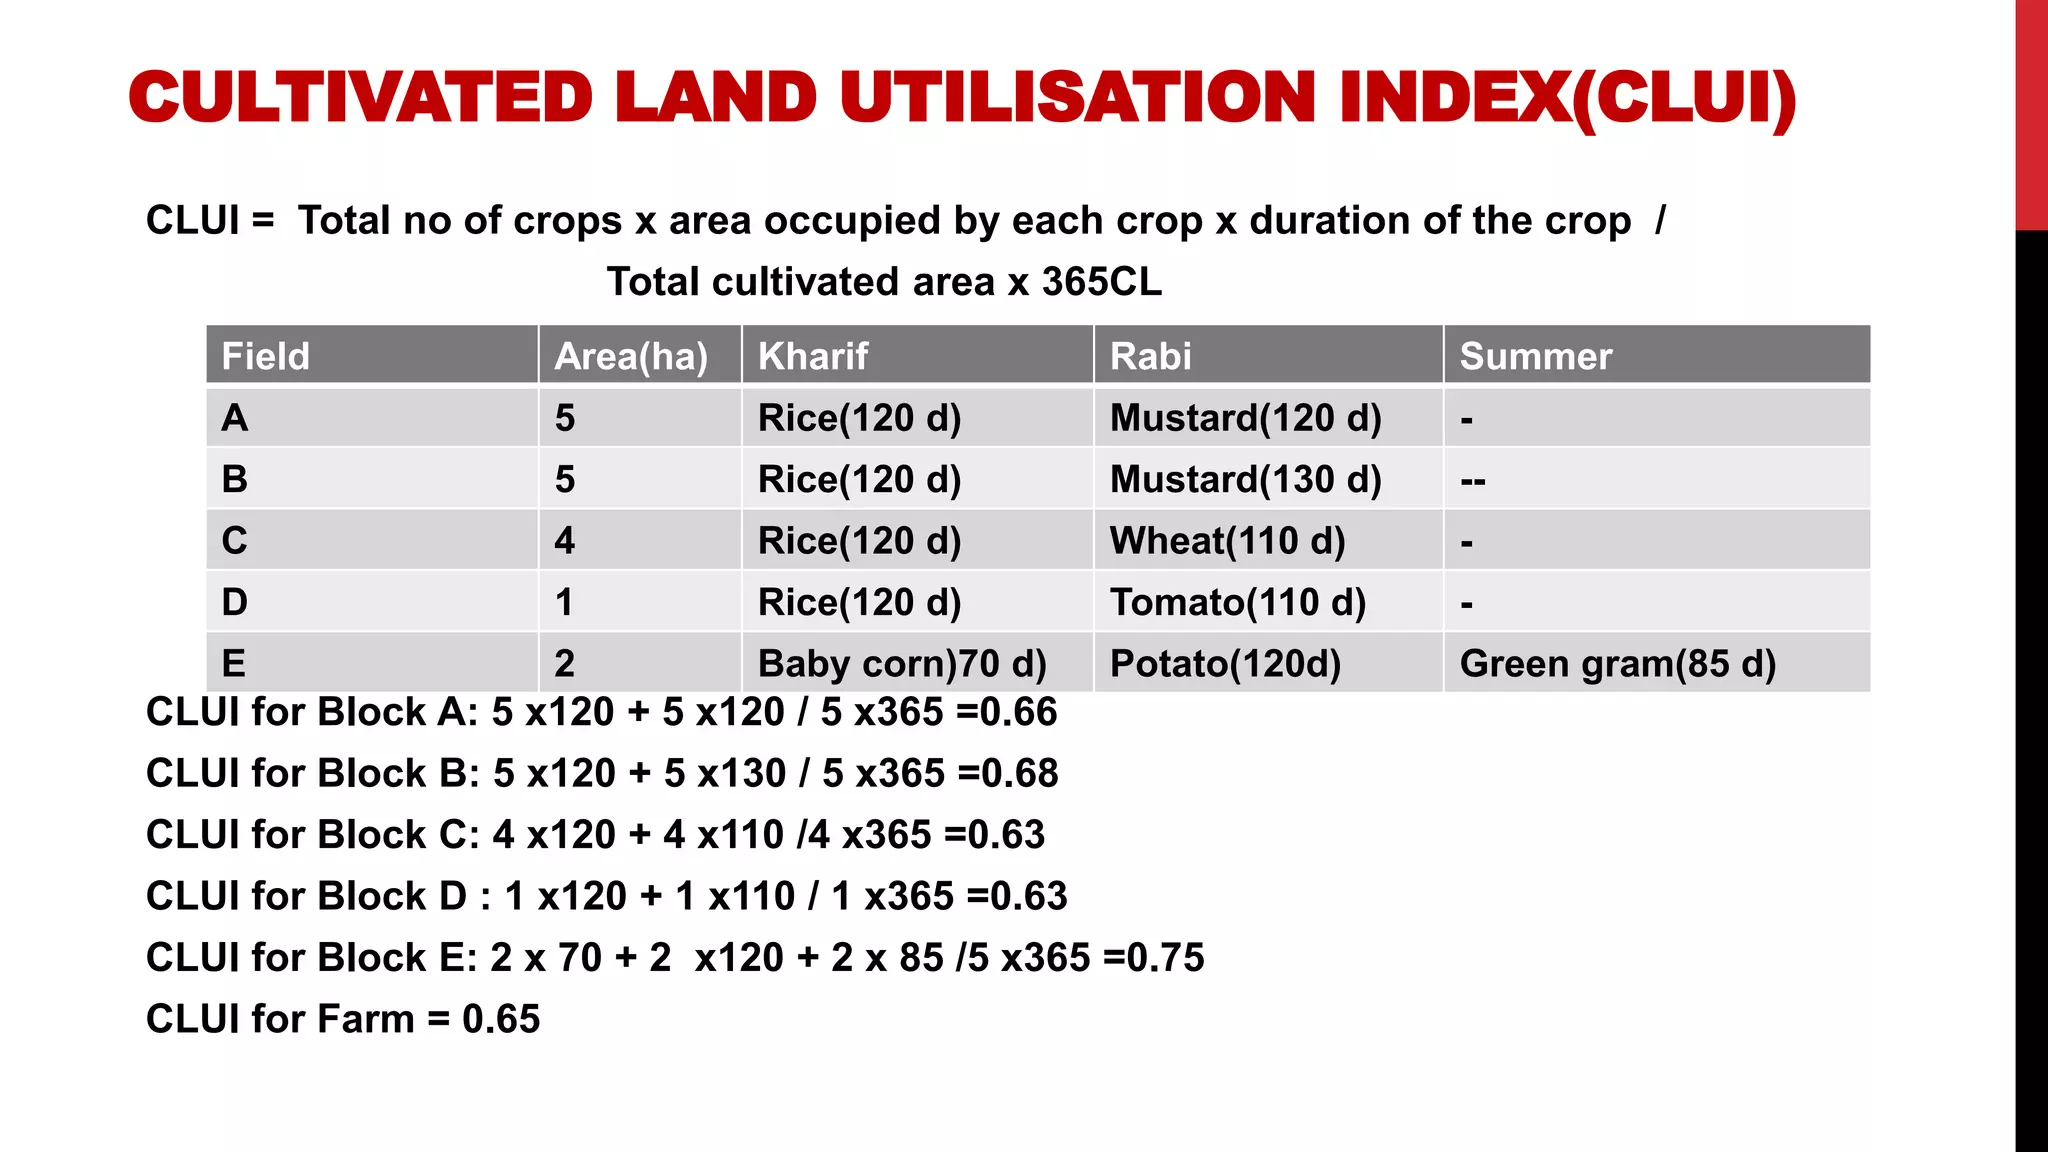
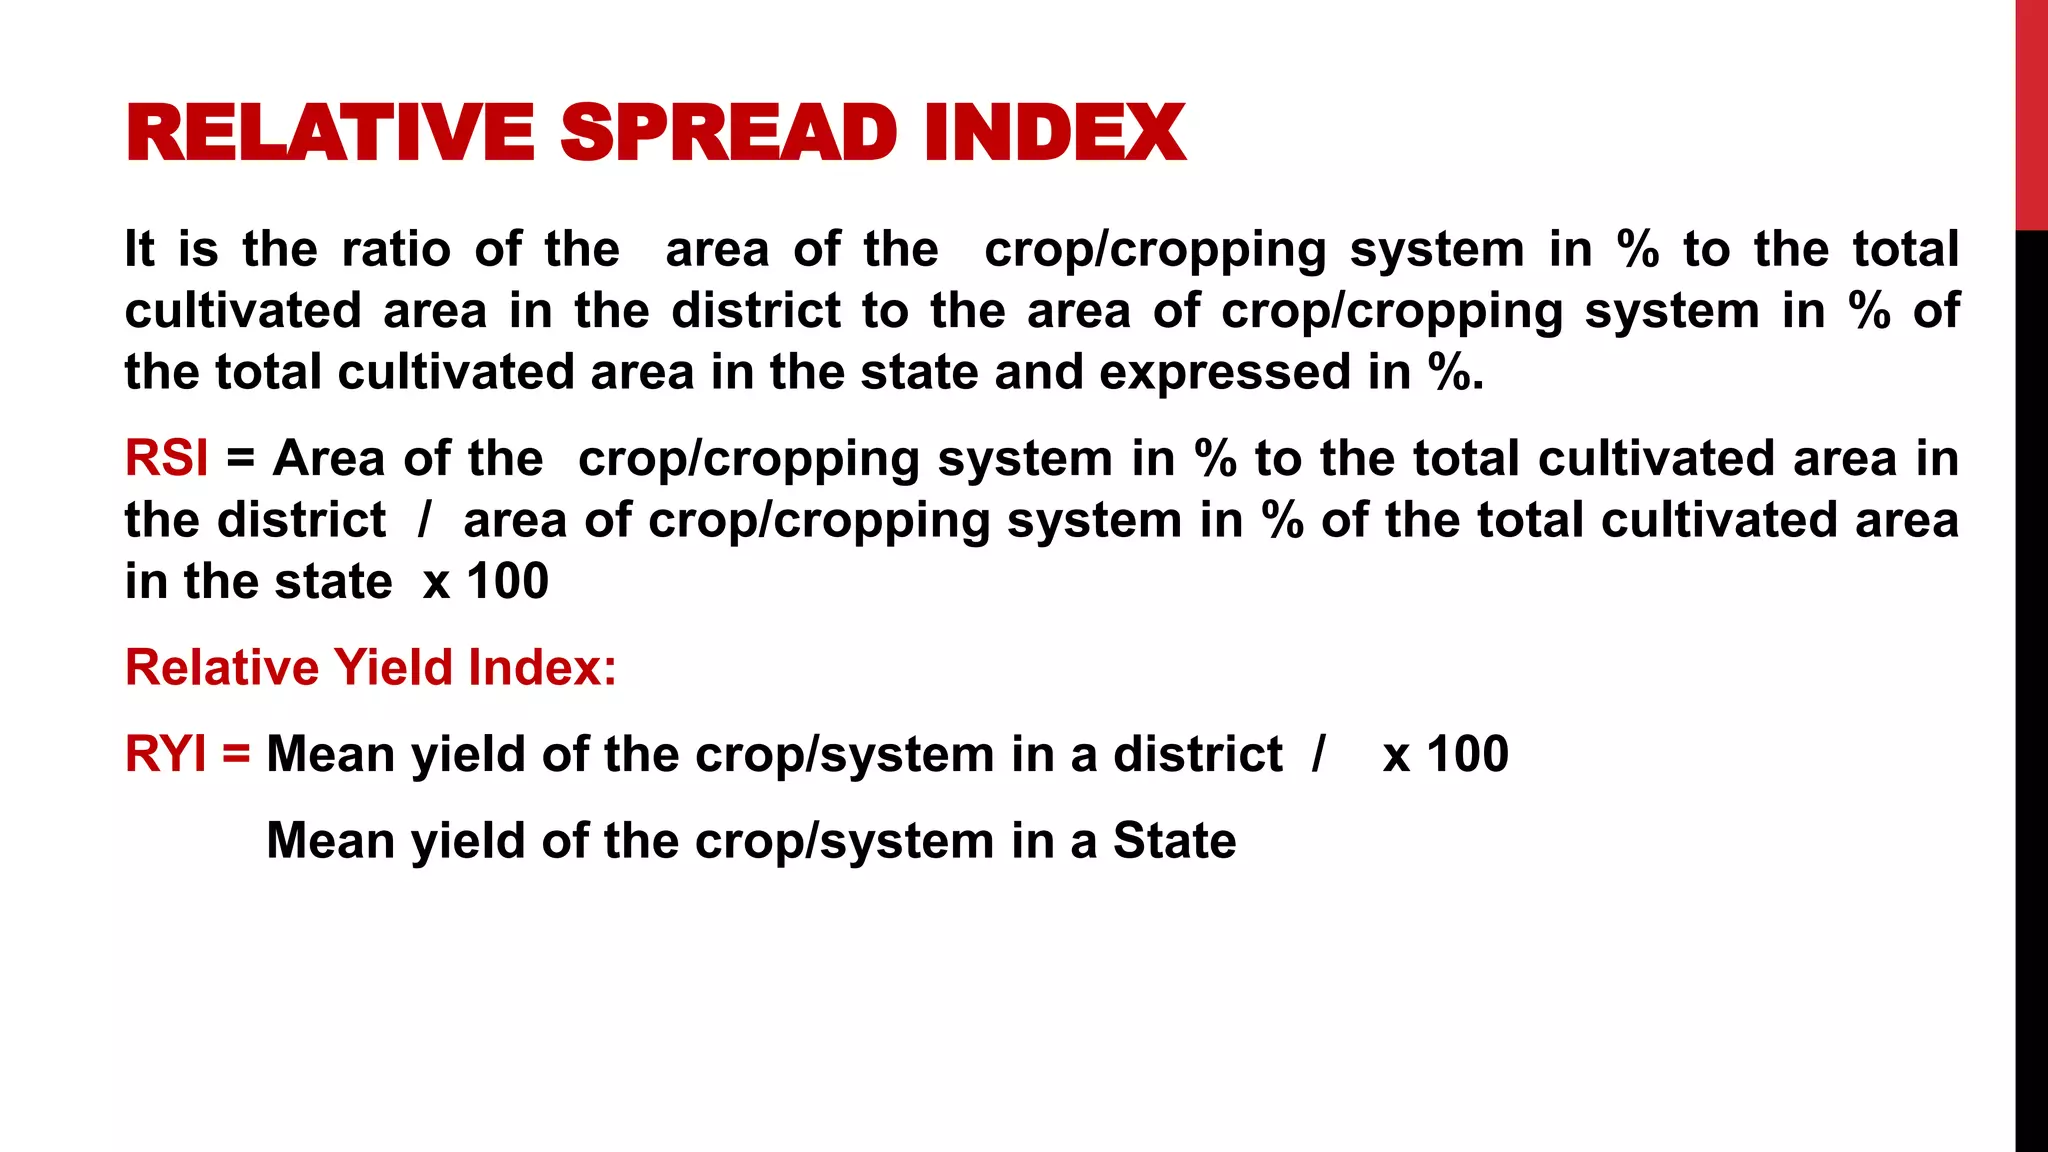
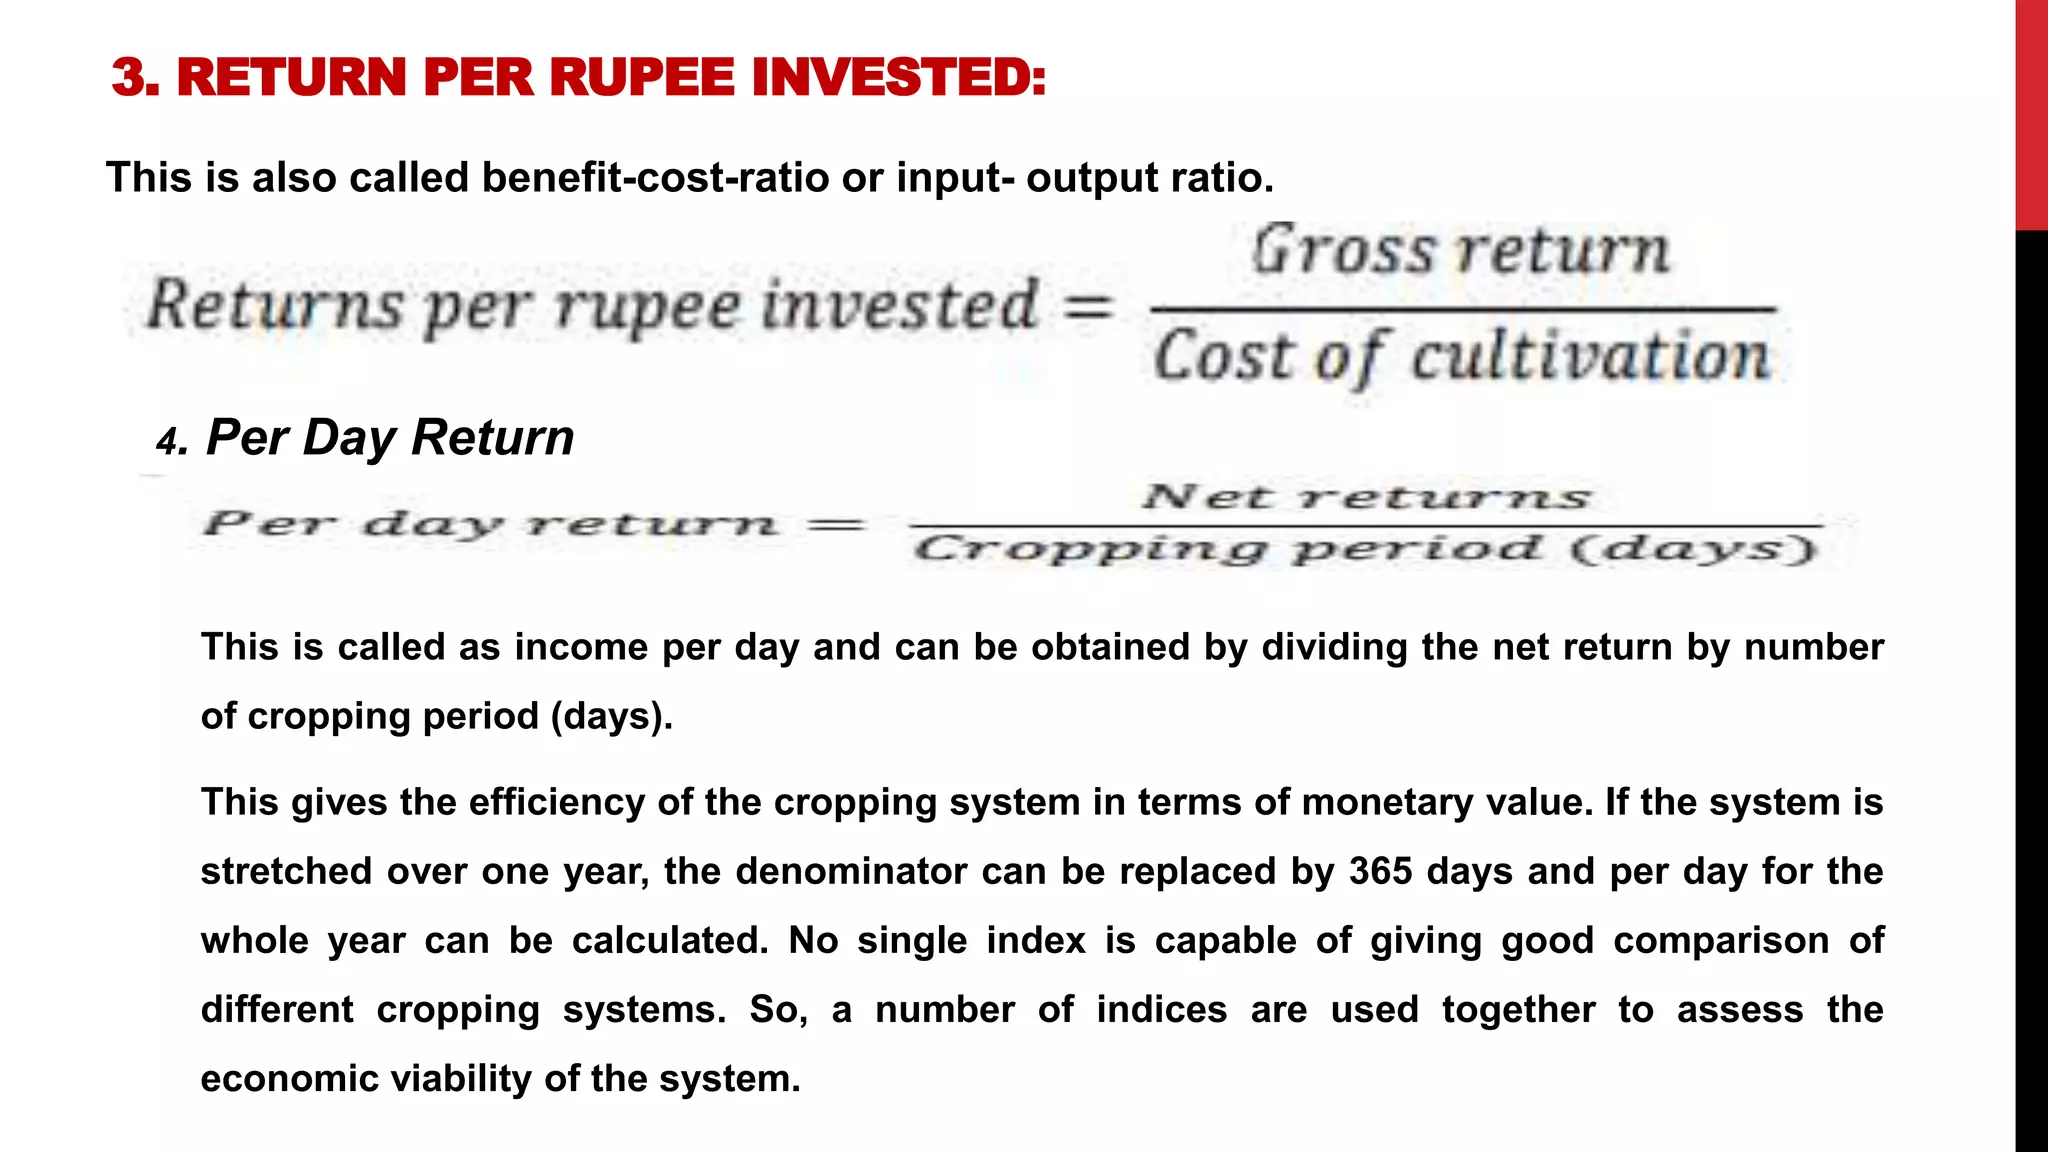
this slide includes recent approaches to evaluate cropping system.
It includes system profitability,relative production efficiency,land use efficienct(LUE),Calculation of LUE,energy efficiency,specific energy,Rotational intensity,Cropping intensity,Multiple cropping index(MCI),Land equivalent ratio (LER),Relative yields total (RYT),Crop equivalent yields (CEY),Relative Spread Index
8. CALCULATION OF LUE
Calculate LUE of the following crops grown
LUE of Field 1: 120 +120 /365 x 100 =65.75 %
LUE of Field 2: 120 +130 /365 x 100 =68.49 %
LUE of Field 3: 120 +100 + 65 /365 x 100 =78.10 %
Field Kharif Rabi Summer
1 Rice(120 d) Mustard(120 d) -
2 Rice(120 d) - Rice(130 d)
3 Rice(120 d) Potato(100 d) Moong(65 d)
20. ROTATIONAL INTENSITY
RI: No. of crops grown in a rotation / Duration of the rotation x 100
a) Rice-Wheat ( 1 year)
b) Rice- early potato-wheat-cowpea(1 year)
c) Maize-potato-sugarcane-ratoon-greengram(3 year)
d) Sesame-green gram-broccoli-blackgram-green gram-cauliflower(2 year)
RI for a : 2 / 1 x 100= 200 %
RI for b: 4 /1 x100 = 400 %
RI for c : 5 /3 x100 = 167 %
RI for d : 6 /2 x100 = 300 %
21. CROPPING INTENSITY
CI = Gross cropped area / Net cropped area x 100
Q1: Calculate the CI when Net cropped area of the farm is 10 ha and gross
cropped area is 15 ha.
CI= 15 /10 x100 =150%
Q2. Net cultivated area= 10 ha. Only kharif rice is grown in entire area and there
after land is kept fallow.
CI = 10 /10 x100 =100 %
NCA is 10 ha. Kharif rice-rapseed is the sequence followed.
CI = 20 / 10 x 100 =200 %
23. MULTIPLE CROPPING INDEX(MCI)
It was proposed by Dalrymple (1971).
It is the ratio of total area cropped in a year to the land area available for cultivation and
expressed in percentage (sum of area planted to different crops and harvested in a single
year divided by total cultivated area times 100.
Where, n is total number of crops, ai is area occupied by ith crop and A is total land area
available for cultivation. It is similar to cropping intensity
24. CALCULATION OF MCI
MCI for Block A = 10 / 5 x100 =200 %
MCI for Block B = 3 / 2 x100 =150 %
MCI for Block A = 10 / 5 x100 =200 %
MCI for whole farm = 23 / 12 x100 =191.6 %
Block NCA(ha) Kharif (ha) Rabi(ha) GCA(ha)
A 5 5(rice) 5 (toria) 10
B 2 2(okra) 1(green gram) 3
C 5 5 (G gram) 3 (baby corn)
2 (potato)
10
Total 12 23
25. LAND EQUIVALENT RATIO (LER)
LER can be defined as the relative land area under sole crop that would be required to produce the
equivalent yield under a mixed or an intercropping system at the same level of management.
Where, La and Lb are LER of crop a and crop b, respectively
Yab = yield of crop an in intercropping,
Yba = yield of crop b in intercropping,
Yaa = yield of crop an in pure stand and
Ybb = yield of crop b in pure stand.
LER of more than 1 indicates yield advantage, equal to 1 indicates no grain or no gain or no loss and
less than 1 indicates yield loss. It can be used both for replacement and additives series of
intercropping. LER gives a better picture of the competitive abilities of the component crops. It also
gives actual yield advantage of intercropping. In other words LER is the measure of production
efficiency of different system by convening the production in terms of land acreage.
26. CALCULATION OF LER
Let the yields of groundnut and Sesame grown, as pure crops are 1,200 and 1,000 kg/ha,
respectively. Let yields of these cops when grown, as intercrop be 1,000 and 600 kg/ha,
respectively. The land equivalent ratio of groundnut + Sesame intercropping system is
LER of 143 indicates that a 43 percent yields advantage is obtained when grown as
intercrop compared to growing as sole crops. In other words the sole crops have to be
grown in 1.43 ha to get the same yields level that is obtained from 1.00 ha of intercropping.
27. RELATIVE YIELDS TOTAL (RYT)
Oldest established measures of the yield advantage of crop mixture. The mixture yields of a
component crop expressed as a portion of its yields as a sole crop from the same replacement
series is the relative yield of crop and sum of the relative yields of component crop is called
Relative yields total (RYT). Or When LER is compared at uniform overall plant density of sole
and intercrops then it is known as RYT. In RYT yield advantages is to measure not only unit
area, but also on unit population. This is mainly used for replacement series.
Where, Yaa = yields of component a as sole crop Ybb = yields of component b is a sole crop
Yab = yields of component a as intercrop in b Yba = Yield of component b as intercrop in a.
Example: In pasture mixture, Stylo and anjan grown in 1:1 ratio with 50% sole crop population
of both crops. In I/C, mixture yield (50%) for Stylo and anjan is 6 and 4 tons/ha of fodder,
respectively. The yield of these crops in sole stand with 100% plant population is 10 and 8 ha of
green fodder, respectively.
28. RELATIVE CROWDING COEFFICIENT (K OR RCC)
It was proposed by de Wit (1960). It is used in replacement series of intercropping. It indicates whether a
species or crop when grown in mixed population has produced more or less yield than expected in pure
stand. In 50 : 50 mixture relative crowding coefficient can be defined as
29. CROP EQUIVALENT YIELDS (CEY)
Aggressivity
Sown proportion of species A and B are represented of ZA and ZB,
respectively. An aggressively value Zero indicates that the component
species are equally competitive. A positive sign indicates the dominant
species and a negative sign the dominated.
30. COMPETITION INDEX
It is a measure to find out the yield of various crops when grown together as well as separately. It
indicates the yield per plant of different crops in mixture and their respective pure stand on a unit
area basis.
If the yield of any crop grown together is less than its respective yield in pure stand then it is
harmful association but an increased yield means positive benefit. CI is proposed by Donald
(1963).
31. CULTIVATED LAND UTILISATION INDEX(CLUI)
CLUI = Total no of crops x area occupied by each crop x duration of the crop /
Total cultivated area x 365CL
CLUI for Block A: 5 x120 + 5 x120 / 5 x365 =0.66
CLUI for Block B: 5 x120 + 5 x130 / 5 x365 =0.68
CLUI for Block C: 4 x120 + 4 x110 /4 x365 =0.63
CLUI for Block D : 1 x120 + 1 x110 / 1 x365 =0.63
CLUI for Block E: 2 x 70 + 2 x120 + 2 x 85 /5 x365 =0.75
CLUI for Farm = 0.65
Field Area(ha) Kharif Rabi Summer
A 5 Rice(120 d) Mustard(120 d) -
B 5 Rice(120 d) Mustard(130 d) --
C 4 Rice(120 d) Wheat(110 d) -
D 1 Rice(120 d) Tomato(110 d) -
E 2 Baby corn)70 d) Potato(120d) Green gram(85 d)
32. RELATIVE SPREAD INDEX
It is the ratio of the area of the crop/cropping system in % to the total
cultivated area in the district to the area of crop/cropping system in % of
the total cultivated area in the state and expressed in %.
RSI = Area of the crop/cropping system in % to the total cultivated area in
the district / area of crop/cropping system in % of the total cultivated area
in the state x 100
Relative Yield Index:
RYI = Mean yield of the crop/system in a district / x 100
Mean yield of the crop/system in a State
33. ECONOMIC VIABILITY
1. Gross Returns: The total monetary returns of the economic produce such as
grain, tuber, bulb, fruit, etc. and byproducts viz. straw, fodder, fuel etc. obtained from the
crops included in the system are calculated based on the local market prices. The total
return is expressed in terms of unit area, usually one hectare. The main draw back in
this calculation is that market price of the produce is higher than that actually obtained
by the farmer. Generally gross return calculated is somewhat inflated compared to the
actual receipt obtained by the farmer.
2. Net returns or net profit: This is worked out by subtracting the total cost of
cultivation from the returns. This value gives the actual profit obtained by the farmer. In
this type of calculation only the variable costs are considered. Fixed costs such as rent
for the land, land revenue, interest on capital etc. are not included.
34. 3. RETURN PER RUPEE INVESTED:
This is also called benefit-cost-ratio or input- output ratio.
4. Per Day Return
This is called as income per day and can be obtained by dividing the net return by number
of cropping period (days).
This gives the efficiency of the cropping system in terms of monetary value. If the system is
stretched over one year, the denominator can be replaced by 365 days and per day for the
whole year can be calculated. No single index is capable of giving good comparison of
different cropping systems. So, a number of indices are used together to assess the
economic viability of the system.