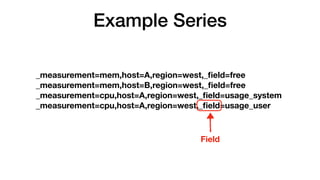
Downloaded 52 times


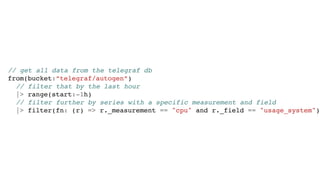

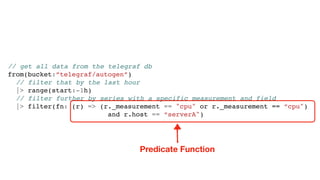
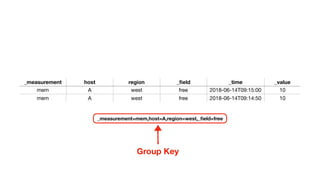
![// variables
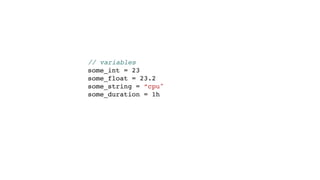
some_int = 23
some_float = 23.2
some_string = “cpu"
some_duration = 1h
some_time = 2018-10-10T19:00:00
some_array = [1, 6, 20, 22]](https://image.slidesharecdn.com/fluxandinfluxdb2-181107195124/85/Flux-and-InfluxDB-2-0-39-320.jpg)
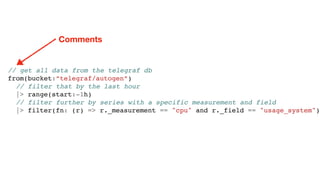
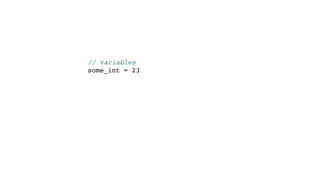
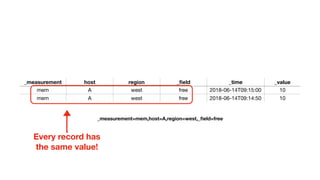
![// variables
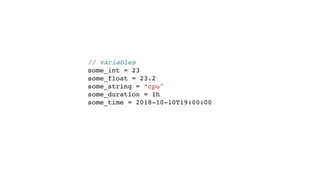
some_int = 23
some_float = 23.2
some_string = “cpu"
some_duration = 1h
some_time = 2018-10-10T19:00:00
some_array = [1, 6, 20, 22]
some_object = {foo: "hello" bar: 22}](https://image.slidesharecdn.com/fluxandinfluxdb2-181107195124/85/Flux-and-InfluxDB-2-0-40-320.jpg)

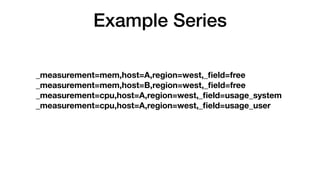
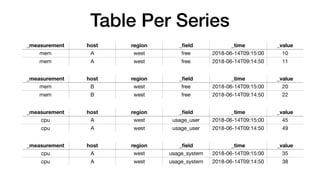
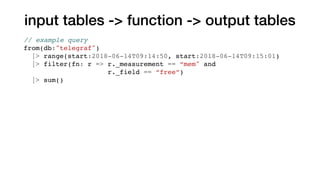
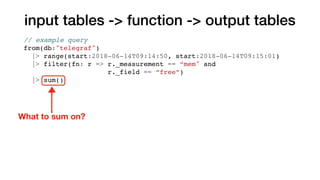
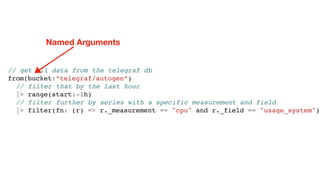
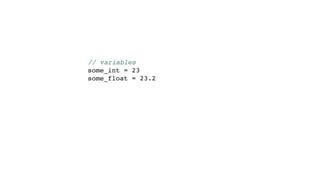
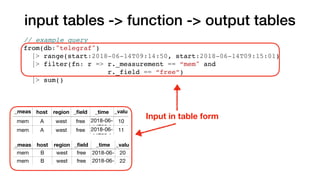
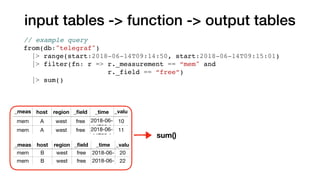
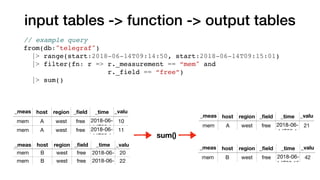
![input tables -> function -> output tables
Default columns argument
// example query
from(db:"telegraf")
|> range(start:2018-06-14T09:14:50, start:2018-06-14T09:15:01)
|> filter(fn: r => r._measurement == “mem" and
r._field == “free”)
|> sum(columns: [“_value”])](https://image.slidesharecdn.com/fluxandinfluxdb2-181107195124/85/Flux-and-InfluxDB-2-0-54-320.jpg)


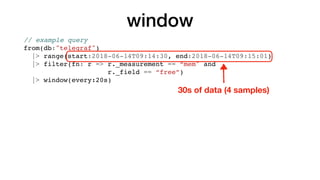

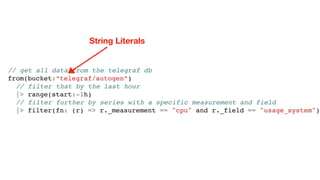
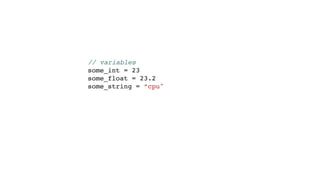
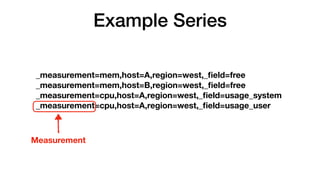
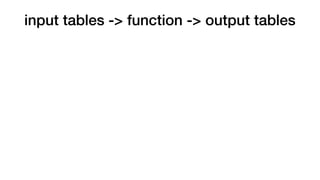
![group
// example query
from(db:"telegraf")
|> range(start:2018-06-14T09:14:30, end:2018-06-14T09:15:01)
|> filter(fn: r => r._measurement == “mem" and
r._field == “free”)
|> group(keys:[“region"])](https://image.slidesharecdn.com/fluxandinfluxdb2-181107195124/85/Flux-and-InfluxDB-2-0-67-320.jpg)
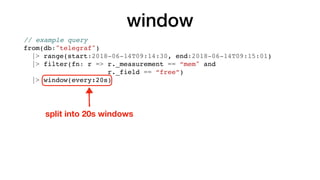
![group
// example query
from(db:"telegraf")
|> range(start:2018-06-14T09:14:30, end:2018-06-14T09:15:01)
|> filter(fn: r => r._measurement == “mem" and
r._field == “free”)
|> group(keys:[“region"])
new group key](https://image.slidesharecdn.com/fluxandinfluxdb2-181107195124/85/Flux-and-InfluxDB-2-0-68-320.jpg)
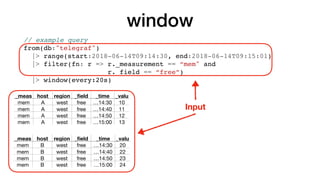
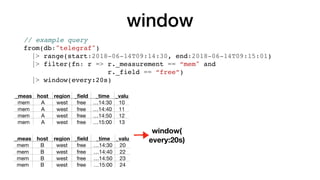
![group
_meas host region _field _time _valu
mem A west free …14:30 10
mem A west free …14:40 11
mem A west free …14:50 12
mem A west free …15:00 13
_meas host region _field _time _valu
mem B west free …14:30 20
mem B west free …14:40 22
mem B west free …14:50 23
mem B west free …15:00 24
// example query
from(db:"telegraf")
|> range(start:2018-06-14T09:14:30, end:2018-06-14T09:15:01)
|> filter(fn: r => r._measurement == “mem" and
r._field == “free”)
|> group(keys:[“region"])](https://image.slidesharecdn.com/fluxandinfluxdb2-181107195124/85/Flux-and-InfluxDB-2-0-69-320.jpg)
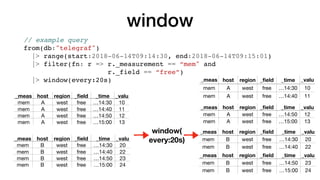
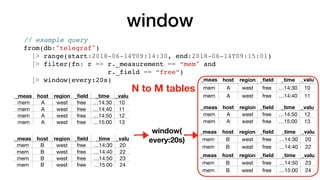
![group
_meas host region _field _time _valu
mem A west free …14:30 10
mem A west free …14:40 11
mem A west free …14:50 12
mem A west free …15:00 13
_meas host region _field _time _valu
mem B west free …14:30 20
mem B west free …14:40 22
mem B west free …14:50 23
mem B west free …15:00 24
group(
keys:
[“region”])
// example query
from(db:"telegraf")
|> range(start:2018-06-14T09:14:30, end:2018-06-14T09:15:01)
|> filter(fn: r => r._measurement == “mem" and
r._field == “free”)
|> group(keys:[“region"])
_meas
ureme
host region _field _time _valu
emem A west free …14:30 10
mem B west free …14:30 20
mem A west free …14:40 11
mem B west free …14:40 21
mem A west free …14:50 12
mem B west free …14:50 22
mem B west free …15:00 13
mem B west free …15:00 23
N to M tables
M == cardinality(group keys)](https://image.slidesharecdn.com/fluxandinfluxdb2-181107195124/85/Flux-and-InfluxDB-2-0-70-320.jpg)


![import "mysql"
customers = mysql.from(connect: loadSecret(name:”mysql_prod"),
query: "select id, name from customers")
data = from(bucket: "my_data")
|> range(start: -4h)
|> filter(fn: (r) => r._measurement == “write_requests")
|> rename(columns: {customer_id: “id"})
join(tables: {customers, data}, on: ["id"])
|> yield(name: "results")](https://image.slidesharecdn.com/fluxandinfluxdb2-181107195124/85/Flux-and-InfluxDB-2-0-92-320.jpg)
![import "mysql"
customers = mysql.from(connect: loadSecret(name:"mysql_prod"),
query: "select id, name from customers")
data = from(bucket: "my_data")
|> range(start: -4h)
|> filter(fn: (r) => r._measurement == “write_requests")
|> rename(columns: {customer_id: “id"})
join(tables: {customers, data}, on: ["id"])
|> yield(name: "results")
Imports for sharing code!](https://image.slidesharecdn.com/fluxandinfluxdb2-181107195124/85/Flux-and-InfluxDB-2-0-93-320.jpg)
![import "mysql"
customers = mysql.from(connect: loadSecret(name:"mysql_prod"),
query: "select id, name from customers")
data = from(bucket: "my_data")
|> range(start: -4h)
|> filter(fn: (r) => r._measurement == “write_requests")
|> rename(columns: {customer_id: “id"})
join(tables: {customers, data}, on: ["id"])
|> yield(name: "results")
Pulling data from a non-InfluxDB source](https://image.slidesharecdn.com/fluxandinfluxdb2-181107195124/85/Flux-and-InfluxDB-2-0-94-320.jpg)
![import "mysql"
customers = mysql.from(connect: loadSecret(name:"mysql_prod"),
query: "select id, name from customers")
data = from(bucket: "my_data")
|> range(start: -4h)
|> filter(fn: (r) => r._measurement == “write_requests")
|> rename(columns: {customer_id: “id"})
join(tables: {customers, data}, on: ["id"])
|> yield(name: "results")
Raw query (for now)](https://image.slidesharecdn.com/fluxandinfluxdb2-181107195124/85/Flux-and-InfluxDB-2-0-95-320.jpg)
![import "mysql"
customers = mysql.from(connect: loadSecret(name:"mysql_prod"),
query: "select id, name from customers")
data = from(bucket: "my_data")
|> range(start: -4h)
|> filter(fn: (r) => r._measurement == “write_requests")
|> rename(columns: {customer_id: “id"})
join(tables: {customers, data}, on: ["id"])
|> yield(name: "results")
Loading Secret](https://image.slidesharecdn.com/fluxandinfluxdb2-181107195124/85/Flux-and-InfluxDB-2-0-96-320.jpg)
![import "mysql"
customers = mysql.from(connect: loadSecret(name:"mysql_prod"),
query: "select id, name from customers")
data = from(bucket: "my_data")
|> range(start: -4h)
|> filter(fn: (r) => r._measurement == “write_requests")
|> rename(columns: {customer_id: “id"})
join(tables: {customers, data}, on: ["id"])
|> yield(name: "results")
Renaming & Shaping Data](https://image.slidesharecdn.com/fluxandinfluxdb2-181107195124/85/Flux-and-InfluxDB-2-0-97-320.jpg)
![import "mysql"
customers = mysql.from(connect: loadSecret(name:"mysql_prod"),
query: "select id, name from customers")
data = from(bucket: "my_data")
|> range(start: -4h)
|> filter(fn: (r) => r._measurement == “write_requests")
|> rename(columns: {customer_id: “id"})
join(tables: {customers, data}, on: ["id"])
|> yield(name: "results")
Join on any column](https://image.slidesharecdn.com/fluxandinfluxdb2-181107195124/85/Flux-and-InfluxDB-2-0-98-320.jpg)
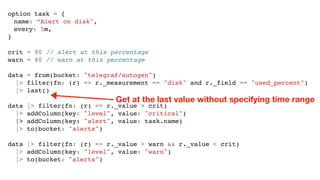

![option task = {name: "slack critical alerts", every: 1m}
import "slack"
lastNotificationTime = from(bucket: "notificatons")
|> filter(fn: (r) => r.level == "critical" and r._field == "alert_time")
|> group(none:true)
|> last()
|> recordValue(column:"_value")
from(bucket: "alerts")
|> range(start: lastNotificationTime)
|> filter(fn: (r) => r.level == "critical")
// shape the alert data to what we care about in notifications
|> renameColumn(from: "_time", to: "alert_time")
|> renameColumn(from: "_value", to: "used_percent")
// set the time the notification is being sent
|> addColumn(key: "_time", value: now())
// get rid of unneeded columns
|> drop(columns: ["_start", "_stop"])
// write the message
|> map(fn: (r) => r._value = "{r.host} disk usage is at {r.used_percent}%")
|> slack.to(config: loadSecret(name: “slack_alert_config”), message: “_value”)
|> to(bucket: “notifications")](https://image.slidesharecdn.com/fluxandinfluxdb2-181107195124/85/Flux-and-InfluxDB-2-0-107-320.jpg)
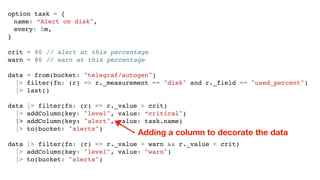
![option task = {name: "slack critical alerts", every: 1m}
import "slack"
lastNotificationTime = from(bucket: "notificatons")
|> filter(fn: (r) => r.level == "critical" and r._field == "alert_time")
|> group(none:true)
|> last()
|> recordValue(column:"_value")
from(bucket: "alerts")
|> range(start: lastNotificationTime)
|> filter(fn: (r) => r.level == “critical”)
// shape the alert data to what we care about in notifications
|> renameColumn(from: "_time", to: "alert_time")
|> renameColumn(from: "_value", to: "used_percent")
// set the time the notification is being sent
|> addColumn(key: "_time", value: now())
// get rid of unneeded columns
|> drop(columns: ["_start", "_stop"])
// write the message
|> map(fn: (r) => r._value = "{r.host} disk usage is at {r.used_percent}%")
|> slack.to(config: loadSecret(name: "slack_alert"))
|> to(bucket: “notifications")
We have state so we don’t resend](https://image.slidesharecdn.com/fluxandinfluxdb2-181107195124/85/Flux-and-InfluxDB-2-0-108-320.jpg)
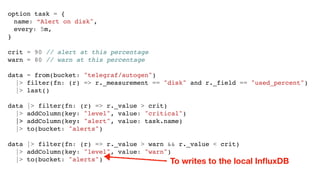
![option task = {name: "slack critical alerts", every: 1m}
import "slack"
lastNotificationTime = from(bucket: "notificatons")
|> filter(fn: (r) => r.level == "critical" and r._field == "alert_time")
|> group(none:true)
|> last()
|> recordValue(column:"_value")
from(bucket: "alerts")
|> range(start: lastNotificationTime)
|> filter(fn: (r) => r.level == "critical")
// shape the alert data to what we care about in notifications
|> renameColumn(from: "_time", to: "alert_time")
|> renameColumn(from: "_value", to: "used_percent")
// set the time the notification is being sent
|> addColumn(key: "_time", value: now())
// get rid of unneeded columns
|> drop(columns: ["_start", "_stop"])
// write the message
|> map(fn: (r) => r._value = "{r.host} disk usage is at {r.used_percent}%")
|> slack.to(config: loadSecret(name: "slack_alert"))
|> to(bucket: “notifications")
Use last time as argument to range](https://image.slidesharecdn.com/fluxandinfluxdb2-181107195124/85/Flux-and-InfluxDB-2-0-109-320.jpg)
![option task = {name: "slack critical alerts", every: 1m}
import "slack"
lastNotificationTime = from(bucket: "notificatons")
|> filter(fn: (r) => r.level == "critical" and r._field == "alert_time")
|> group(none:true)
|> last()
|> recordValue(column:"_value")
from(bucket: "alerts")
|> range(start: lastNotificationTime)
|> filter(fn: (r) => r.level == "critical")
// shape the alert data to what we care about in notifications
|> renameColumn(from: "_time", to: "alert_time")
|> renameColumn(from: "_value", to: "used_percent")
// set the time the notification is being sent
|> addColumn(key: "_time", value: now())
// get rid of unneeded columns
|> drop(columns: ["_start", "_stop"])
// write the message
|> map(fn: (r) => r._value = "{r.host} disk usage is at {r.used_percent}%")
|> slack.to(config: loadSecret(name: "slack_alert"))
|> to(bucket: “notifications")
Now function for current time](https://image.slidesharecdn.com/fluxandinfluxdb2-181107195124/85/Flux-and-InfluxDB-2-0-110-320.jpg)
![option task = {name: "slack critical alerts", every: 1m}
import "slack"
lastNotificationTime = from(bucket: "notificatons")
|> filter(fn: (r) => r.level == "critical" and r._field == "alert_time")
|> group(none:true)
|> last()
|> recordValue(column:"_value")
from(bucket: "alerts")
|> range(start: lastNotificationTime)
|> filter(fn: (r) => r.level == "critical")
// shape the alert data to what we care about in notifications
|> renameColumn(from: "_time", to: "alert_time")
|> renameColumn(from: "_value", to: "used_percent")
// set the time the notification is being sent
|> addColumn(key: "_time", value: now())
// get rid of unneeded columns
|> drop(columns: ["_start", "_stop"])
// write the message
|> map(fn: (r) => r._value = "{r.host} disk usage is at {r.used_percent}%")
|> slack.to(config: loadSecret(name: "slack_alert"))
|> to(bucket: “notifications")
Map function to iterate
over values](https://image.slidesharecdn.com/fluxandinfluxdb2-181107195124/85/Flux-and-InfluxDB-2-0-111-320.jpg)
![option task = {name: "slack critical alerts", every: 1m}
import "slack"
lastNotificationTime = from(bucket: "notificatons")
|> filter(fn: (r) => r.level == "critical" and r._field == "alert_time")
|> group(none:true)
|> last()
|> recordValue(column:"_value")
from(bucket: "alerts")
|> range(start: lastNotificationTime)
|> filter(fn: (r) => r.level == "critical")
// shape the alert data to what we care about in notifications
|> renameColumn(from: "_time", to: "alert_time")
|> renameColumn(from: "_value", to: "used_percent")
// set the time the notification is being sent
|> addColumn(key: "_time", value: now())
// get rid of unneeded columns
|> drop(columns: ["_start", "_stop"])
// write the message
|> map(fn: (r) => r._value = "{r.host} disk usage is at {r.used_percent}%")
|> slack.to(config: loadSecret(name: "slack_alert"))
|> to(bucket: “notifications")
String interpolation](https://image.slidesharecdn.com/fluxandinfluxdb2-181107195124/85/Flux-and-InfluxDB-2-0-112-320.jpg)
![option task = {name: "slack critical alerts", every: 1m}
import "slack"
lastNotificationTime = from(bucket: "notificatons")
|> filter(fn: (r) => r.level == "critical" and r._field == "alert_time")
|> group(none:true)
|> last()
|> recordValue(column:"_value")
from(bucket: "alerts")
|> range(start: lastNotificationTime)
|> filter(fn: (r) => r.level == "critical")
// shape the alert data to what we care about in notifications
|> renameColumn(from: "_time", to: "alert_time")
|> renameColumn(from: "_value", to: "used_percent")
// set the time the notification is being sent
|> addColumn(key: "_time", value: now())
// get rid of unneeded columns
|> drop(columns: ["_start", "_stop"])
// write the message
|> map(fn: (r) => r._value = "{r.host} disk usage is at {r.used_percent}%")
|> slack.to(config: loadSecret(name: "slack_alert"))
|> to(bucket: “notifications")
Send to Slack and
record in InfluxDB](https://image.slidesharecdn.com/fluxandinfluxdb2-181107195124/85/Flux-and-InfluxDB-2-0-113-320.jpg)
![option task = {
name: "email alert digest",
cron: "0 5 * * 0"
}
import "smtp"
body = ""
from(bucket: "alerts")
|> range(start: -24h)
|> filter(fn: (r) => (r.level == "warn" or r.level == "critical") and r._field == "message")
|> group(by: ["alert"])
|> count()
|> group(none: true)
|> map(fn: (r) => body = body + "Alert {r.alert} triggered {r._value} timesn")
smtp.to(
config: loadSecret(name: "smtp_digest"),
to: "alerts@influxdata.com",
title: "Alert digest for {now()}",
body: message)](https://image.slidesharecdn.com/fluxandinfluxdb2-181107195124/85/Flux-and-InfluxDB-2-0-114-320.jpg)
![option task = {
name: "email alert digest",
cron: "0 5 * * 0"
}
import "smtp"
body = ""
from(bucket: "alerts")
|> range(start: -24h)
|> filter(fn: (r) => (r.level == "warn" or r.level == "critical") and r._field == "message")
|> group(by: ["alert"])
|> count()
|> group(none: true)
|> map(fn: (r) => body = body + "Alert {r.alert} triggered {r._value} timesn")
smtp.to(
config: loadSecret(name: "smtp_digest"),
to: "alerts@influxdata.com",
title: "Alert digest for {now()}",
body: message)
Cron syntax](https://image.slidesharecdn.com/fluxandinfluxdb2-181107195124/85/Flux-and-InfluxDB-2-0-115-320.jpg)
![option task = {
name: "email alert digest",
cron: "0 5 * * 0"
}
import "smtp"
body = ""
from(bucket: "alerts")
|> range(start: -24h)
|> filter(fn: (r) => (r.level == "warn" or r.level == "critical") and r._field == "message")
|> group(by: ["alert"])
|> count()
|> group(none: true)
|> map(fn: (r) => body = body + "Alert {r.alert} triggered {r._value} timesn")
smtp.to(
config: loadSecret(name: "smtp_digest"),
to: "alerts@influxdata.com",
title: "Alert digest for {now()}",
body: message)
Closures](https://image.slidesharecdn.com/fluxandinfluxdb2-181107195124/85/Flux-and-InfluxDB-2-0-116-320.jpg)


InfluxDB 2.0 introduces a unified platform integrating Telegraf, Chronograf, and Kapacitor, with a focus on a clean migration path and compatibility. The new Flux scripting language enables functional data queries and manipulation, allowing users to filter, transform, and visualize time series data effectively. The document provides numerous examples of Flux queries highlighting various functionality, including data filtering and windowing for analytics.


![Paul Dix [InfluxData] The Journey of InfluxDB | InfluxDays 2022](https://cdn.slidesharecdn.com/ss_thumbnails/2022-11-02influxdays-journeyofinfluxdb-221020214252-ff7c76c5-thumbnail.jpg?width=640&height=640&fit=bounds)


![Ward Bowman [PTC] | ThingWorx Long-Term Data Storage with InfluxDB | InfluxDa...](https://cdn.slidesharecdn.com/ss_thumbnails/influxdays-221027185325-5d2f430b-thumbnail.jpg?width=640&height=640&fit=bounds)
![Scott Anderson [InfluxData] | New & Upcoming Flux Features | InfluxDays 2022](https://cdn.slidesharecdn.com/ss_thumbnails/influxdays2022-fluxupdates-scott-221021210238-9d323cba-thumbnail.jpg?width=640&height=640&fit=bounds)
![Steinkamp, Clifford [InfluxData] | Closing Thoughts | InfluxDays 2022](https://cdn.slidesharecdn.com/ss_thumbnails/influxdays2022closingthoughtsday2-221020220104-abde55ea-thumbnail.jpg?width=640&height=640&fit=bounds)
![Steinkamp, Clifford [InfluxData] | Welcome to InfluxDays 2022 - Day 2 | Influ...](https://cdn.slidesharecdn.com/ss_thumbnails/influxdays2022welcometoday2-221020215815-c8463942-thumbnail.jpg?width=640&height=640&fit=bounds)
![Steinkamp, Clifford [InfluxData] | Closing Thoughts Day 1 | InfluxDays 2022](https://cdn.slidesharecdn.com/ss_thumbnails/influxdays2022closingthoughtsday1-221020215301-f8040e1f-thumbnail.jpg?width=640&height=640&fit=bounds)


