Download as PDF, PPTX

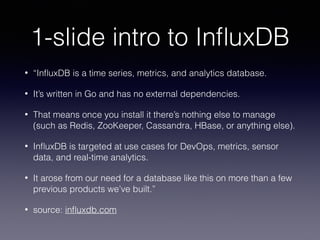


![• data written using line protocol
• [key] [point] [timestamp]
• key = <measurement>,<tag set>
• temperature,machine=unit42,type=assembly
• point = <field set>
• internal=32,external=100
• timestamp
• 1434055562000000035
• there can only be one point for a series and timestamp
• you define precision of point (s, ms, μs, ns)
• you define how long data is kept : retention policy (replication, duration)](https://image.slidesharecdn.com/20150909influxdb-150909002334-lva1-app6891/85/InfluxDB-Grafana-8-320.jpg)


InfluxDB is an open source time series database written in Go that stores metric data and performs real-time analytics. It has no external dependencies. InfluxDB stores data as time series with measurements, tags, and fields. Data is written using a line protocol and can be visualized using Grafana, an open source metrics dashboard.


![Paul Dix [InfluxData] The Journey of InfluxDB | InfluxDays 2022](https://cdn.slidesharecdn.com/ss_thumbnails/2022-11-02influxdays-journeyofinfluxdb-221020214252-ff7c76c5-thumbnail.jpg?width=640&height=640&fit=bounds)


![Tim Hall [InfluxData] | InfluxDB Roadmap | InfluxDays Virtual Experience Lond...](https://cdn.slidesharecdn.com/ss_thumbnails/influxdb-roadmap-tim-hall-200623173849-thumbnail.jpg?width=640&height=640&fit=bounds)
![Paul Dix [InfluxData] | InfluxDays Keynote: Future of InfluxDB | InfluxDays N...](https://cdn.slidesharecdn.com/ss_thumbnails/2021-10-26whytimeseries-influxdaysna-211026005527-thumbnail.jpg?width=640&height=640&fit=bounds)

![5G Explained! A High Level Overview [Introduction]](https://cdn.slidesharecdn.com/ss_thumbnails/5gexplainedahighleveloverview-260119165306-cc137a3e-thumbnail.jpg?width=640&height=640&fit=bounds)


