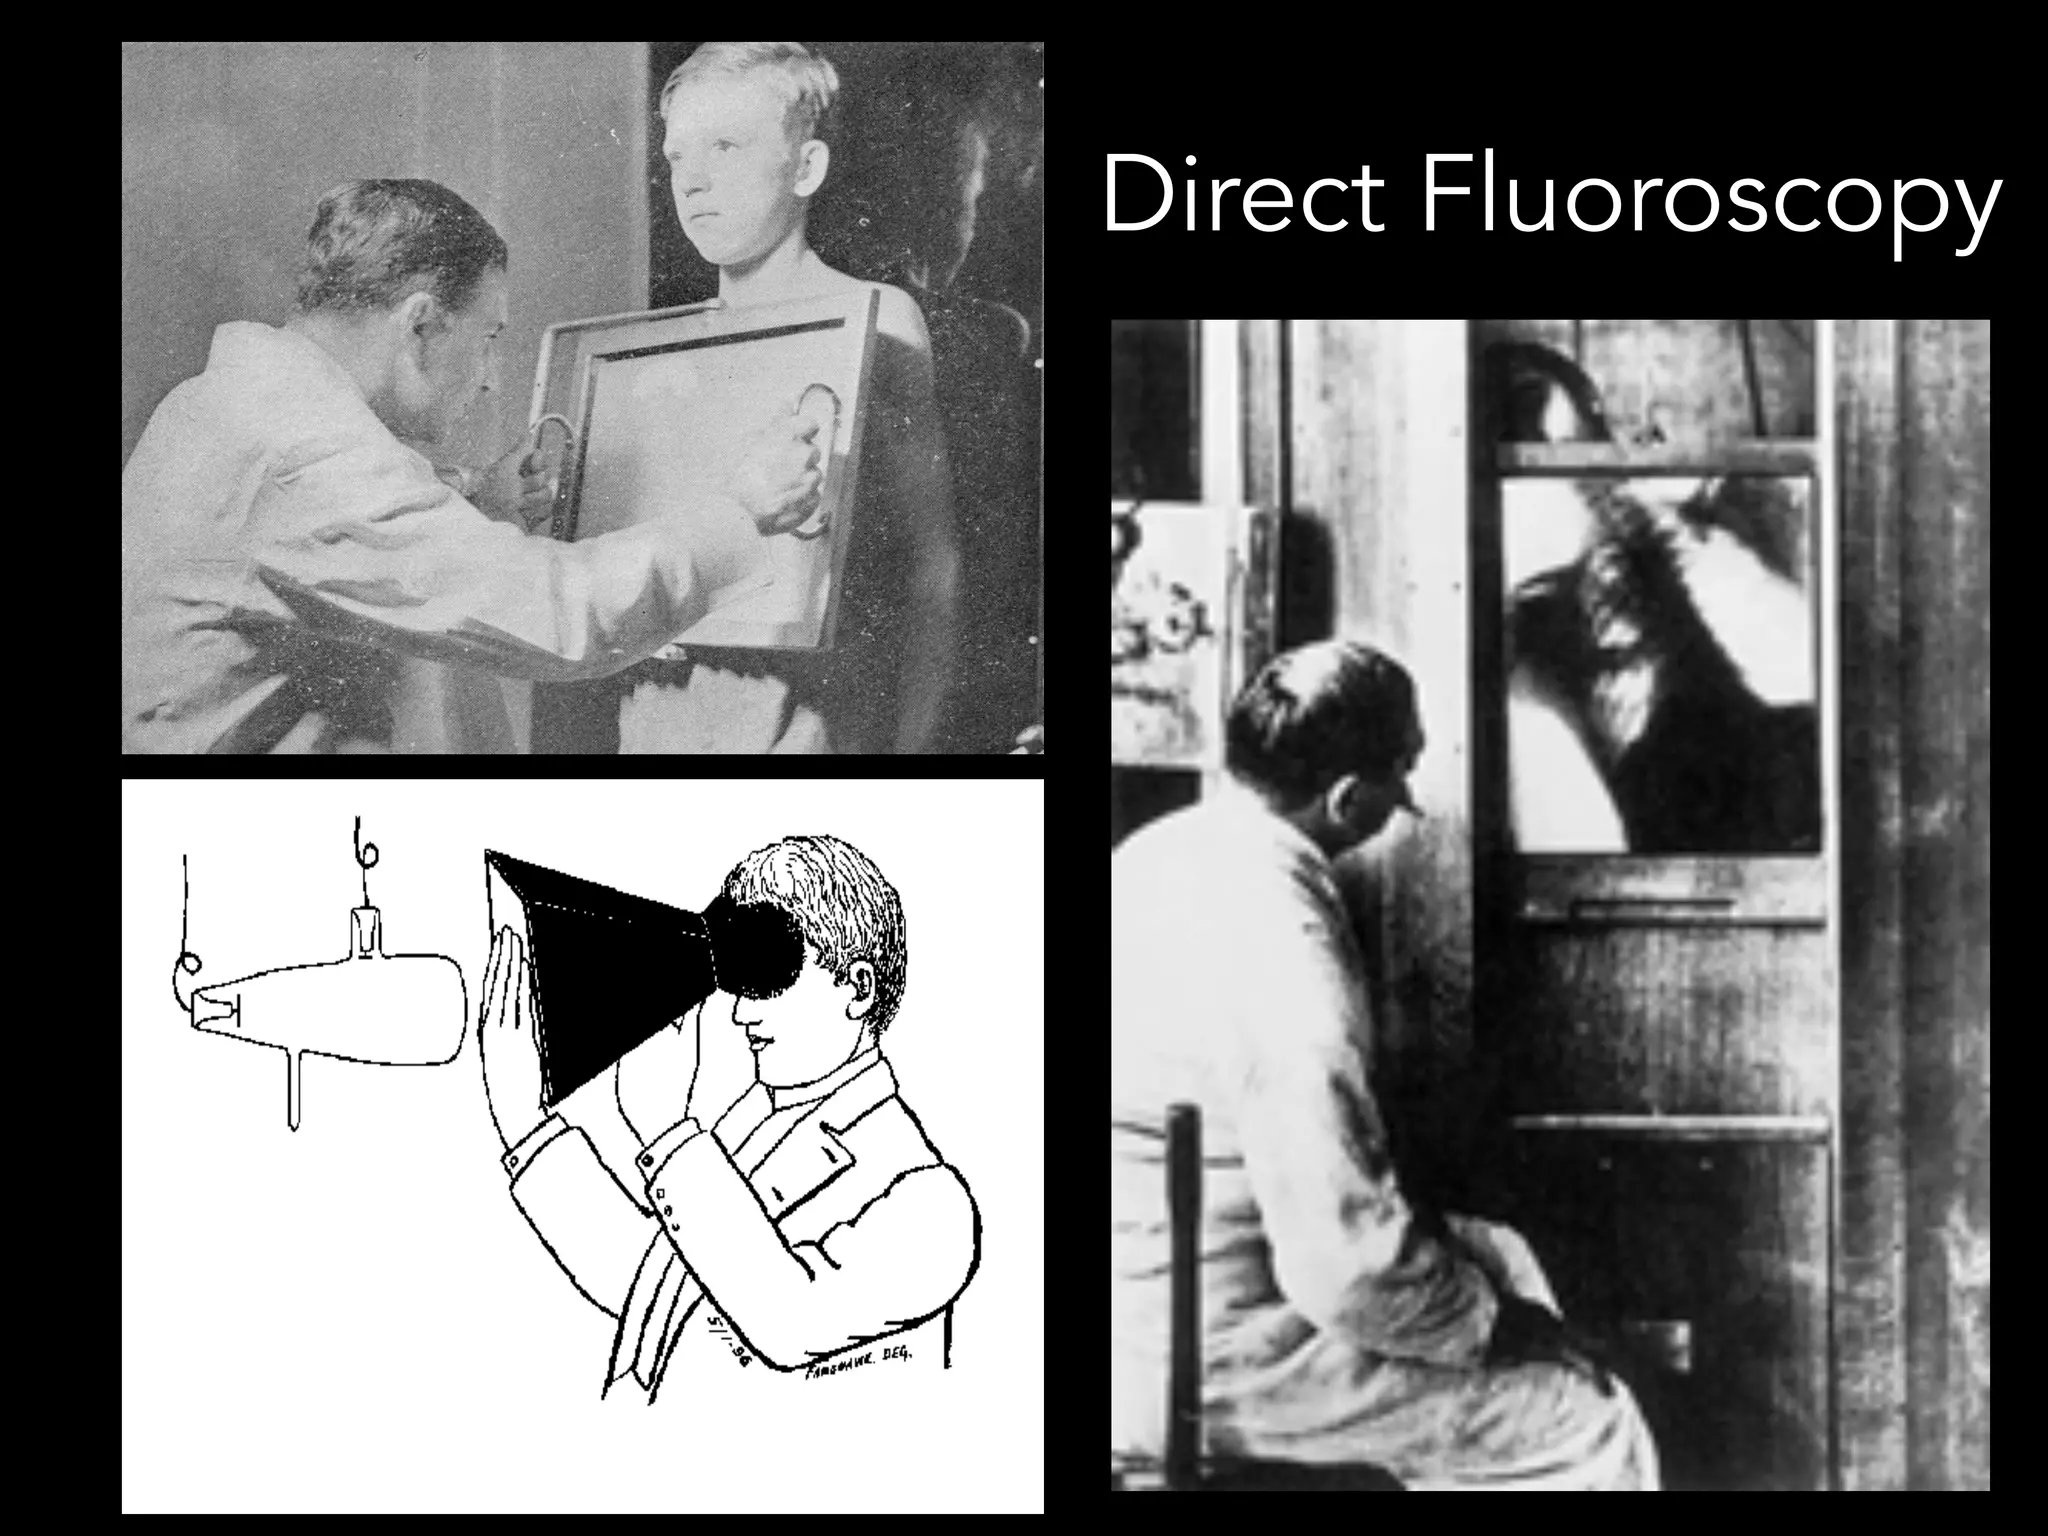
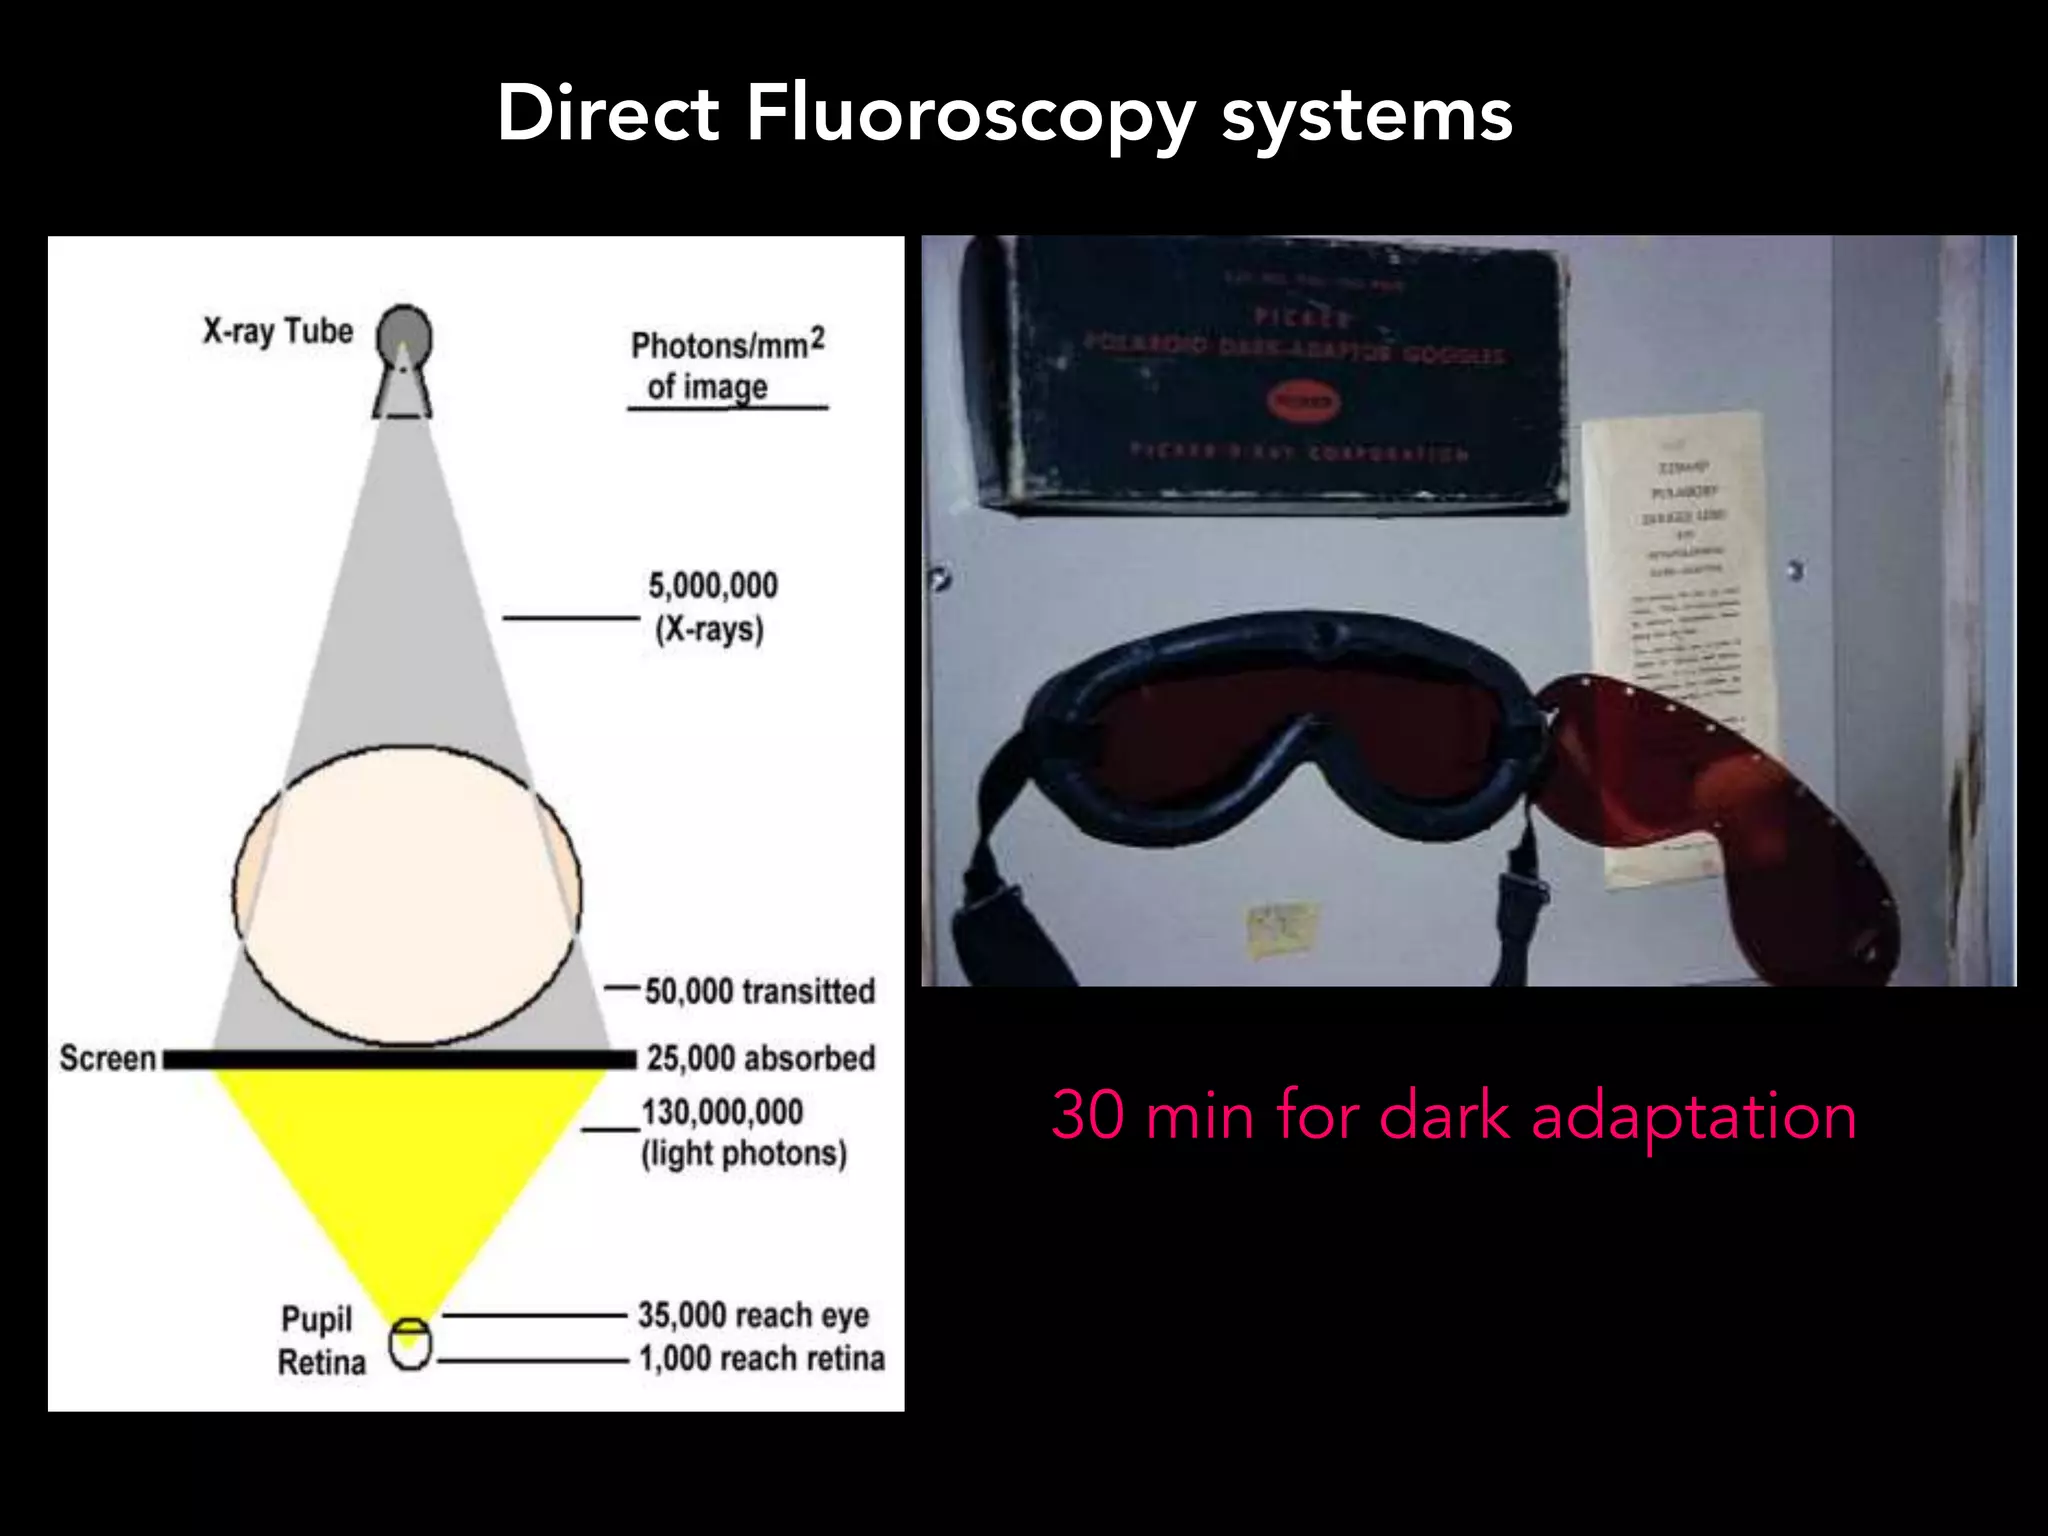
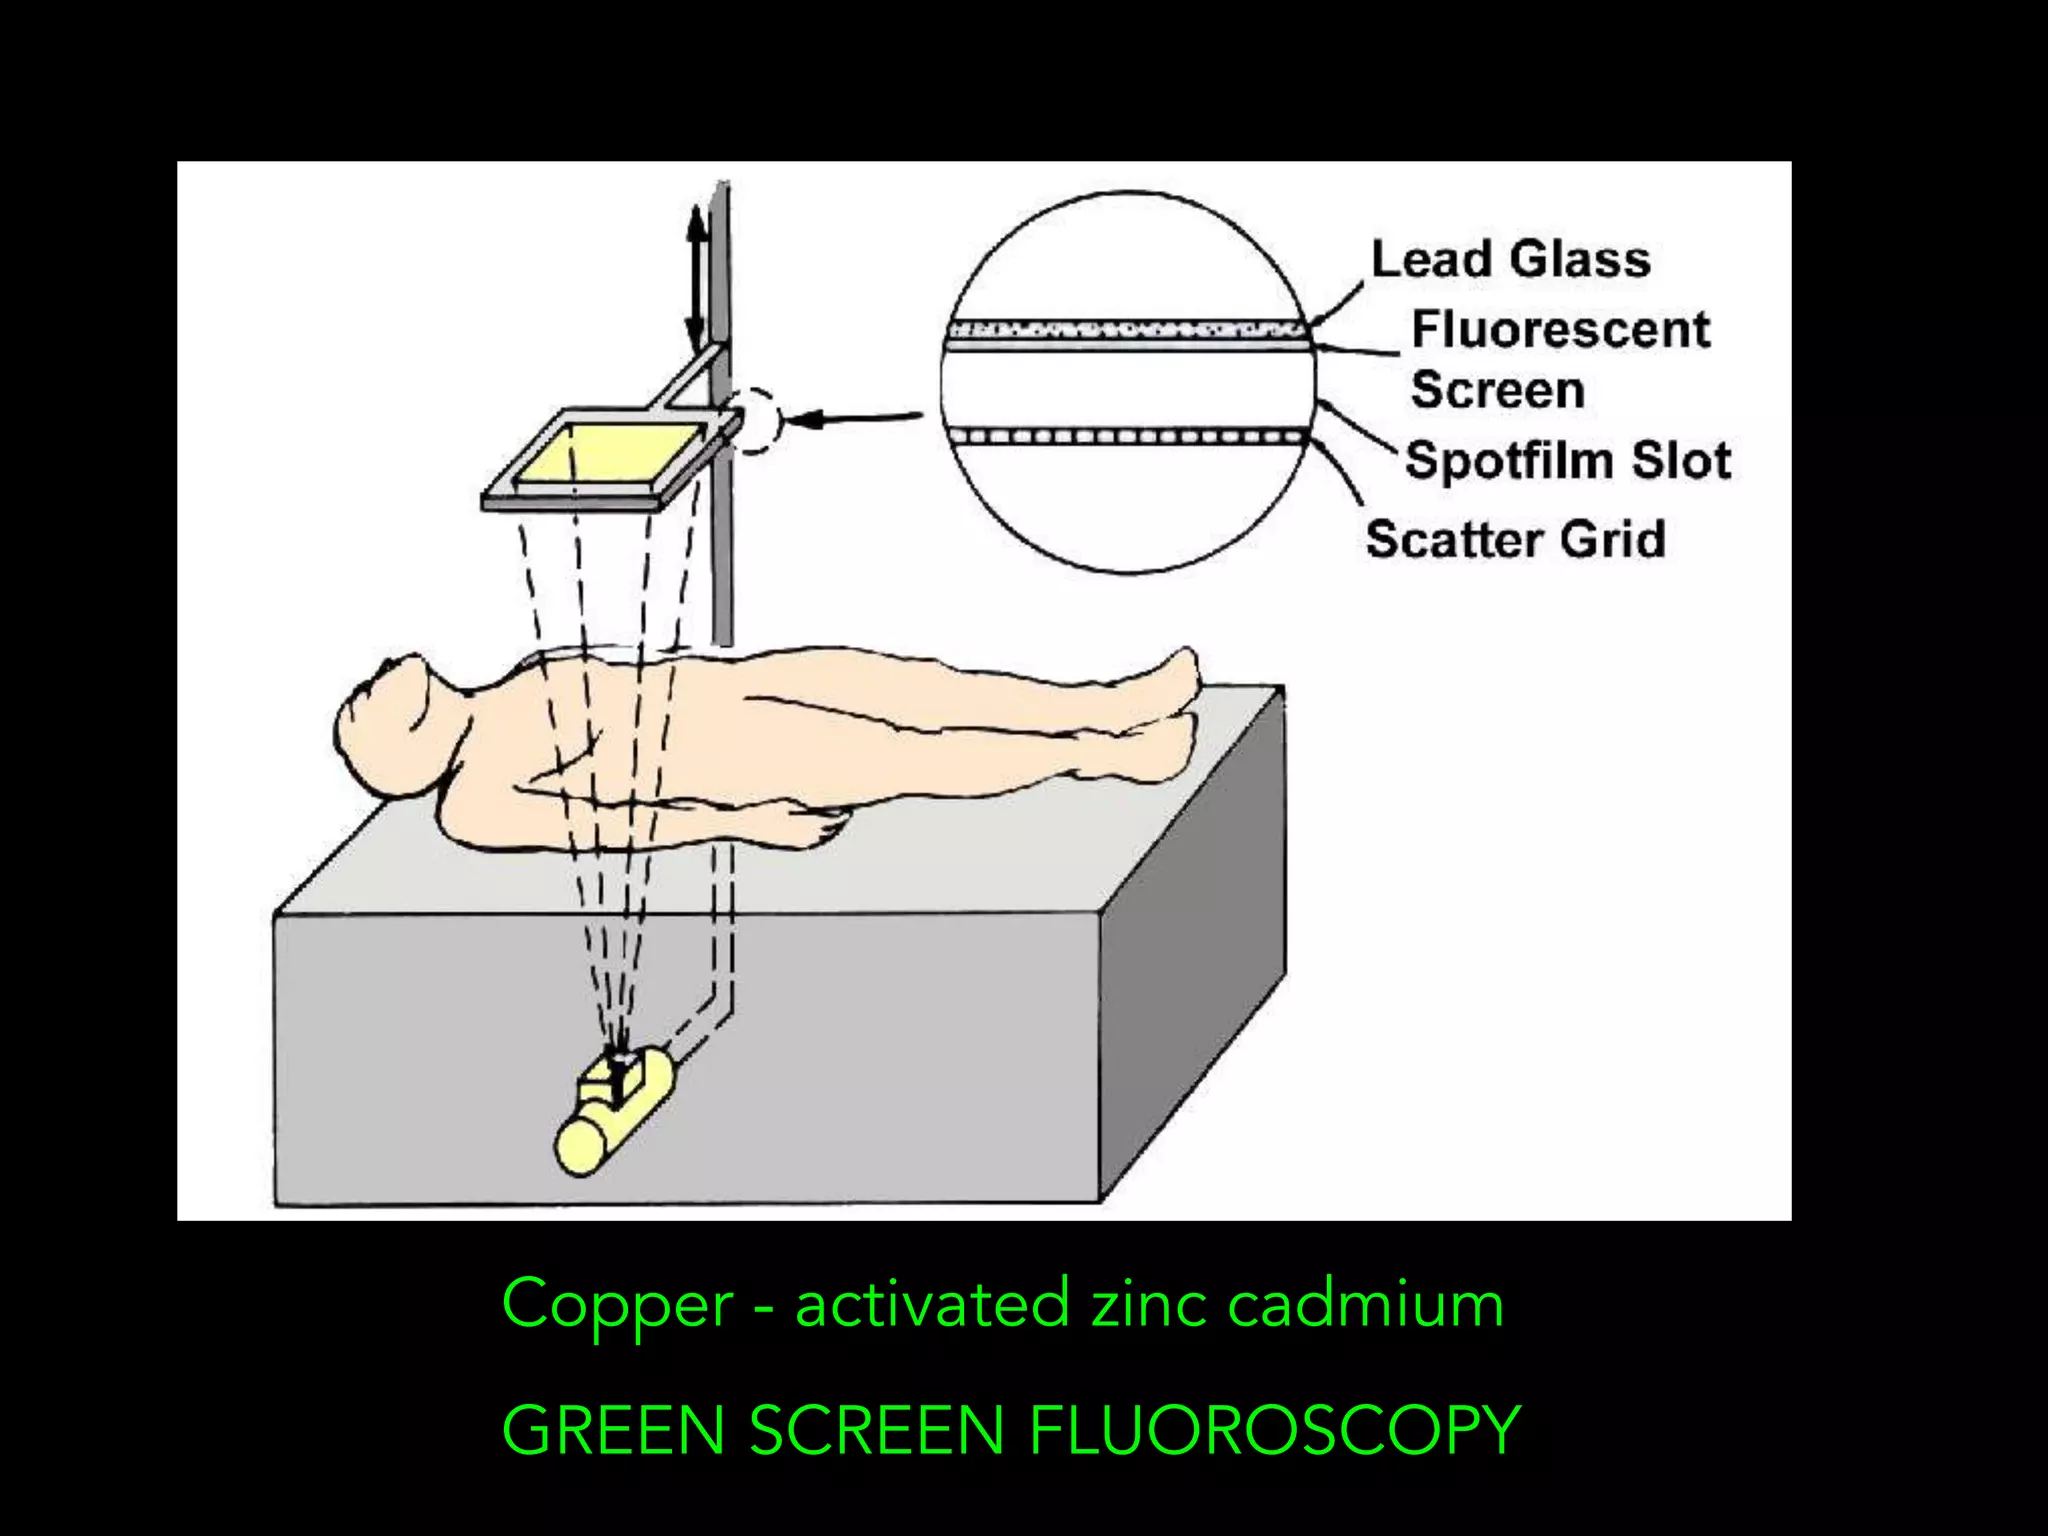
Fluoroscopy is a form of real-time radiographic imaging used to guide procedures. It was invented in 1896 by Thomas Edison. Modern fluoroscopy uses image intensifiers or flat panel detectors to convert x-rays into visible light images. Digital systems have replaced conventional film-based fluoroscopy. Fluoroscopy provides real-time imaging but also exposes patients and staff to radiation, so dose reduction techniques must be used such as automatic brightness control, collimating to the area of interest, and minimizing unnecessary images and magnification.


![!17
• Conversion Factor (= “gain”) [Cd s / mR m2]
= light out (Cd/m2) /X-rays in (mR/sec)
• Typically 100-200
• Brightness gain/ Intensification factor
– Electronic gain (~50x) x Minification gain
(Minification gain = input:output area ~(input FOV)2 in inches)
• Flux gain (Electronic gain)-Number of light photons
striking the output screen : Number of x- ray photons
striking the input screen.
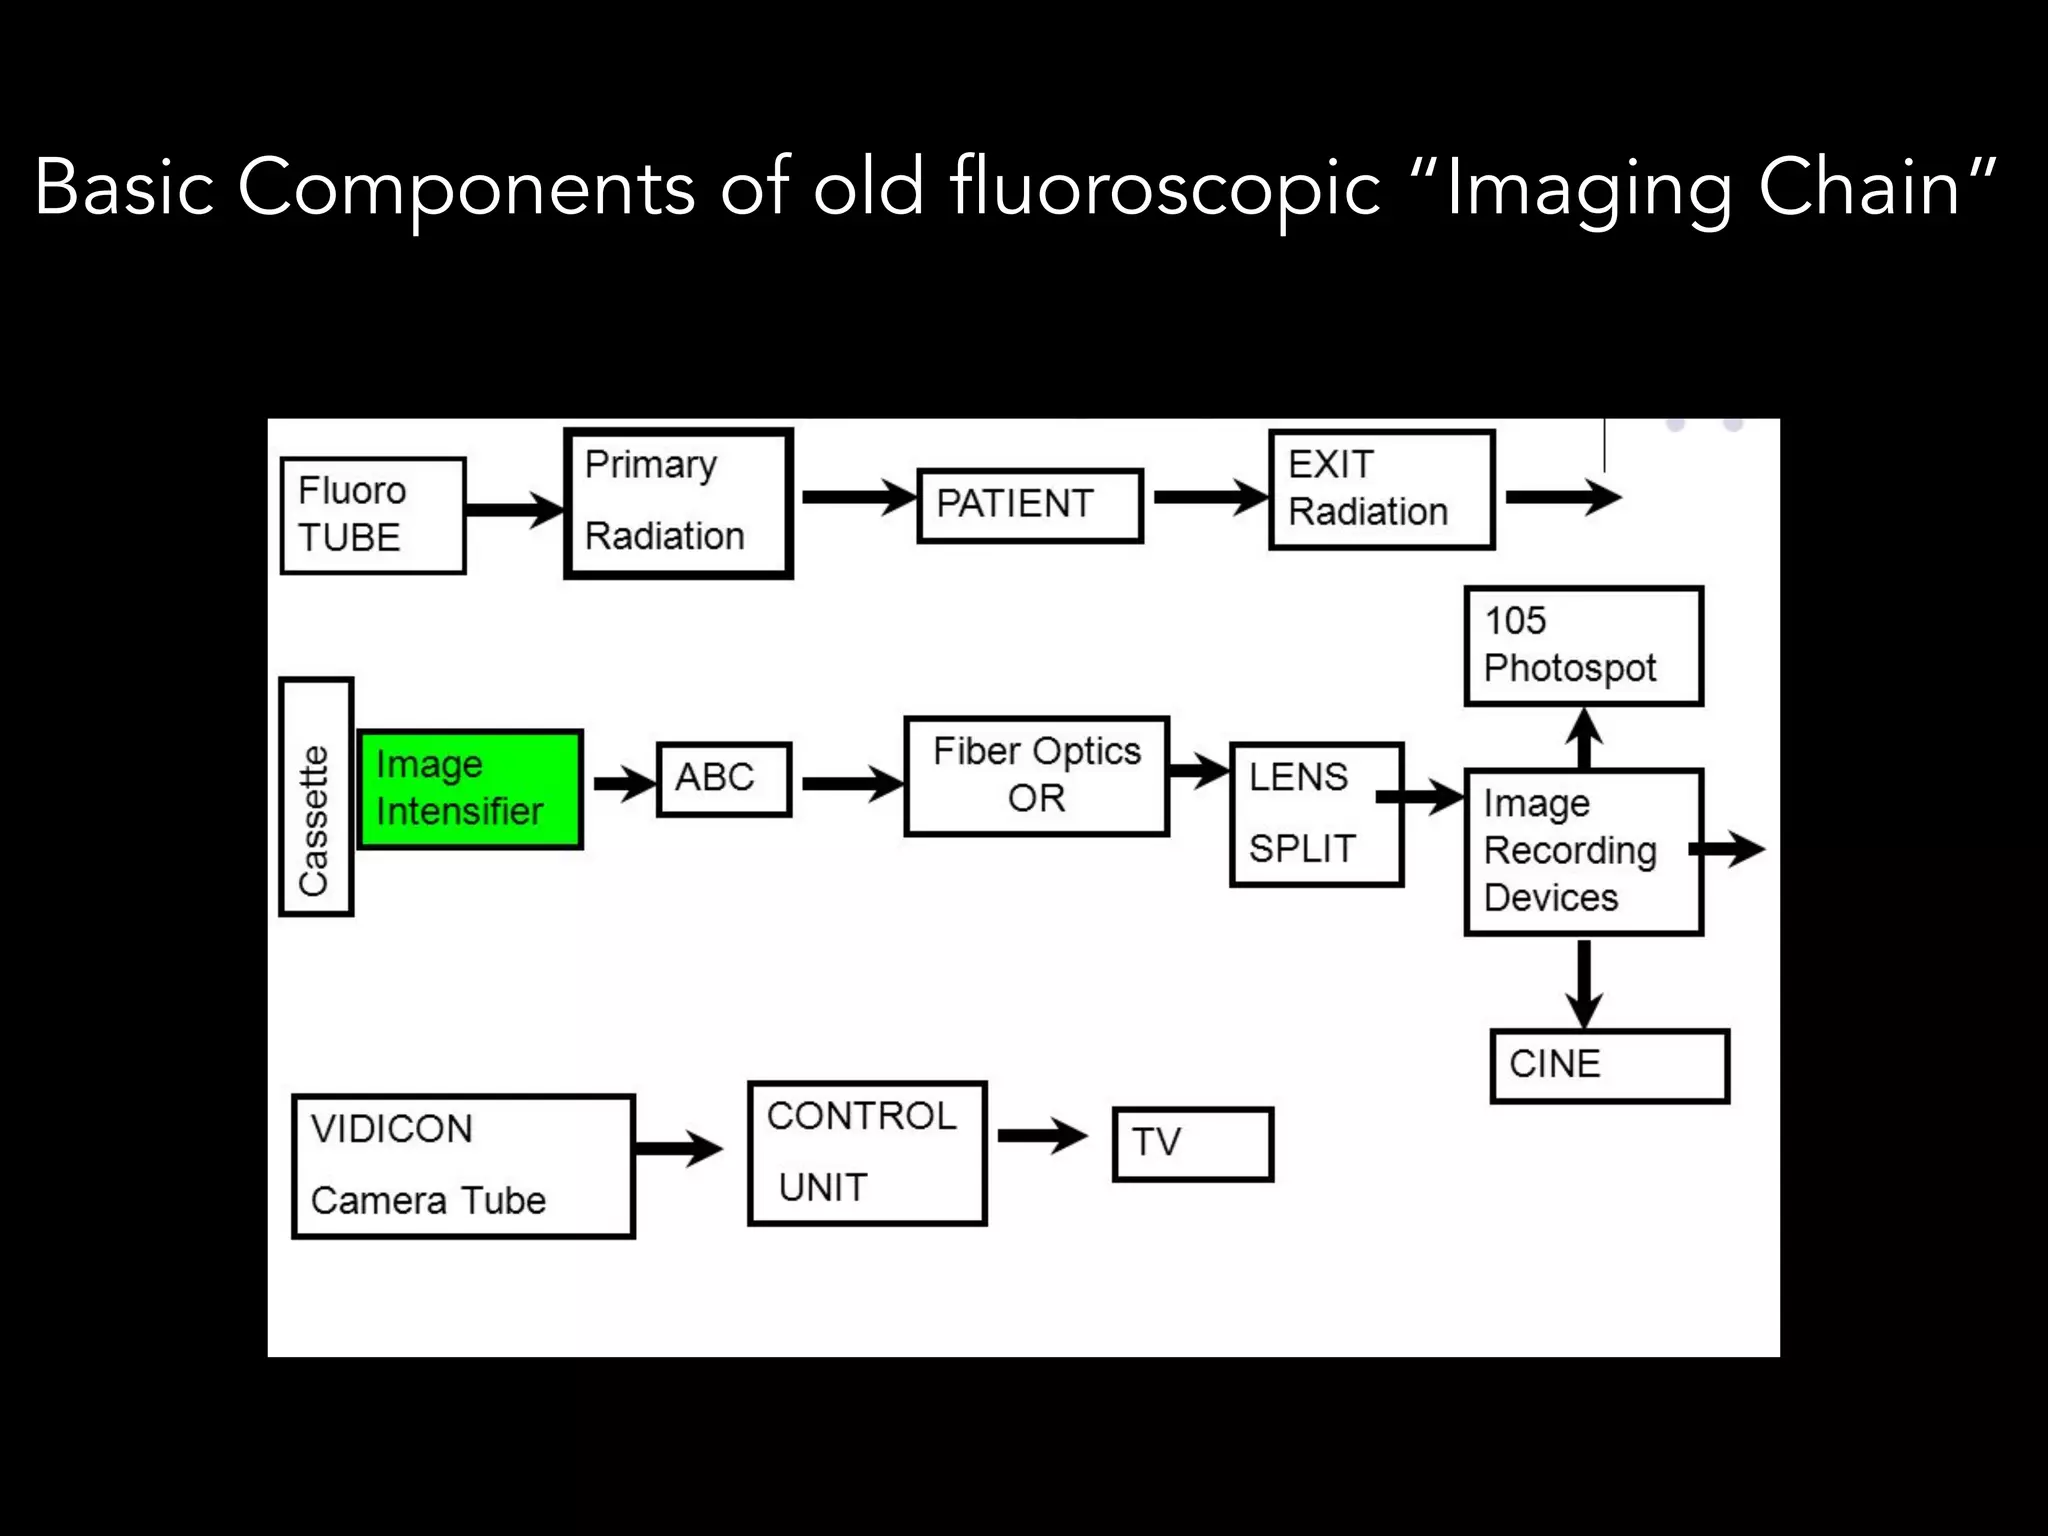
IMAGE INTENSIFIER PERFORMANCE](https://image.slidesharecdn.com/fluorogspdf-181031210822/75/Fluoroscopy-for-Residents-in-Radiology-17-2048.jpg)


![Portable and mobile radiographic equipments [Autosaved].pptx](https://cdn.slidesharecdn.com/ss_thumbnails/portableandmobileradiographicequipmentsautosaved-230729155829-aadaaabd-thumbnail.jpg?width=640&height=640&fit=bounds)


