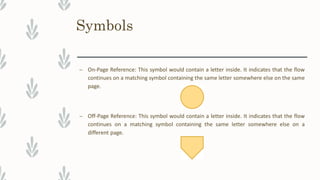
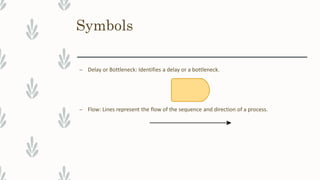
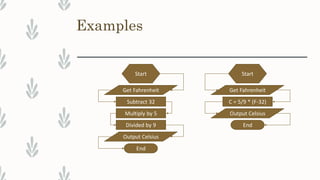
Flowcharts provide a graphical representation of steps in a process or algorithm using standard symbols. They were developed in the 1920s-1930s to document business processes but are now widely used to depict computer programs and workflows. The key symbols include boxes, diamonds, arrows, and other shapes to represent tasks, decisions, data, and flow. Flowcharts clarify complex processes, help teams understand them, and can be used to improve or design new procedures.
a diagram of the sequence of movements or actions of people or things involved in a complex system or activity.
a graphical representation of a computer program in relation to its sequence of functions (as distinct from the data it processes).
a diagram of the sequence of movements or actions of people or things involved in a complex system or activity.
a graphical representation of a computer program in relation to its sequence of functions (as distinct from the data it processes).
Check out this guide for flowchart symbols meaning explained. If you need to know which flowchart symbols to use, all standard shapes and their definitions are explained on this page.
Types of charts in Excel and How to use themVijay Perepa
There are different Chart types and some times we face difficulty to find which chart is suitable for a specific Data set. In this series of Videos, we have discussed about each chart type and when to use etc.
this ppt is about charts in ms excel.there are many types of chart used in ms excel but in this ppt some common types are defined,as line chart,bar,column,area ,scatter chart etc...
To understand algorithm and flowchart, it is better to refer this Slideshare that I have created. I have thoroughly presented the key points that make easy in remembering what algorithm and flowchart is. The slide is really simple and wonderful to use it for a quick reference.
It includes various types of programming errors: Syntax, Semantic, Logical, Runtime Error with the help of C++ programs. Also, discussed how to fix these errors.
For better understanding, subscribe following YouTube channel:
https://youtu.be/PIOCmaYdSCg
ppt on flow chart by harshid panchal with help of Sejal ma'm (git.org.in)harshid panchal
this is the simple power point presentation on flowchart
made by me harshid panchal with the help of my fav. ma'm sejal bhavsar . and we are from gandhinagar institute of technology(git.org.in)
if u have any query then contact me on harshidpanchalhp@gmail.com or you can also contact my ma'm on sejal.bhavsar@git.org.in
This presentation gives simple but effective techniques for mapping a business process. Process Mapping is a strong initial step in continuous improvement of any business process.
I have attached here PPT of Flow Chart. By using the PPT, students will design any Flow Chart which is a diagrammatic representation of an algorithm, a step-by-step approach to solving a task. . The PPT is mainly focus on "how to design Flow Chart".
An operating system (OS) is a software program that manages the resources of a computer system and provides a platform for running applications. Its primary functions include resource management, process management, memory management, file system management, and user interface. There are many different types of operating systems, such as desktop operating systems like Windows and macOS, server operating systems like Linux and Windows Server, and embedded operating systems like those used in mobile phones and other small devices. The choice of operating system depends on the type of device, the intended use, and other factors.
What is a Database?
Database creation steps
Benefits of using Database
Types of Table Relationships
What is a Database model
Database Management System
Users of Database
MS Access
Program, Language, & Programming Language
Object Oriented Programming vs Procedure Oriented Programming
About C
Why still Learn C?
Basic Terms
C Stuff
C Syntax
C Program
Algorithm
What is an algorithm?
How are mathematical statements and algorithms related?
What do algorithms have to do with computers?
Pseudo Code
What is pseudocode?
Writing pseudocode
Pseudo Code vs Algorithm
Components of Data Communication
Characteristics of Data Transmission
Communication Media
Communication Speed
Communication Hardware
Communication Software
OSI Model
Introduction
Syed Zaid Irshad
Rules (that You have to Follow)
Book Introduction
10 Chapters
Theoretical Chapters are 6
Practical Chapters are 4
Chapter 1: Basic Concept of Information Technology
Introduction of Computer
Definition
Characteristics
Parts of Computer
Input
Output
Memory
Primary Storage
Secondary Storage
Ports
Language Translator
Compiler
Interpreter
Generations of Programming Language
Ages of Computers
Generations of Computer
Classification of Computers
Chapter 2: Information Networks
Types of Network
LAN
WAN
MAN
GAN
Topologies
Star
Ring
Bus
Hybrid
File Transfer Protocol
World Wide Web
Chapter 3: Data Communication
Standards
Transmission
Simples
Half Duplex
Full Duplex
Media
Twisted Pair Cable
Coaxial Cable
Fiber Optic Cable
Microwave Transmission
Satellite Transmission
Open Systems Interconnection model (OSI model)
Chapter 4: Applications and Use of Computers
Difference Between Application and Use
Impacts of Computers
Chapter 5: Computer Architecture
Address of Memory Locations
Instruction Format
Fetch and Execute
Chapter 6: Security, Copyright and The Law
Computer Crime
Computer Viruses
Computer Privacy
Software Piracy and Law
Chapter 7: Operating System
User Interface
Graphical User Interface
Operating Systems
Chapter 8: Word Processing
Introduction to MS Word
Creating
Editing
Formatting
Printing
Chapter 9: Spreadsheet
Introduction to MS Excel
Creating
Editing
Formatting
Printing
Formulae
Project
Chapter 10: Internet Browsing and Using E-mail
Create Email ID
Send Mail
Download File
Upload File
Study Plan
Every Tuesday we perform Practical
Every Friday Half of the Lecture will be used as question answer session
Rest of the days are for Theoretical Stuff
Make WhatsApp Group for class where we can share stuff related to the Subject
1st Year Computer Science Book
Sindh Text Book Board Introduction
Introduction
Syed Zaid Irshad
Rules (that You have to Follow)
Book Introduction
10 Chapters
Theoretical Chapters are 6
Practical Chapters are 4
Chapter 1: Basic Concept of Information Technology
Introduction of Computer
Definition
Characteristics
Parts of Computer
Input
Output
Memory
Primary Storage
Secondary Storage
Ports
Language Translator
Compiler
Interpreter
Generations of Programming Language
Ages of Computers
Generations of Computer
Classification of Computers
Chapter 2: Information Networks
Types of Network
LAN
WAN
MAN
GAN
Topologies
Star
Ring
Bus
Hybrid
File Transfer Protocol
World Wide Web
Chapter 3: Data Communication
Standards
Transmission
Simples
Half Duplex
Full Duplex
Media
Twisted Pair Cable
Coaxial Cable
Fiber Optic Cable
Microwave Transmission
Satellite Transmission
Open Systems Interconnection model (OSI model)
Chapter 4: Applications and Use of Computers
Difference Between Application and Use
Impacts of Computers
Chapter 5: Computer Architecture
Address of Memory Locations
Instruction Format
Fetch and Execute
Chapter 6: Security, Copyright and The Law
Computer Crime
Computer Viruses
Computer Privacy
Software Piracy and Law
Chapter 7: Operating System
User Interface
Graphical User Interface
Operating Systems
Chapter 8: Word Processing
Introduction to MS Word
Creating
Editing
Formatting
Printing
Chapter 9: Spreadsheet
Introduction to MS Excel
Creating
Editing
Formatting
Printing
Formulae
Project
Chapter 10: Internet Browsing and Using E-mail
Create Email ID
Send Mail
Download File
Upload File
Study Plan
Every Tuesday we perform Practical
Every Friday Half of the Lecture will be used as question answer session
Rest of the days are for Theoretical Stuff
Make WhatsApp Group for class where we can share stuff related to the Subject
How to Split Bills in the Odoo 17 POS ModuleCeline George
Bills have a main role in point of sale procedure. It will help to track sales, handling payments and giving receipts to customers. Bill splitting also has an important role in POS. For example, If some friends come together for dinner and if they want to divide the bill then it is possible by POS bill splitting. This slide will show how to split bills in odoo 17 POS.
The Roman Empire A Historical Colossus.pdfkaushalkr1407
The Roman Empire, a vast and enduring power, stands as one of history's most remarkable civilizations, leaving an indelible imprint on the world. It emerged from the Roman Republic, transitioning into an imperial powerhouse under the leadership of Augustus Caesar in 27 BCE. This transformation marked the beginning of an era defined by unprecedented territorial expansion, architectural marvels, and profound cultural influence.
The empire's roots lie in the city of Rome, founded, according to legend, by Romulus in 753 BCE. Over centuries, Rome evolved from a small settlement to a formidable republic, characterized by a complex political system with elected officials and checks on power. However, internal strife, class conflicts, and military ambitions paved the way for the end of the Republic. Julius Caesar’s dictatorship and subsequent assassination in 44 BCE created a power vacuum, leading to a civil war. Octavian, later Augustus, emerged victorious, heralding the Roman Empire’s birth.
Under Augustus, the empire experienced the Pax Romana, a 200-year period of relative peace and stability. Augustus reformed the military, established efficient administrative systems, and initiated grand construction projects. The empire's borders expanded, encompassing territories from Britain to Egypt and from Spain to the Euphrates. Roman legions, renowned for their discipline and engineering prowess, secured and maintained these vast territories, building roads, fortifications, and cities that facilitated control and integration.
The Roman Empire’s society was hierarchical, with a rigid class system. At the top were the patricians, wealthy elites who held significant political power. Below them were the plebeians, free citizens with limited political influence, and the vast numbers of slaves who formed the backbone of the economy. The family unit was central, governed by the paterfamilias, the male head who held absolute authority.
Culturally, the Romans were eclectic, absorbing and adapting elements from the civilizations they encountered, particularly the Greeks. Roman art, literature, and philosophy reflected this synthesis, creating a rich cultural tapestry. Latin, the Roman language, became the lingua franca of the Western world, influencing numerous modern languages.
Roman architecture and engineering achievements were monumental. They perfected the arch, vault, and dome, constructing enduring structures like the Colosseum, Pantheon, and aqueducts. These engineering marvels not only showcased Roman ingenuity but also served practical purposes, from public entertainment to water supply.
Read| The latest issue of The Challenger is here! We are thrilled to announce that our school paper has qualified for the NATIONAL SCHOOLS PRESS CONFERENCE (NSPC) 2024. Thank you for your unwavering support and trust. Dive into the stories that made us stand out!
2024.06.01 Introducing a competency framework for languag learning materials ...Sandy Millin
http://sandymillin.wordpress.com/iateflwebinar2024
Published classroom materials form the basis of syllabuses, drive teacher professional development, and have a potentially huge influence on learners, teachers and education systems. All teachers also create their own materials, whether a few sentences on a blackboard, a highly-structured fully-realised online course, or anything in between. Despite this, the knowledge and skills needed to create effective language learning materials are rarely part of teacher training, and are mostly learnt by trial and error.
Knowledge and skills frameworks, generally called competency frameworks, for ELT teachers, trainers and managers have existed for a few years now. However, until I created one for my MA dissertation, there wasn’t one drawing together what we need to know and do to be able to effectively produce language learning materials.
This webinar will introduce you to my framework, highlighting the key competencies I identified from my research. It will also show how anybody involved in language teaching (any language, not just English!), teacher training, managing schools or developing language learning materials can benefit from using the framework.
This is a presentation by Dada Robert in a Your Skill Boost masterclass organised by the Excellence Foundation for South Sudan (EFSS) on Saturday, the 25th and Sunday, the 26th of May 2024.
He discussed the concept of quality improvement, emphasizing its applicability to various aspects of life, including personal, project, and program improvements. He defined quality as doing the right thing at the right time in the right way to achieve the best possible results and discussed the concept of the "gap" between what we know and what we do, and how this gap represents the areas we need to improve. He explained the scientific approach to quality improvement, which involves systematic performance analysis, testing and learning, and implementing change ideas. He also highlighted the importance of client focus and a team approach to quality improvement.
We all have good and bad thoughts from time to time and situation to situation. We are bombarded daily with spiraling thoughts(both negative and positive) creating all-consuming feel , making us difficult to manage with associated suffering. Good thoughts are like our Mob Signal (Positive thought) amidst noise(negative thought) in the atmosphere. Negative thoughts like noise outweigh positive thoughts. These thoughts often create unwanted confusion, trouble, stress and frustration in our mind as well as chaos in our physical world. Negative thoughts are also known as “distorted thinking”.
Unit 8 - Information and Communication Technology (Paper I).pdfThiyagu K
This slides describes the basic concepts of ICT, basics of Email, Emerging Technology and Digital Initiatives in Education. This presentations aligns with the UGC Paper I syllabus.
How to Make a Field invisible in Odoo 17Celine George
It is possible to hide or invisible some fields in odoo. Commonly using “invisible” attribute in the field definition to invisible the fields. This slide will show how to make a field invisible in odoo 17.
3. Introduction
– A flowchart is simply a graphical representation of steps.
– It shows steps in sequential order and is widely used in presenting the flow of
algorithms, workflow or processes.
– Typically, a flowchart shows the steps as boxes of various kinds, and their order by
connecting them with arrows.
4. History
– Flowcharts to document business processes came into use in the 1920s and ‘30s.
– In 1921, industrial engineers Frank and Lillian Gilbreth introduced the “Flow Process
Chart” to the American Society of Mechanical Engineers (ASME).
– In the early 1930s, industrial engineer Allan H. Morgensen used Gilbreth’s tools to
present conferences on making work more efficient to business people at his company.
– In the 1940s, two Morgensen students, Art Spinanger and Ben S. Graham spread the
methods more widely. Spinanger introduced the work simplification methods to Procter and
Gamble. Graham, a director at Standard Register Industrial, adapted flow process charts to
information processing.
– In 1947, ASME adopted a symbol system for Flow Process Charts, derived from the
Gilbreths’ original work.
5. History
– In Japan, Kaoru Ishikawa (1915-1989), a key figure in quality initiatives in
manufacturing, named flowcharts as one of the key tools of quality control, along with
complementary tools such as the Histogram, Check Sheet and Cause-and-Effect Diagram,
now often called the Ishikawa Diagram.
– In the late ‘40s, Herman Goldstine and John Van Neumann used flowcharts to develop
computer programs, and diagramming soon became increasingly popular for computer
programs and algorithms of all kinds.
– Flowcharts are still used for programming today, although pseudocode, a combination
of words and coding language meant for human reading, is often used to depict deeper
levels of detail and get closer to a final product.
6. Symbols
– Flowchart uses 9 symbols to represent different parts of a task.
– Terminator
– Process
– Document
– Decision
– Data
– On-Page Reference
– Off-Page Reference
– Delay or Bottleneck
– Flow
7. Symbols
– Terminator: The terminator symbol represents the starting or ending point of the system.
– Process: A box indicates some particular operation.
– Document: This represents a printout, such as a document or a report.
8. Symbols
– Decision: A diamond represents a decision or branching point. Lines coming out from the
diamond indicates different possible situations, leading to different sub-processes.
– Data: It represents information entering or leaving the system. An input might be an
order from a customer. Output can be a product to be delivered.
9. Symbols
– On-Page Reference: This symbol would contain a letter inside. It indicates that the flow
continues on a matching symbol containing the same letter somewhere else on the same
page.
– Off-Page Reference: This symbol would contain a letter inside. It indicates that the flow
continues on a matching symbol containing the same letter somewhere else on a
different page.
10. Symbols
– Delay or Bottleneck: Identifies a delay or a bottleneck.
– Flow: Lines represent the flow of the sequence and direction of a process.
11. Benefit
– It helps to clarify complex processes.
– It identifies steps that do not add value to the internal or external customer, including
delays; needless storage and transportation; unnecessary work, duplication, and added
expense; breakdowns in communication.
– It helps team members gain a shared understanding of the process and use this
knowledge to collect data, identify problems, focus discussions, and identify resources.
– It serves as a basis for designing new processes.
12. Examples
Start Start
Get Fahrenheit Get Fahrenheit
Subtract 32
Multiply by 5
Divided by 9
Output Celsius
End
C = 5/9 * (F-32)
Output Celsius
End