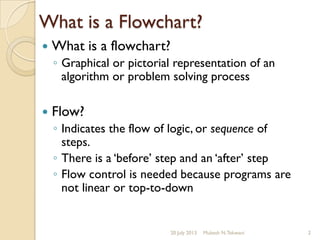
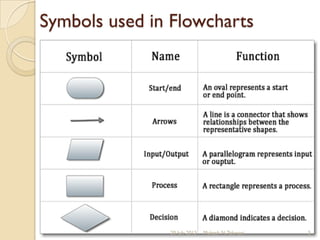
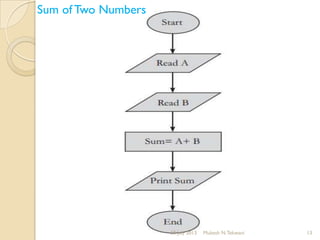
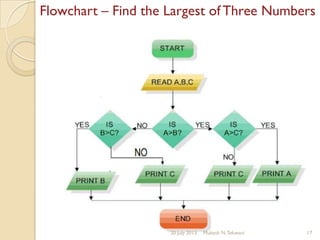
1) A flowchart is a graphical representation of an algorithm or process that uses standard symbols to indicate the flow of logic and sequence of steps.
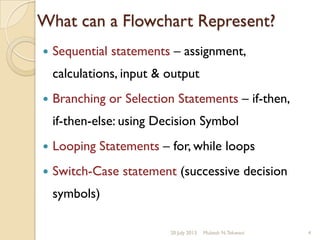
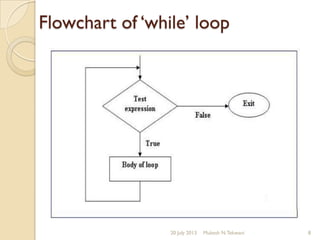
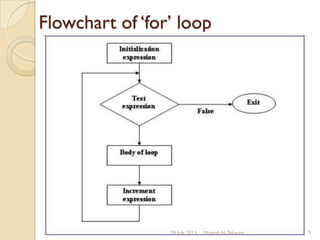
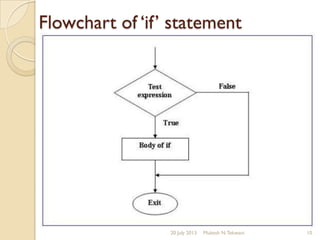
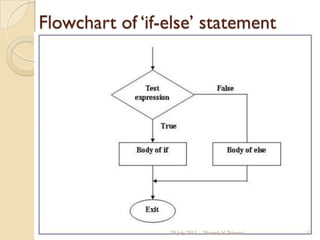
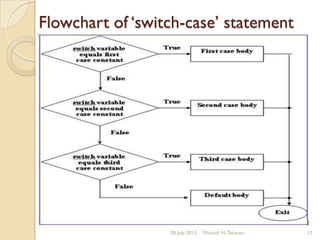
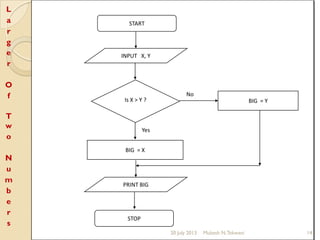
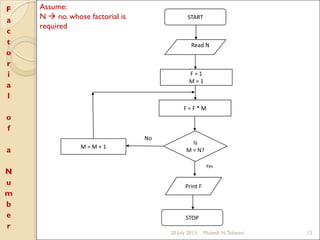
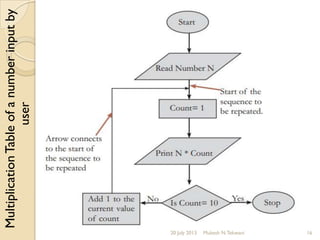
2) Flowcharts are useful for documenting and understanding complex logic in a language-independent way. They can represent sequential statements, branching, looping, and other control structures.
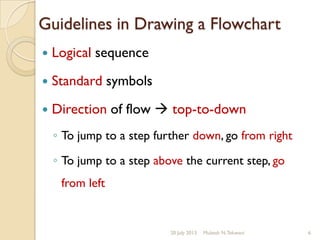
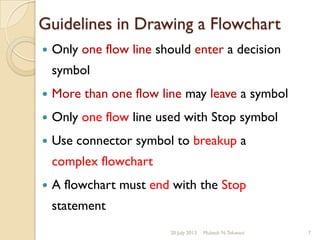
3) Guidelines for drawing flowcharts include using standard symbols, maintaining logical sequence from top to bottom, and ensuring only one line enters decision points while multiple lines can leave.