
Recommended
More Related Content
What's hot
What's hot (20)
Viewers also liked
Similar to Radar chart guide
Similar to Radar chart guide (20)
More from 丹 丹
More from 丹 丹 (15)
Recently uploaded
Recently uploaded (20)
Radar chart guide
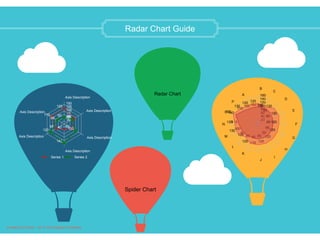
- 1. Radar Chart Guide Spider Chart Radar Chart Axis Description Axis Description Axis Description Axis Description Axis Description Axis Description 25 50 75 100 125 150 120 86 684068 110 50 70 100 145 120 60 Series 1 Series 2 B C D E F G H I J K L M N O P A 20 40 60 80 100 120 140 160 100 100 95 90 86 86 86 868686 90 100 110 140 110 100 120 105 130 130 120 120 120 120120120 105 130 135 155 130 120 Created by Edraw - All in One Diagram Software
- 2. Contents Definition of Radar Chart 1 Benefits of Radar Chart 2 Drawbacks of Radar Chart 3 Tips for Developing Radar Chart 4 Radar Chart Software 5 How to Draw a Radar Chart 6 Radar Chart Templates/Examples 7 Created by Edraw - All in One Diagram Software
- 3. Definition of Radar Chart Radar chart is a graphical way to compare data by displaying data in a "web-like" form looking like spider web. So it is also known as spider chart or graph. Usually, it is applied to evaluate multiple alternatives based on multiple criteria. Created by Edraw - All in One Diagram Software
- 4. Benefits of Radar Chart Clearly displays the important categories. Makes concentrations of strengths and deficiencies visible. Add interest to what would otherwise be a dry data presentation Clearly defines full performance in each category. Created by Edraw - All in One Diagram Software
- 5. Drawbacks of Radar Chart Radar chart cannot show subtle issues clearly. Radar charts tend to illustrate comparisons through general rating while many evaluation criteria are multifaceted. Drawback 1 It is cumbersome to compare values on non-adjacent axes, which requires a surprising amount of conscious effort. Drawback 2 Created by Edraw - All in One Diagram Software
- 6. Tips for Developing Radar Chart No more than 15 alternatives should be compared in radar charts or it will looks cramped. When rating, you had better use at least three criteria, more may be helpful, but more than seven may be too complex. It is helpful to standardize ratings to some uniform scale (for example 0-10, or 0-100%). Using different colors or markers to distinguish each alternative is best. Created by Edraw - All in One Diagram Software
- 7. Radar Chart Software Rich built-in shapes, templates and examples. 100% compatibility with MS programs. 1 click export as other formats. Drag-and-drop interface similar with MS Word. Automatic function. Import data to make radar chart. Edraw Radar Chart Software Edraw Radar Chart Software - a powerful yet easy to use data analysis tool. Created by Edraw - All in One Diagram Software
- 8. How to Draw a Radar Chart 1 4 5 3 2 Identify the series to be compared. Generate criteria to rate each serie. Rate each alternative based on criteria. Select a suitable template and set relevant appearance options. Set and label the axis arms of the chart (one arm for each criterion). Label each alternative's ratings on the chart. When you enter the data, the shape changes automatically. 6 Add some final touches such as background or clipart to beatify it. Created by Edraw - All in One Diagram Software
- 9. Radar Chart Templates/Examples Title Description Title Description Double click value text to edit the chart data, the point position changes according to the value and axis max value. Title Select a series sub shape change its line or fill style. Title Category 1 Category 2 Category 3 Category 4 Category 5 Category 6 Category 7 Category 8 Category 8 Category 8 Category 8 Category 8 18.333 36.667 55 73.333 91.667 110 100 85 66 88 58 7968 49 49 49 49 49 62 55 35 59 72 89 8292 92 92 92 92 78 45 25 35 65 54 62 79 79 79 79 79 Series 1 Series 2 Series 3 Categories, Category 1, Category 2, Category 3, Category 4, Category 5, Category 6,Category 7, Category 8 Series 1, 100, 85, 66, 88, 58, 79,68, 49 Series 2, 62, 55, 35, 59, 72, 89,82, 92 Series 3, 78, 45, 25, 35, 65, 54,62, 79 The spider chart is using the following data. You can copy it to a text file then modify. Created by Edraw - All in One Diagram Software
- 10. Brand Reputation Tech Support Community Awareness Employment Practices Ethical Practices Product Quality Customer Focus Future Orientation 10 20 30 40 50 60 70 80 90 100100 100 90 90 86 86 86 86 65 100 80 85 50 100 100 60 88 100 60 10070 70 75 100 Company A Company B Company C Public Perception Survey This chart compares the public perception of three high-technology companies. It's based on a hypothetical survey distributed in a popular industry magazine with a circulation of more than 600,000. There were approximately 20,000 respondents. The survey asked participants to rate each subject in eight categories on a scale of 0 to 100. This analysis shows that for the area of Tech Support, at three companies enjoy similar reputations. This rating might be considered industry standard. The ethical practice category shows a very different picture with the public clearly perceiving company B as behind in that area. Notes More radar char templates can be found in https://www.edrawsoft.com/spider-chart-solutions.php
- 11. Math Computer Science Biology Chemistry Physics Geography 20 40 60 80 100 80 82 77 68 75 70 90 88 88 83 85 92 68 93 58 63 70 60 Average Score of Class 1 Lucy Tom Test Scores Analysis See how to use radar chart for data anakysis in
- 12. Communication Skills Technical Knowledge Teamwork Meeting Deadline Problem Solving Punctuality 1 2 3 4 5 2 5 2 3 4 4 4 4 5 5 4 5 Calvin Susan Employee Performance Appraisal (Scale of 1-5, 5 being the highest)