Downloaded 342 times

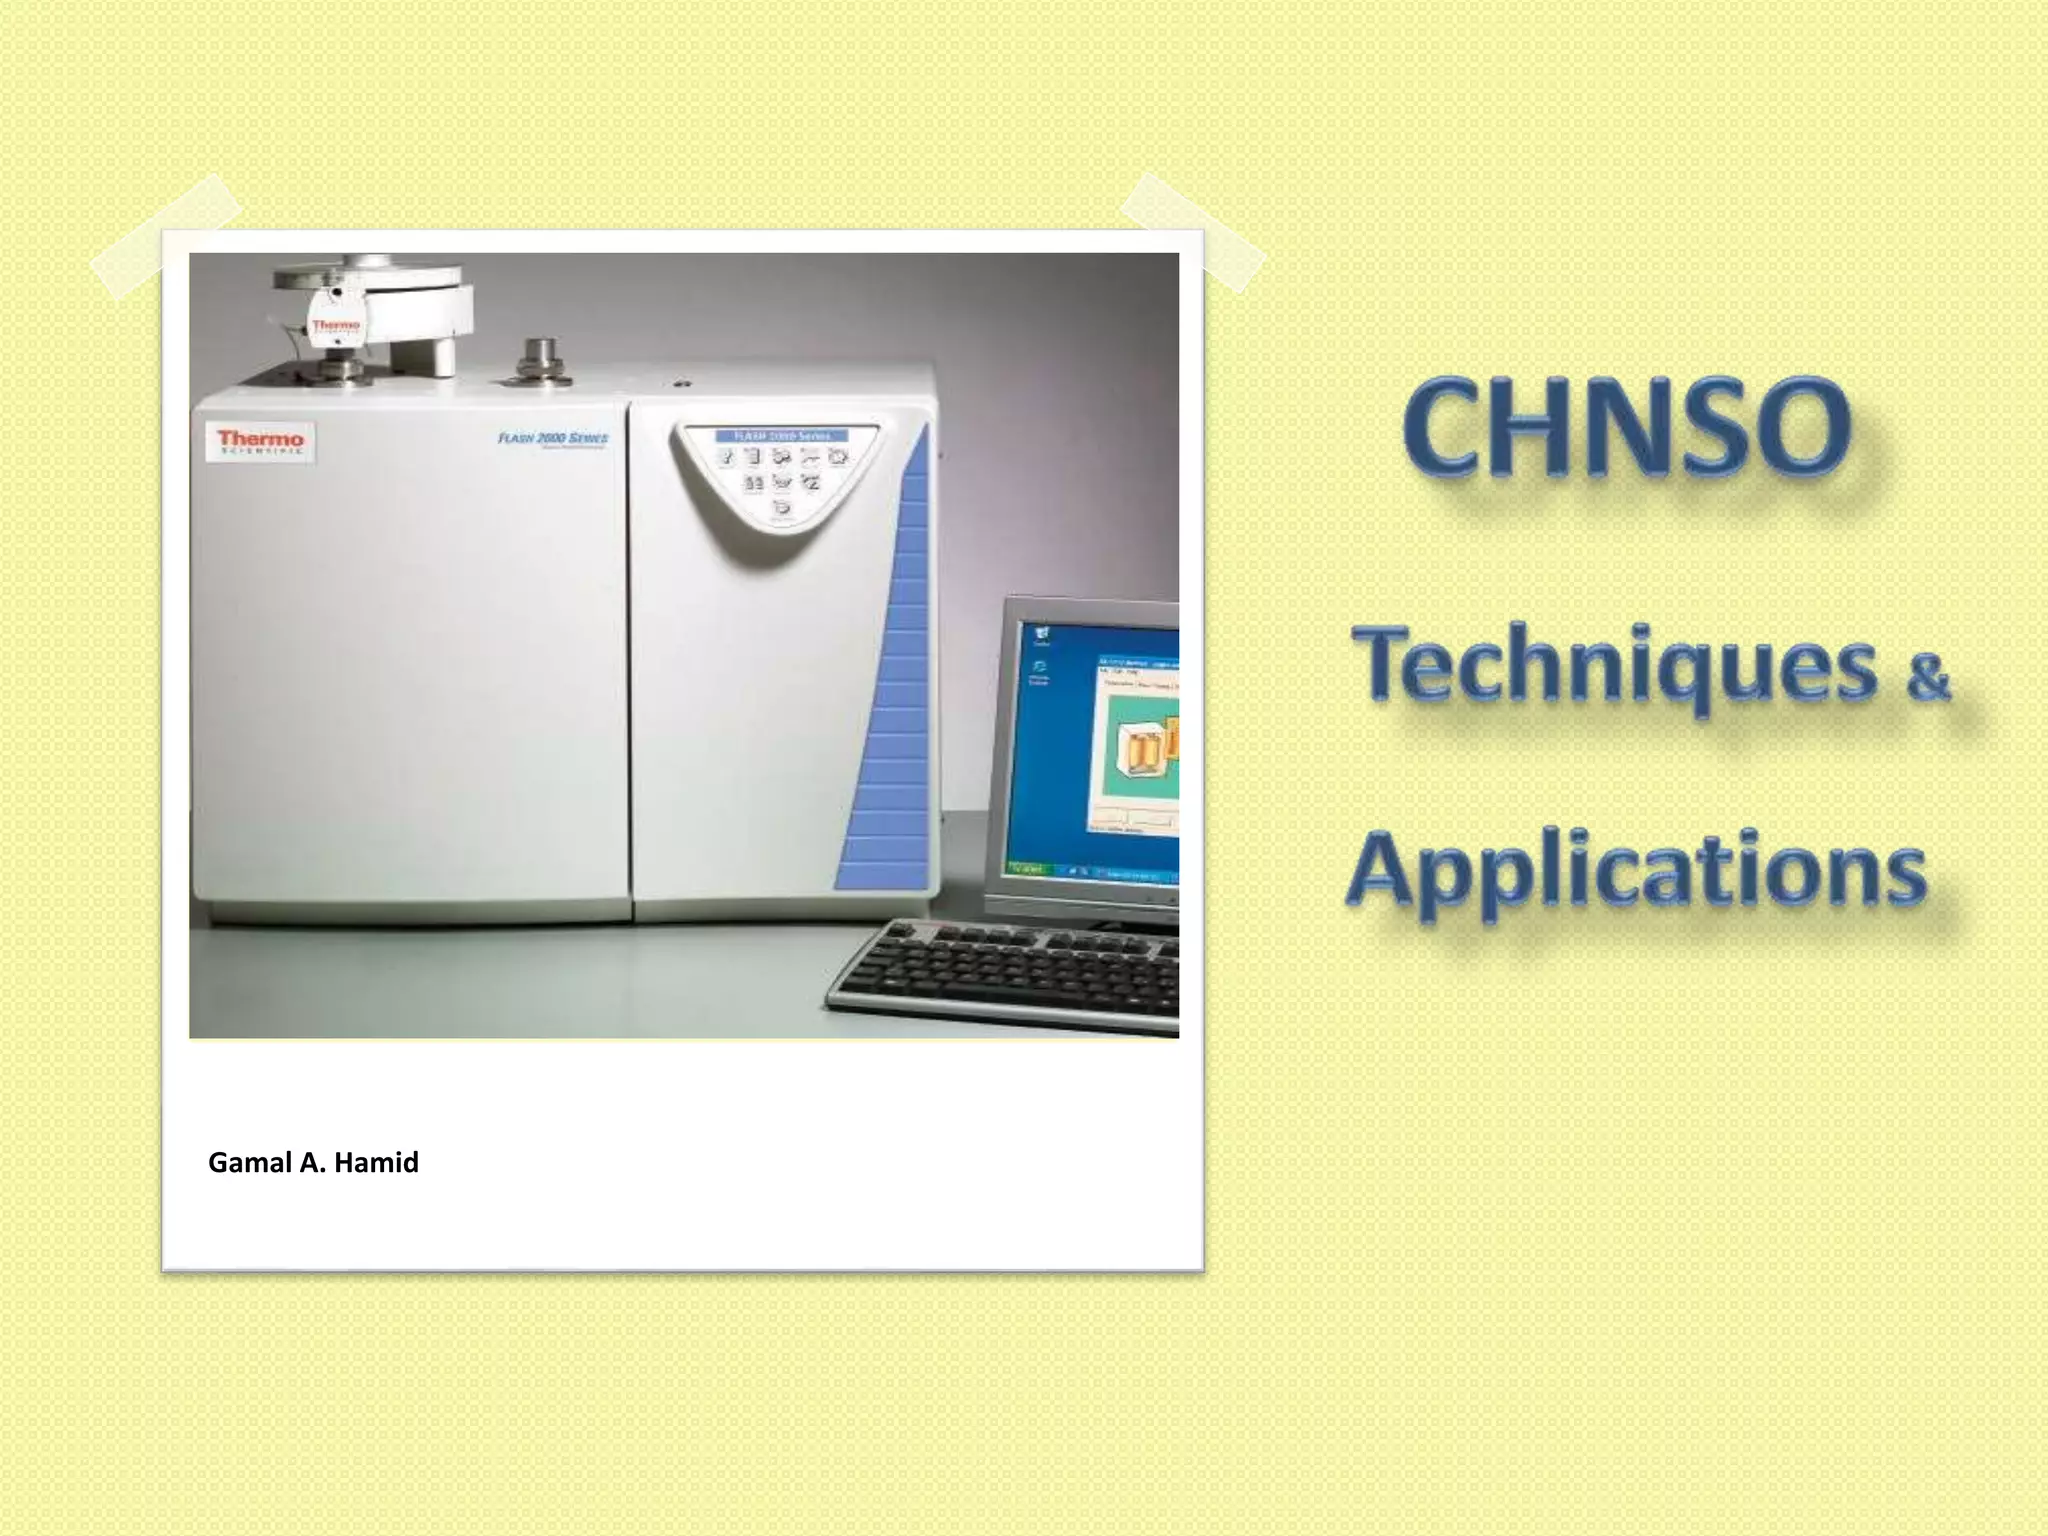

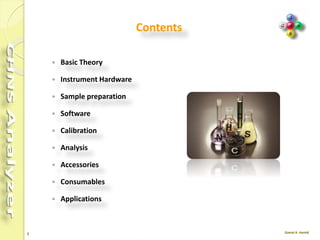

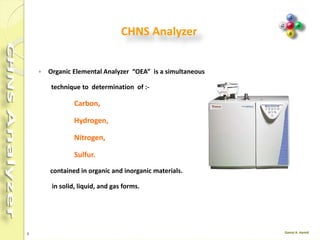
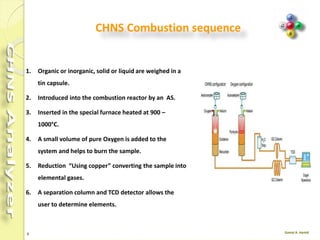

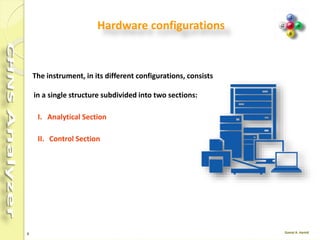
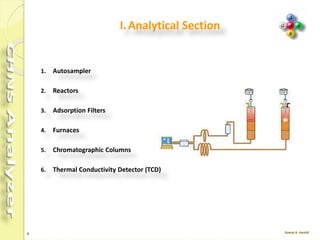
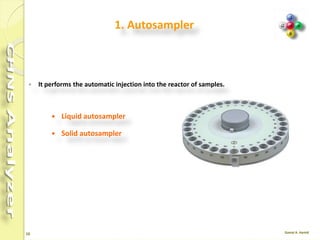


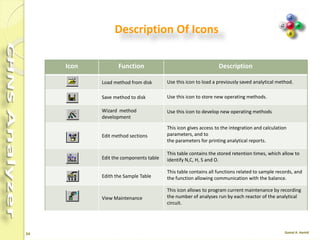
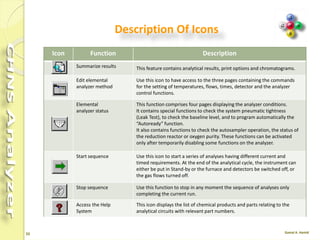
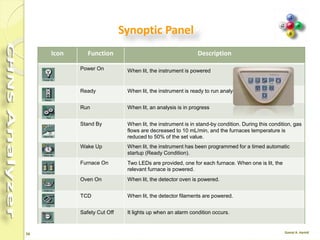


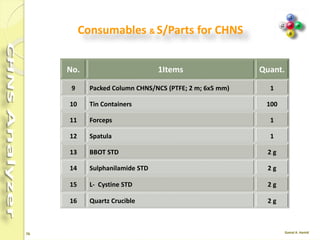

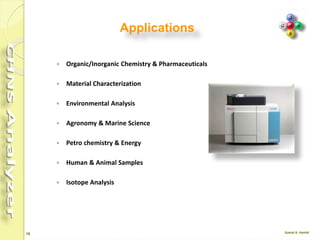
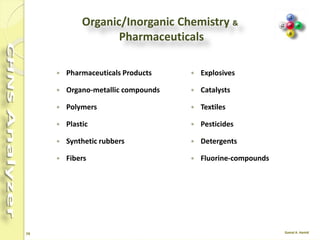
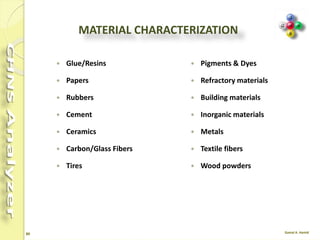


The document discusses the operation and configuration of a CHNS analyzer, specifically the organic elemental analyzer (OEA), detailing its components such as the autosampler, reactors, filters, furnaces, and thermal conductivity detector. It also covers sample preparation methods, calibration, and maintenance procedures for the equipment. Additionally, the Eager Xperience software is introduced as a tool for instrument operation and data evaluation.