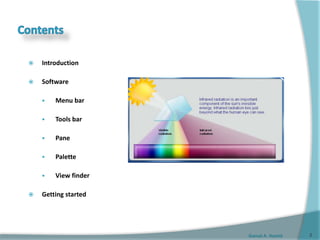
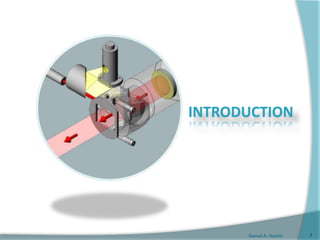
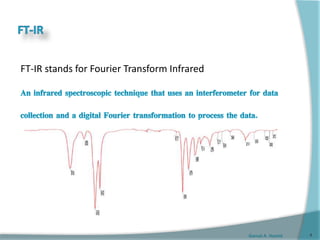
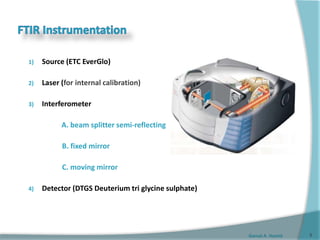
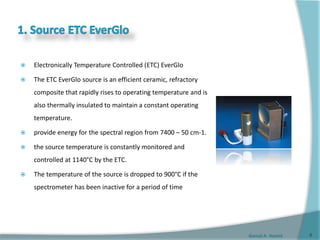
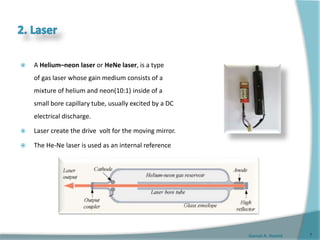
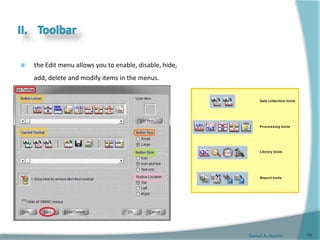
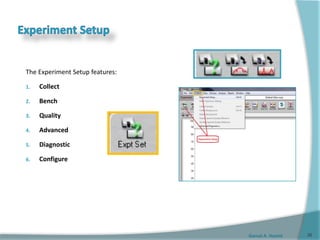
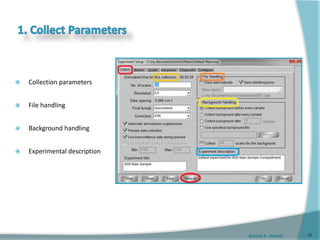
This document provides an overview of Fourier transform infrared (FT-IR) spectroscopy and the components of an FT-IR spectrometer. It describes the main parts of an FT-IR including the source, interferometer, detector, and how an interferogram is produced and transformed to a spectrum. It also explains common experimental parameters like resolution, scans, spectral range and how to collect background and sample scans.
The document discusses the functions and working principles of an energy dispersive spectrometer (EDS). EDS can determine the chemical composition of materials down to the micron scale by detecting the characteristic x-rays emitted when the material is exposed to an electron beam. The EDS system includes an x-ray detector that converts x-ray energies into electrical signals and a multi-channel analyzer to separate the signals by energy into an elemental composition spectrum. Factors such as detector resolution, sample properties, and operating conditions can affect the accuracy of elemental quantification by EDS.
Spin-lattice & spin-spin relaxation, signal splitting & signal multiplicity concepts briefly explained relevant to Nuclear Magnetic Resonance Spectroscopy.
This document provides an overview of X-ray diffraction (XRD). It begins by explaining that XRD is a non-destructive chemical analysis technique that uses X-rays and the atomic structure of crystals to identify substances. Every crystalline substance produces a unique XRD pattern like a fingerprint. The document then discusses how X-rays are generated via electron bombardment, Bragg's law of diffraction, X-ray sources, working principles of XRD, and basic components of an XRD system like the X-ray tube and detector. It also covers sample preparation techniques for clay minerals analysis using XRD.
A method of obtaining an Infrared spectrum by measuring the interferogram of a sample using an interferometer, then performing a Fourier Transform upon the interferogram to obtain the spectrum.
Thermogravimetric analysis (TGA) is a technique that measures how the weight of a material changes as it is heated. TGA provides information about decomposition temperatures, thermal degradation properties, and quantitative weight losses. The key components of a TGA instrument are a furnace, balance, temperature controller, and recorder. Samples are heated and their weight changes are measured continuously as a function of increasing temperature. Weight loss curves can indicate decomposition reactions and be used to determine composition. TGA has applications in characterizing materials used in various industries.
X-ray fluorescence (XRF) spectrometry is an elemental analysis technique that uses X-rays to identify and quantify elements in a sample. When an inner shell electron is ejected from an atom by an X-ray source, an outer shell electron fills its place and emits a fluorescent X-ray that is characteristic of that element. By measuring the intensities of emitted X-ray energies, the elements present in a sample can be determined. XRF spectrometers consist of an X-ray source, sample holder, detector, and analyzer to measure fluorescent X-rays. XRF analysis is non-destructive, rapid, and widely used in industries like petroleum, mining, metallurgy, and cer
Gas chromatography is a technique that separates volatile organic compounds using a carrier gas and a column with a stationary phase. The basic system includes an injection port, separation column in an oven, and detector. Samples are vaporized and carried by the gas through the column where compounds separate based on interactions with the stationary phase and exit the column at different rates, known as elution. The detector measures the compounds and generates a chromatogram to identify and quantify the separated components. Common detectors include the flame ionization detector. Gas chromatography has various applications like analysis of biological samples.
This document discusses field desorption mass spectrometry. It provides background on field desorption, comparing it to field ionization. Field desorption involves applying a sample solution to an emitter, which is then placed in an ion source. It is well-suited for analyzing non-volatile or thermally fragile compounds like polymers, peptides, and inorganic salts. The document reviews experimental techniques in field desorption mass spectrometry and provides examples of its applications in areas like polymer analysis, pharmaceuticals, and fossil fuel research.
An Infrared spectrum represents a fingerprint of a sample with absorption peaks which correspond to the frequencies of vibrations between the bonds of the atoms making up the material-Because each different material is a unique combination of atoms, no two compounds produce the exact same spectrum, therefore IR can result in a unique identification of every different kind of material!
This document provides an overview of Fourier transform infrared (FTIR) spectroscopy. It discusses the theory behind FTIR, which uses an interferometer to measure all infrared frequencies simultaneously rather than individually. The key components of an FTIR spectrometer are described, including the radiation source, interferometer, and various detector types. Advantages of FTIR over dispersive instruments include its simpler design, elimination of stray light issues, and ability to rapidly collect an entire infrared spectrum. Applications of FTIR spectroscopy are also mentioned.
Infrared spectroscopy is a technique that uses infrared light to determine the functional groups present in molecules based on the vibrations of atoms. It works by passing infrared radiation through a sample and measuring the absorption of specific wavelengths, which correspond to vibrations between bonds of different atoms. The peaks in an infrared spectrum can identify functional groups and chemical bonds based on the wavelength of absorption. Fourier transform infrared spectroscopy is now commonly used as it allows simultaneous detection of all infrared wavelengths for faster analysis.
It is a multi-element analysis technique that will separate a sample into its constituent atoms and ions and excite it to a higher energy level.
Cause them to emit light with a distinct wavelength, which will be analyzed.
X-ray fluorescence is a technique used to analyze the elemental composition of materials. It works by using X-rays to excite electrons in the inner shells of atoms within a sample. This causes the emission of characteristic X-rays from the outer electron shells filling the inner shell vacancies. The energies of these emitted X-rays are analyzed to identify the elemental composition of the sample. Common applications of this technique include analysis of materials in forensic investigations and archaeological specimens to determine their elemental makeup.
This document describes the key components and functioning of instrumentation used in x-ray diffraction. The main components are a radiation source like an x-ray tube, a collimator to narrow the beam, a monochromator to remove unwanted radiation, detectors like photographic film or counters, and associated electronics. X-ray tubes generate x-rays via the impact of electrons on a metal target. Collimators and monochromators shape and refine the x-ray beam before it interacts with the sample. Detectors then measure the diffraction pattern, with options including film, Geiger-Muller tubes, proportional counters, scintillators, and semiconductors.
Thermal analysis techniques such as thermo gravimetric analysis (TGA) and differential thermal analysis (DTA) are used to study how the properties of materials change with temperature. TGA measures weight changes in a material as it is heated, revealing physical and chemical changes like decomposition and phase transitions. DTA detects exothermic or endothermic reactions in a sample material by comparing its temperature to a reference as both are heated. Common applications of these techniques include determining purity and stability, studying reaction kinetics, and characterizing complex mixtures.
This document discusses light sources and background corrections for Atomic Absorption Spectroscopy (AAS). It describes two main light sources: hollow-cathode lamps and electrodeless discharge lamps. Hollow-cathode lamps consist of a tungsten anode and metal cathode enclosed in a glass tube with inert gas. An applied voltage excites the gas to produce characteristic radiation from the coated metal. Electrodeless discharge lamps contain inert gas and metal salt excited by radio waves. The document also discusses methods to correct for spectral interferences, including continuum source correction, Zeeman effect background correction, and source self-reversal using high and low lamp currents.
X-ray powder diffraction is a nondestructive technique used to characterize both organic and inorganic materials. It can be used to identify crystal phases, perform quantitative analysis, and determine structural imperfections in samples from fields like geology, polymers, pharmaceuticals, and forensics. In geology specifically, XRD is widely used for quantitative analysis and can identify clay-rich minerals and other fine-grained minerals that are difficult to analyze optically, providing information about mineral composition and properties.
FTIR spectroscopy works by collecting an interferogram using an interferometer, then applying a Fourier transform to obtain the infrared spectrum. Radiation from a source is split into two beams that reflect between a fixed and moving mirror, recombining to produce an interferogram containing all infrared information. The Fourier transform converts this interferogram into a spectrum as a function of wavelength. FTIR has advantages over dispersive IR including faster measurement times as it collects all frequencies simultaneously, higher signal-to-noise ratios, and improved wavelength accuracy from calibration with a He-Ne laser.
This document provides an overview of X-ray fluorescence (XRF) spectroscopy. It discusses XRF theory, instrumentation, hardware, and applications. XRF uses X-rays to excite a sample, and a detector then measures the fluorescent X-rays emitted from the sample that are characteristic of its elemental composition. The document compares wavelength dispersive XRF and energy dispersive XRF, and describes the components of XRF systems including X-ray sources, detectors, filters, and electronics. It provides examples of XRF applications in qualitative and quantitative elemental analysis across various industries.
Modern NMR spectrometers use superconducting magnets to generate a strong, stable magnetic field. They consist of a magnet, probes, RF sources and amplifiers, digitizers, and computers. Superconducting magnets require liquid helium to maintain the wire in a superconducting state, generating magnetic fields of 7-21 Tesla. Shim coils and locking systems ensure field homogeneity. Probes contain coils close to the sample for excitation and detection. RF transmitters generate pulses which are amplified, while receivers detect and digitize signals for computer processing and analysis. Additional components include sample spinners, insertion systems, and field gradient coils.
The document discusses the principles and instrumentation of X-ray diffraction technique. It describes how X-rays are generated using a Coolidge tube, which has a tungsten filament that produces electrons when heated. These electrons are accelerated towards a metal anode, producing X-rays. The X-rays are collimated and directed at a sample. Diffraction patterns are obtained that provide information about the sample's crystal structure. Common methods to analyze diffraction patterns include Laue photography, Bragg spectroscopy, and powder methods. XRD has various applications like determining crystal structures and particle sizes.
UV-VIS reflectance spectroscopy is a technique that measures the diffuse reflectance of a sample across UV and visible wavelengths. It works by directing light at a sample inside an integrating sphere, which captures reflected light and directs it to a detector. The ratio of reflected to incident light at each wavelength is the reflectance spectrum. Reflectance is affected by factors like particle size, homogeneity, and packing density. It finds applications in pharmaceutical analysis and other industries to qualitatively and quantitatively analyze samples like drugs, proteins, and chemicals.
This document provides an overview of thermogravimetric analysis (TGA). TGA measures how the mass of a sample changes as it is heated. Key points:
- TGA uses a high-precision balance called a thermogravimetric analyzer or thermobalance to measure mass changes as temperature is increased.
- Results are displayed as thermogravimetric (TG) curves plotting mass change vs. temperature or time. Curves reveal information about decomposition temperatures, reactions, and composition.
- Instrumentation includes the microbalance, furnace, temperature controller, and data recorder. Microbalances must precisely and rapidly detect small mass changes under varying conditions.
- Interpretation of TG
FT-IR spectroscopy Instrumentation and Application, By- Anubhav singh, M.pharmAnubhav Singh
This document discusses instrumentation and applications of Fourier transform infrared (FTIR) spectroscopy. It begins by explaining the basic principles of FTIR spectroscopy, how it works, and its advantages over dispersive infrared spectroscopy. It then describes various applications of FTIR spectroscopy like polymer processing, plasma etching, identification of materials, and analysis of formulations. Specific examples discussed include drying and curing polymers, monitoring plasma etching, identifying contamination, and distinguishing different functional groups in molecules. The document concludes by noting the advantages, limitations, and comparison of FTIR spectroscopy to dispersive infrared spectroscopy.
The document discusses Fourier transform infrared (FTIR) spectroscopy. It explains that FTIR spectroscopy uses a Michelson interferometer to obtain an infrared spectrum of a sample. The interferometer collects an interferogram that is then Fourier transformed to obtain the spectrum. FTIR spectroscopy provides advantages over dispersive infrared spectroscopy like speed, sensitivity, and mechanical simplicity. It finds applications in identifying organic and inorganic compounds, mixtures, and gases, liquids, and solids.
Differential thermal analysis (DTA) is a thermal analysis technique that measures the temperature difference between a sample and an inert reference material as they are heated or cooled. DTA can detect physical or chemical changes in a sample as they occur, such as fusion, crystallization, oxidation, or decomposition. Changes are detected based on the temperature difference that develops between the sample and reference material. DTA provides a characteristic "fingerprint" curve for a sample that can be used to identify materials. Common applications of DTA include quantitative identification and purity assessment of materials.
This document provides an overview of Fourier transform infrared (FT-IR) spectroscopy. It discusses the electromagnetic spectrum and how infrared radiation lies between visible light and microwaves. Infrared spectroscopy works by detecting the vibrations of bonds between atoms in molecules as they absorb infrared light. An FT-IR uses an interferometer to measure an infrared spectrum with advantages of high sensitivity, accuracy, and resolution compared to other methods. The document outlines applications of infrared spectroscopy such as pharmaceutical analysis and environmental monitoring.
The document describes the supplementary materials for an open source integrated microscopy platform called OpenSpin. It includes 7 supplementary figures that show the OpenSpin Microscopy plugin interface, the Arduino microcontroller shield for galvo control, schematics of the SPIM/DSLM/OPT setup and dedicated OPT setup, light-sheet characterization, and multimode SPIM/DSLM images of a Drosophila embryo. It also includes a supplementary table listing the major parts of the SPIM/DSLM/OPT setup and 3 supplementary notes on Micromanager, sample preparation, and OPT dataset preparation and reconstruction.
Quadcopters are the rotorcraft which have become the catch of the eye in the UAVs, both for electronic hobbyists as well as various application based real time solutions.
Blue Star Engineering & Electronics Ltd provides advanced technology products as well as turnkey engineering solutions that cater to several industries across the country. We manufacture healthcare systems like MRI & CT Scan Machines, Testing machines, NDT and industrial automation systems like AEPS, Metrology, UPI payment and much more.
This document provides information about UV/VIS spectroscopy software. It discusses the various components and features of the software, including the main window, menus, toolbars, data store, status bar, and reporting capabilities. It also describes the different application modes like scan, fixed, quantitative, rate, MCA, and DNA analysis. Parameters for these applications and accessories like rapid mixing, stirrer, temperature control, cell changer, and sipper are outlined as well.
This document describes a lighting load control system using GSM technology. The system uses a microcontroller that is connected to devices, an LCD display, and a DTMF decoder. The DTMF decoder receives DTMF tones from a mobile phone over GSM and decodes them. The microcontroller then controls devices like lights or appliances based on the decoded DTMF tones received from the mobile phone. The system allows remote monitoring and control of devices using a mobile phone through the GSM network.
The document proposes an intelligent system to assist patients using wireless applications and low-cost equipment. The system has three main modules: a user badge module worn by the patient with sensors to detect vital signs, a receiver module at the patient's location, and a system module on a central computer. The system monitors the patient's heartbeat and temperature from the user badge and can detect falls using a web camera. If vital signs go outside normal ranges or a fall is detected, an alert is triggered to help patients in critical conditions.
This document discusses adaptive cruise control (ACC) systems which help drivers maintain a safe distance from vehicles ahead. [1] ACC uses sensors like radar or lidar to detect the speed and distance of nearby vehicles and controls braking/acceleration accordingly. [2] More advanced systems allow vehicles to communicate with each other via technologies like Bluetooth to coordinate speeds and braking, forming "platoons" of vehicles with minimized spacing between them for improved traffic flow. [3] While ACC helps relieve driver workload, challenges remain around high costs and ensuring drivers remain attentive with such assistive systems.
Microwave Radiometer Analysis for Imaging and Vehicular SystemsIRJET Journal
This document summarizes a research paper about using microwave radiometry for fire detection around moving vehicles. The paper proposes using a ground-based microwave radiometer mounted near a road or rail track to image potential fire areas on a passing vehicle. Simulations were conducted using 30 GHz microwave radiation to analyze transmission through typical vehicle walls of different materials, thicknesses, and properties. The research suggests microwave radiometry may provide early fire detection by measuring changes in emitted radiation transmitted through dielectric vehicle walls, as an alternative or supplement to existing infrared sensor systems.
1. Electronic Portal Imaging Devices (EPIDs) are imaging devices mounted on linear accelerators opposite the MV x-ray source.
2. EPIDs have a wide variety of applications including real-time patient setup verification during treatment and determining beam blocking shapes and leaf positions.
3. Commercially available EPIDs include scanning liquid-filled ion chamber devices, camera-based devices, and active matrix flat panel detectors. They provide localization quality images with doses less than 3 cGy.
This document describes a voice transmission system using frequency modulation for a college radio application. It includes an introduction to radio transmission and frequency modulation. The system uses a microcontroller, real-time clock, power supply, and relay to automatically control an FM radio according to a scheduled program. It allows setting time intervals to turn the radio on and off and broadcasting college programs and information through radio frequencies. The system provides an automated solution with advantages of flexibility and no human effort required.
Gamma cameras use NaI(Tl) scintillation crystals and photomultiplier tubes to detect gamma rays emitted by radiotracers injected into patients. They produce 2D images used for nuclear medicine diagnoses. Key components include parallel hole collimators to filter gamma rays, crystals that convert gamma rays to light, PMTs that convert light to electrical signals, and computers for image processing. Quality assurance tests image uniformity, resolution, background levels, and the center of rotation. Gamma cameras have improved diagnosis since their development in the 1950s and remain an important tool in nuclear medicine.
This article illustrates the principle and working of Colorimeter and Photometer and how absorbance, transmittance and light intensity can be measured.
Hướng dẫn sử dụng máy đo cường độ sóng điện trường Tenmars TM-195Tenmars Việt Nam
Hướng dẫn sử dụng máy đo cường độ sóng điện trường Tenmars TM-195
https://tenmars.vn/san-pham/do-cuong-do-dien-truong-tenmars-tm-195/
https://tenmars.vn/danh-muc/do-tu-truong-dien-tenmars/
This project uses an infrared remote control to switch on and off up to six home appliances and one fan using an 8-bit microcontroller. The microcontroller receives infrared signals from the remote and decodes them to control the devices. It can control electrical devices with a maximum load of 5 amps up to a range of 10 meters. The microcontroller is programmed using Keil uVision and Pro51 programmer software.
One of the leading branches of engineering, Instrumentation engineering deals in mechanics and operation of measuring instruments. This type of engineering has a major role in the industries which have automated processes. For example, chemical and manufacturing industries. The role of engineers in this field is to ensure stability, reliability, safety, and enhanced productivity.
Instrumentation engineering covers various topics and subjects from other branches of engineering, which makes it a different course in the field of engineering. Students who prefer to study diverse subjects should opt for this branch of engineering. Ekeeda offers Online Instrumentation Engineering Courses for all the Subjects as per the Syllabus.
Wireless ai based intelli industrial security robot 2 pptVarun B P
This document describes a wireless industrial security robot project. The robot is designed to detect dangerous events like fires, gas leaks, or high temperatures using sensors. It can provide live video streaming to a remote monitor. The robot uses a microcontroller, motors, sensors and a mechanical arm. It aims to save manpower and improve safety by allowing work in hazardous environments. When issues are detected, it can send alert messages via GSM. The robot is expected to measure environmental data, detect obstacles, and change speed based on sensor readings.
This document provides information about servicing the overhead console in a Dakota vehicle. It describes components like the compass, thermometer, reading lamps, and storage compartments. The summary is:
The document outlines diagnosis and service procedures for the overhead console in a Dakota, including how to test the compass and thermometer, demagnetize the vehicle roof if needed, and remove/replace various components like the console, modules, bezels, storage doors, bins, and dampers. General information is provided on the compass, thermometer, lamps, and storage features, along with diagnostic tests and troubleshooting steps.
Small, widely available and dirt-cheap ultrasonic sensors enable us to design both simple and lavish measuring devices for all kinds of ranging. Take one of these modules, add a display, a couple of press-buttons and a micro-controller loaded with software, and you now have all the ingredients for a circuit of this kind.
The document provides an introduction to marketing concepts. It defines marketing and discusses key aspects of the marketing process including marketing strategy, planning, implementation, monitoring and analysis. The marketing strategy section covers developing strategic plans, conducting SWOT and portfolio analyses to evaluate strengths, weaknesses, opportunities and threats. Different marketing orientations such as production, product and marketing concepts are also outlined.
يقوم كلا منا بالإستعداد وتجهيز و تسخير كل ما يملك لخوض إمتحانات حياته الهامة
قد سخّر الله كل ما قد نحتاجه لتجاوز إمتحان الحياة الدنيا و العبور به إلى الجنة
دعنا نراجع هذا معا
This document provides an overview of Microsoft PowerPoint and instructions for using its features.
It introduces PowerPoint as a presentation program for developing slide-based presentations. It then covers designing presentations by changing themes, colors, and backgrounds.
The document explains how to customize the slide master for consistent formatting across slides. It also provides directions for creating individual slides, including selecting layouts, adding and formatting text and pictures, reusing slides, and setting transition effects. Finally, it mentions printing options.
The document provides details on method development for chromatography. It discusses defining key terms, developing a test method plan, optimizing methods through experimental design techniques like factorial design. The method development process involves studying samples, setting goals, reviewing literature, selecting an approach, optimizing parameters, and finalizing the method. Critical parameters like column length and temperature, flow rate, mobile phase composition are identified for optimization. Formal validation is required once the method is developed.
This document is too short to summarize meaningfully in 3 sentences or less. It only contains the word "Gam" which provides no context or identifiable information that could be condensed into a high-level summary.
It is a multi-element analysis technique where The ICP source converts the atoms of the elements in the sample to ions. These ions are then separated and detected by the mass spectrometer
This document provides an overview of the key components of a high-performance liquid chromatography (HPLC) system, including the pump, solvent rack, autosampler, column, column compartment, and detector. It discusses the different types of pumps (isocratic, gradient, dual gradient), solvent racks, autosamplers (split loop, pulled loop), and columns. It also provides details on the configuration options and specifications for these various components. The goal is to help users select the appropriate components for their HPLC system based on their application needs.
This document discusses and compares inductively coupled plasma atomic emission spectroscopy (ICP-AES) and atomic absorption spectroscopy (AAS). It outlines the fundamental parts and techniques of each method including sample introduction, atomization, and detection. Key differences are described such as ICP-AES being able to analyze multiple elements simultaneously while AAS is single-element. The document also compares factors such as detection limits, linear ranges, analysis speeds, costs, ease of use, interferences, and applications.
Direct Mercury Analyzer for analysis of liquid, solid and gaseous samples
DMA which uses the principle of thermal decomposition, amalgamation and atomic absorption.
The DMA-80 can analyze solid, liquid and gas matrices with equal precision.
All mercury is released from the sample through thermal decomposition.
This eliminates the need for any sample preparation.
This document provides an overview of the Qtegra Intelligent Scientific Data Solution (ISDS) software. It describes the various components and features of the software, including:
- The Configurator tool allows administrators to control user access and permissions, configure instrument settings and experiments, create report templates, and view log files.
- The Qtegra user interface includes pages for dashboards, lab books, templates, queries, file management, and help. Templates are used to define analytical methods and workflows for sample measurement.
- Method parameters in templates control analytes, acquisition settings, standards, quantification methods, and more. Templates standardize the measurement process.
- Lab books contain the results of
1. The document discusses UV-visible spectroscopy, describing the basic components and functioning of a UV-visible spectrophotometer.
2. Key aspects covered include the electromagnetic spectrum, sample cuvettes, light sources, monochromators, detectors, and performance verification tests to ensure the instrument is functioning properly.
3. UV-visible spectroscopy is a technique used to study light absorption by molecules to determine concentration and identify substances.
The document discusses instrumentation and methods for gas analysis using Fourier transform infrared (FTIR) spectroscopy. It describes the key components of an FTIR gas analysis system including the FTIR spectrometer, gas cell, temperature control, flow control, pressure control, vacuum pump, and gas diluter. It also discusses sampling tools, gas standards, quantitative analysis methods, and the general steps for running an FTIR gas analysis which includes pretest preparations, connecting the sampling loop, preparing the FTIR, and running the analysis.
The TQA software offers a complete selection of qualitative and quantitative analytical techniques for FTIR.
It contains all of the algorithms that are typically used for calculating component concentrations and classifying spectra based on a set of standards
The document discusses Chromeleon, a chromatography data system. It describes the main Chromeleon software components, including the instrument controller service, client, services manager, instrument configuration manager, and administration console. It also covers the Chromeleon client, which contains the Chromeleon console and chromatography studio. The simple steps of an analysis using Chromeleon are outlined as starting Chromeleon, starting the instrument, creating a sequence, acquiring data, processing data, and reviewing/reporting results.
The analyst is required to analyze a number of QC samples throughout the run where there are decisions to be made based on a window of acceptance for each QC sample analyzed.
Organic Elemental Analyzer “OEA” is a simultaneous
technique to determination of :-
Carbon,
Hydrogen,
Nitrogen,
Sulfur.
contained in organic and inorganic materials.
in solid, liquid, and gas forms.
This document provides information on classifying and labeling hazardous materials. It discusses the health effects of chemicals on humans and how they can enter the body. It describes common symptoms of chemical exposure and classifications of hazardous materials including explosives, flammable substances, toxic substances, corrosives, irritants, sensitizers, carcinogens, and substances dangerous to the environment. The document also covers labeling requirements, the Hazardous Materials Identification System (HMIS), and references several standards for hazardous materials classifications.
Temple of Asclepius in Thrace. Excavation resultsKrassimira Luka
The temple and the sanctuary around were dedicated to Asklepios Zmidrenus. This name has been known since 1875 when an inscription dedicated to him was discovered in Rome. The inscription is dated in 227 AD and was left by soldiers originating from the city of Philippopolis (modern Plovdiv).
ISO/IEC 27001, ISO/IEC 42001, and GDPR: Best Practices for Implementation and...PECB
Denis is a dynamic and results-driven Chief Information Officer (CIO) with a distinguished career spanning information systems analysis and technical project management. With a proven track record of spearheading the design and delivery of cutting-edge Information Management solutions, he has consistently elevated business operations, streamlined reporting functions, and maximized process efficiency.
Certified as an ISO/IEC 27001: Information Security Management Systems (ISMS) Lead Implementer, Data Protection Officer, and Cyber Risks Analyst, Denis brings a heightened focus on data security, privacy, and cyber resilience to every endeavor.
His expertise extends across a diverse spectrum of reporting, database, and web development applications, underpinned by an exceptional grasp of data storage and virtualization technologies. His proficiency in application testing, database administration, and data cleansing ensures seamless execution of complex projects.
What sets Denis apart is his comprehensive understanding of Business and Systems Analysis technologies, honed through involvement in all phases of the Software Development Lifecycle (SDLC). From meticulous requirements gathering to precise analysis, innovative design, rigorous development, thorough testing, and successful implementation, he has consistently delivered exceptional results.
Throughout his career, he has taken on multifaceted roles, from leading technical project management teams to owning solutions that drive operational excellence. His conscientious and proactive approach is unwavering, whether he is working independently or collaboratively within a team. His ability to connect with colleagues on a personal level underscores his commitment to fostering a harmonious and productive workplace environment.
Date: May 29, 2024
Tags: Information Security, ISO/IEC 27001, ISO/IEC 42001, Artificial Intelligence, GDPR
-------------------------------------------------------------------------------
Find out more about ISO training and certification services
Training: ISO/IEC 27001 Information Security Management System - EN | PECB
ISO/IEC 42001 Artificial Intelligence Management System - EN | PECB
General Data Protection Regulation (GDPR) - Training Courses - EN | PECB
Webinars: https://pecb.com/webinars
Article: https://pecb.com/article
-------------------------------------------------------------------------------
For more information about PECB:
Website: https://pecb.com/
LinkedIn: https://www.linkedin.com/company/pecb/
Facebook: https://www.facebook.com/PECBInternational/
Slideshare: http://www.slideshare.net/PECBCERTIFICATION
How to Setup Warehouse & Location in Odoo 17 InventoryCeline George
In this slide, we'll explore how to set up warehouses and locations in Odoo 17 Inventory. This will help us manage our stock effectively, track inventory levels, and streamline warehouse operations.
LAND USE LAND COVER AND NDVI OF MIRZAPUR DISTRICT, UPRAHUL
This Dissertation explores the particular circumstances of Mirzapur, a region located in the
core of India. Mirzapur, with its varied terrains and abundant biodiversity, offers an optimal
environment for investigating the changes in vegetation cover dynamics. Our study utilizes
advanced technologies such as GIS (Geographic Information Systems) and Remote sensing to
analyze the transformations that have taken place over the course of a decade.
The complex relationship between human activities and the environment has been the focus
of extensive research and worry. As the global community grapples with swift urbanization,
population expansion, and economic progress, the effects on natural ecosystems are becoming
more evident. A crucial element of this impact is the alteration of vegetation cover, which plays a
significant role in maintaining the ecological equilibrium of our planet.Land serves as the foundation for all human activities and provides the necessary materials for
these activities. As the most crucial natural resource, its utilization by humans results in different
'Land uses,' which are determined by both human activities and the physical characteristics of the
land.
The utilization of land is impacted by human needs and environmental factors. In countries
like India, rapid population growth and the emphasis on extensive resource exploitation can lead
to significant land degradation, adversely affecting the region's land cover.
Therefore, human intervention has significantly influenced land use patterns over many
centuries, evolving its structure over time and space. In the present era, these changes have
accelerated due to factors such as agriculture and urbanization. Information regarding land use and
cover is essential for various planning and management tasks related to the Earth's surface,
providing crucial environmental data for scientific, resource management, policy purposes, and
diverse human activities.
Accurate understanding of land use and cover is imperative for the development planning
of any area. Consequently, a wide range of professionals, including earth system scientists, land
and water managers, and urban planners, are interested in obtaining data on land use and cover
changes, conversion trends, and other related patterns. The spatial dimensions of land use and
cover support policymakers and scientists in making well-informed decisions, as alterations in
these patterns indicate shifts in economic and social conditions. Monitoring such changes with the
help of Advanced technologies like Remote Sensing and Geographic Information Systems is
crucial for coordinated efforts across different administrative levels. Advanced technologies like
Remote Sensing and Geographic Information Systems
9
Changes in vegetation cover refer to variations in the distribution, composition, and overall
structure of plant communities across different temporal and spatial scales. These changes can
occur natural.
हिंदी वर्णमाला पीपीटी, hindi alphabet PPT presentation, hindi varnamala PPT, Hindi Varnamala pdf, हिंदी स्वर, हिंदी व्यंजन, sikhiye hindi varnmala, dr. mulla adam ali, hindi language and literature, hindi alphabet with drawing, hindi alphabet pdf, hindi varnamala for childrens, hindi language, hindi varnamala practice for kids, https://www.drmullaadamali.com
Strategies for Effective Upskilling is a presentation by Chinwendu Peace in a Your Skill Boost Masterclass organisation by the Excellence Foundation for South Sudan on 08th and 09th June 2024 from 1 PM to 3 PM on each day.
5. Gamal A. Hamid
1) Source (ETC EverGlo)
2) Laser (for internal calibration)
3) Interferometer
A. beam splitter semi-reflecting
B. fixed mirror
C. moving mirror
4) Detector (DTGS Deuterium tri glycine sulphate)
5
6. Gamal A. Hamid
Electronically Temperature Controlled (ETC) EverGlo
The ETC EverGlo source is an efficient ceramic, refractory
composite that rapidly rises to operating temperature and is
also thermally insulated to maintain a constant operating
temperature.
provide energy for the spectral region from 7400 – 50 cm-1.
the source temperature is constantly monitored and
controlled at 1140°C by the ETC.
The temperature of the source is dropped to 900°C if the
spectrometer has been inactive for a period of time
6
7. Gamal A. Hamid
A Helium–neon laser or HeNe laser, is a type
of gas laser whose gain medium consists of a
mixture of helium and neon(10:1) inside of a
small bore capillary tube, usually excited by a DC
electrical discharge.
Laser create the drive volt for the moving mirror.
The He-Ne laser is used as an internal reference
7
8. Gamal A. Hamid
The interferometer produces a unique type of signal which has all of the
infrared frequencies “encoded” into it.
The signal can be measured very quickly, usually on the order of one second
or so. Thus, the time element per sample is reduced to a matter of a few
seconds rather than several minutes.
It contain:-
1. fixed mirror.
2. Moving mirror.
3. beam splitter.
8
9. Gamal A. Hamid
Consists of a perpendicular mirrors with a beam
splitter between them. When one of the two
mirrors is translated, all optical frequencies are
converted into cosine waves of intensity; the result
is the complex time variation of intensity called the
interferogram.
An interferogram is the sum of all cosine waves for
all optical frequencies. The spectrum is calculated
from the interferogram by computing its cosine
Fourier transform. This in effect, decodes the
individual frequencies in the spectral analysis.
9
10. Gamal A. Hamid
Most interferometers employ a beamsplitter which takes the
incoming infrared beam and divides it into two optical beams.
One beam reflects off of a flat mirror which is fixed in place.
The other beam reflects off of a flat mirror which is on a
mechanism which allows this mirror to move a very short
distance (typically a few millimeters) away from the
beamsplitter.
The two beams reflect off of their respective mirrors and
are recombined when they meet back at the beamsplitter.
10
11. Gamal A. Hamid
the path that one beam travels is a fixed length and the other is constantly
changing as its mirror moves, the signal which exits the interferometer is the
result of these two beams “interfering” with each other.
The resulting signal is called an interferogram which has the unique property
that every data point (a function of the moving mirror position) which makes
up the signal has information about every infrared frequency which comes
from the source.
the measured interferogram signal can not be interpreted directly.
A means of “decoding” the individual frequencies is required. This can be
accomplished via a well-known mathematical technique called the Fourier
transformation.
11
12. Gamal A. Hamid
FT-IR spectrometers use either
1. Pyroelectric ( thermal detectors ) DTGS.
2. Photoconductive detectors. (quantum detector) MCT.
Pyroelectric detectors a thin, Pyroelectric crystals such as deuterated triglycine sulfate
(DTGS) or LITA (lithium tantalate), When a pyroelectric material is polarized by an
electric field, it remains polarized after the field is removed due to an effect called
residual electric polarization. This residual polarization is sensitive to changes in
temperature.
Photoconductive detectors show an increase in electrical conductivity when
illuminated with IR radiation, They have a rapid response and high sensitivity. The most
commonly used photoconductive detector is the MCT (Mercury Cadmium Telluride),
which must be cooled to liquid nitrogen temperatures for proper operation.
12
13. Gamal A. Hamid
1. The Source: Infrared energy is emitted from a source.
2. The Interferometer: The beam enters the interferometer where the “spectral
encoding” takes place”.
The resulting interferogram signal then exits the interferometer to the sample.
3. The Sample: The beam is transmitted through or reflected off of the surface of the
sample, where specific frequencies of energy, which are uniquely characteristic of
the sample bonds are absorbed, the rest go to the detector.
4. The Detector: The beam finally passes to the detector for final measurement
5. The Computer: The measured signal is digitized and sent to the computer where
the Fourier transformation takes place.
13
16. Gamal A. Hamid
Open OMNIC
Double-click the OMNIC program icon on
your computer desktop.
16
17. Gamal A. Hamid
I. Menu bar.
II. Tools bar.
III. Pane “Spectrum window.
IV. Palette.
V. View finder.
VI. Bench status indicator.
VII. Information button.
17
19. Gamal A. Hamid
The Edit menu allows you to enable, disable, hide, add, delete and
modify items in the menus.
The menu bar contains the OMNIC menu names. The menus are
arranged in an order that is convenient for collecting and processing
data.
Within each menu, the commands are grouped according to their
related functions.
19
20. Gamal A. Hamid
Options to customize OMNIC for the way you
prefer to use the software. You can set options that
affect how spectra are collected, displayed,
processed, saved and printed.
The Edit Menu command allows you to customize
the contents of the OMNIC menus for the way each
person prefers to use the software.
You can disable, but not hide.
You can hide all of the menus by turning on Hide All
OMNIC Menus in the Edit Toolbar dialog box.
Edit Toolbar lets you create custom toolbars
containing buttons for quickly initiating commands.
20
21. Gamal A. Hamid
Experiment setup
Collect sample
Collect background
All of above commands will discuss later in
details in the toolbar section.
21
22. Gamal A. Hamid
Display Setup to specify how spectra are to be displayed in pane
Stacking spectra is useful when you are comparing spectra that
are significantly different.
Hide Spectra to hide the selected spectra from view.
Full Scale to adjust the vertical scale of the spectra .
Common Scale to display all the spectra using the same Y-axis
Match Scale ,All the spectra in the window are displayed using
the Y-axis limits of the selected spectrum.
Offset Scale to display the spectra vertically offset from each
other, Separating the spectra.
Display Limits to specify the X-axis and Y-axis display limits.
Automatic Full Scale automatically displays the spectra full.
Roll/Zoom lets you access a set of symbols that you can use to
adjust the display of spectra.
Toolbar , select or deselect the appearance of it.
22
23. Gamal A. Hamid
The System Suitability features, let you
check the suitability of your
spectrometer for use in your particular
application.
The tests can be performed with your
sample or automatically using a
validation wheel, if installed.
Run the test, get the report including
FAILED, or PASSED.
23
24. Gamal A. Hamid
All the spectrum related commands.
Final Format parameter determines the units used
for the collected data. A, T, or others.
Correction parameter to select the type of
correction to use when collected spectra are
processed.
Subtract and remove parameters for spectrum or
a part of it.
smoothing and drawing parameters
24
25. Gamal A. Hamid
Transmittance IR energy transmitted through the sample.
%T = (S/B)*100 where S is IR intensity
B is IR intensity without a sample in place (background).
Absorbance at a frequency is defined by the equation
A = log(100/%T)
Reprocess to transform the interferogram data for the
selected spectra using different transformation parameter
settings or ratio the spectra against a different background
to improve the final data.
Retrieve Interferogram to display the interferogram for the
selected spectrum in the active spectral window.
25
26. Gamal A. Hamid
Baseline Correct to correct a sloping, curving, shifted or
otherwise undesirable baseline of a spectrum so that the
baseline appears flat and near zero absorbance.
Automatic Baseline Correct lets you automatically correct
the baseline of the selected spectra.
Advanced ATR Correction to correct (ATR) spectra for the
shifting of infrared absorption bands and the effects of
variation in depth of penetration.
PAS Linearize lets you correct photoacoustic data to
enhance the infrared signal at the sample surface or
improve quantitative linearity.
Interactive Kramers-Kronig to convert a specular
reflection (SR) spectrum to a transmission.
26
27. Gamal A. Hamid
Blank to delete the data points in the selected
spectral region.
Straight Line lets you replace the selected region
of the selected spectra with data points that form
a straight line.
Subtract whenever you want to subtract one
spectrum from another.
Automatic Region Subtract to let you quickly
subtract from a mixture or sample spectrum the
spectral data due to a particular component or
contaminant.
27
28. Gamal A. Hamid
Fourier Self-Deconvolution to reveal overlapping
spectral features that cannot be resolved by
collecting data at a higher resolution setting.
Smooth to improve the appearance of the
selected spectra by preferentially smoothing the
high-frequency component of the spectral data.
Derivative to convert the selected spectra to their
first or second derivatives.
Multiply to multiply each data point in a spectrum
by a number of your choice.
Spectral Math to perform arithmetic operations
on one or two selected spectra.
28
29. Gamal A. Hamid
Find Peaks to identify peak locations in a
spectrum.
Send To OMNIC Specta If you have installed
OMNIC SpectaTM software, you can export the
selected spectra to that program. The spectra
are added to the data tray.
Average to find the average Y value of the data
points in the selected spectral region .
Statistical Spectra lets you perform statistical
calculations on two or more selected spectra.
29
30. Gamal A. Hamid
Library Setup to specify how to perform a spectral search of one or more search
libraries to identify an unknown spectrum, or a QC comparison of one or more QC
libraries to verify the composition of a sample.
To add and remove libraries.
IR Spectral Interpretation to help you determine which chemical functional groups
may be present in an FT-IR spectrum.
Library Manager gives you the ability to view the spectra and related information
contained in commercial and user libraries of spectra.
QCheck Before comparing spectra with in the Analyze menu, use QCheck Setup in
the Analyze menu to set up the comparison.
30
31. Gamal A. Hamid
The noise level of a spectrum depends on many factors, including
the hardware being used, the experiment parameter settings and
the physical surroundings of the system.
Use Noise in the Analyze menu to measure the noise in the
selected spectral region of a spectrum, Both peak-to-peak and root
mean square (rms) noise are measured.
Peak-to-peak noise
is the difference between the highest and lowest noise peaks in the
selected spectral region.
RMS (root mean square) noise
A measure of the statistical analysis of the noise variation in a
spectral region.
31
32. Gamal A. Hamid
Template, to select , edit or create a
report template.
Preview/Print Report to view a report as it
would appear on paper and print it.
New Notebook to create a new report
notebook to which you can add reports.
Auto Report Options to specify headers
and footers that will appear on each page
of any reports you display or print using
Preview/Print Auto Report in the Report
menu.
32
37. Gamal A. Hamid
How many Scans are performed during a sample or
background data collection.
Increasing the number of scans reduces the noise level
of the data (increases the signal-to-noise ratio) and
increases the sensitivity .
The smaller the Resolution value, the higher (better) is
the resolution
Typically resolutions of 8 or 4 wavenumbers are used
for solid and liquid samples. Gas samples normally
require a resolution of 2 wavenumbers or better (lower
setting of Resolution).
37
38. Gamal A. Hamid
Acquire a Background Scan
Before a sample can be acquired,
a background scan must be
obtained. Water vapor and carbon
dioxide in the air will produce
interfering bands which must be
subtracted from the spectrum.
Select Collect – Collect
Background. The instrument will
begin collecting a background
spectrum.
38
39. Gamal A. Hamid
Spectral Range
(wavenumbers)
Interference
5580-5500 NIR range, water vapor
3950-3500 Water vapor
2400-2270 Carbon dioxide
2670-1800 Diamond bands (diamond ATR)
2000-1290 Water vapor
700-400 Carbon dioxide
39
40. Gamal A. Hamid
Once you have a background prepared,
Select Collect – Collect Sample from
the menu above,
The instrument will ask for a spectrum
title.
Name the sample, Click OK and the
instrument will begin collecting a
spectrum in scout scan mode.
40
41. Gamal A. Hamid
Detector Type of detector used.
Beamsplitter Type of beamsplitter used.
Source Type of source used.
Gain Gain used to amplify the
detector signal.
Optical
Velocity
A value that is twice the
velocity of the moving mirror.
Aperture Relative size of the aperture
expressed as a percent of
maximum area.
41
42. Gamal A. Hamid
Detector Pyroelectric ( thermal detectors ) DTGS
Beamsplitter K Br beamsplitter
Source IR source
Gain 1, 2, 4, 8, Auto gain. for ATR and diffuse reflection typically use a Gain
setting of 2 or 4. OMNIC automatically adjust the gain to maximize the signal
by setting Gain to Autogain
Optical Velocity Using a faster velocity lets you collect more scans in a given amount of time,
The stronger signal obtained at the slower velocity,
Aperture The larger the aperture, the better is the signal to noise ratio of the collected
data. The smaller the aperture, the better the stability and accuracy will be.
Small apertures are needed for high-resolution experiments
42
43. Gamal A. Hamid
OMNIC offers four categories of
spectral quality checks:
Spectrum checks
Parameter checks
Background checks
Interferogram checks
43
44. Gamal A. Hamid
The Advanced tab in the
Experiment Setup dialog box
contains parameters drawing
the spectrum.
Automatic Blanking Of
Regions box specifies spectral
regions to be blanked so that
they contain no data points in
the collected spectrum.
44
45. Gamal A. Hamid
Note: The availability of the indicators depends
on the spectrometer model you have.
Power supply
HeNe laser
Light source
Electronics
Beamsplitter and detector
Align
45
46. Gamal A. Hamid
It is also a good idea to align the interferometer if the
signal intensity has dropped significantly from its usual
level.
The spectrometer power should be on for at least 15
minutes (1 hour or longer for best results) before you
perform an alignment.
Set Gain to 1 before clicking the Align button.
Remove any accessories or samples from the sample
compartment before aligning the spectrometer.
46
47. Gamal A. Hamid
You can use the Source
Rest Mode features to
extend the life of the
infrared source.
(A white light source
cannot be placed into Rest
mode.)
The table below describes
what Rest mode does
when you are not using
the source.
47
48. Gamal A. Hamid
You can configure the system for the
hardware you are using or perform
other tasks described below by
clicking the Configure Bench button.
You must configure the system after
you install:-
Source
Beamsplitter
Detector
48
49. Gamal A. Hamid
Stack spectra
Full scale
Common scale
Automatic baseline correction
Advances ATR
49
Subtract spectrum
Find peaks
Select all
clear
50. Gamal A. Hamid
Add to library
Library setup
Search
QC compare
Library manager
50
51. Gamal A. Hamid
Template
Preview / print report
View notebook
Add to notebook
Preview / print auto report
Auto report options
51
53. Gamal A. Hamid
A pane is an area of the spectral window
used to display a spectrum along with
associated information and software
features.
A spectral window can contain one or
several panes, as specified by Display Setup
and the Window options (available through
Options in the Edit menu).
You can display spectra in overlaid or
stacked panes, depending on how you
want to view the data.
53
54. Gamal A. Hamid
Four regions of Chart
3700 – 2500 cm-1 Single bonds to hydrogen
2300 – 2000 cm-1 Triple bonds
1900 - 1500 cm-1 Double bonds
1400 - 650 cm-1 Single bonds (other than hydrogen)
Fingerprint region
1- The region to the right-hand side of the diagram (from about 1650 to 500 cm-1)
2- Usually contains a very complicated series of absorptions
3- Contains peaks due to bending vibrations
4- It is rarely possible to assign a specific peak to a specific group.
54
55. Gamal A. Hamid
The Palette of the spectral window contain six tools to
performing some operation on the spectrum.
The names and appearances of the palette indicates
their functions
55
57. Gamal A. Hamid
The view finder lets you adjust the display of all the spectra in a spectral
window or task window to show a larger or smaller spectral region or a
different region of the same size.
You can also adjust the vertical scale of the selected spectra.
If more than one spectrum is selected in a spectral window, an image of the
first spectrum selected appears in the view finder.
If no spectrum is selected, the view finder is empty.
The currently displayed spectral region is indicated by the region markers, the
blue vertical lines within the view finder.
57
58. Gamal A. Hamid
Expand the spectra horizontally about the center.
Contract the spectra horizontally about the center.
To roll the spectra to right.
To roll the spectrum to lift.
Expand the spectra vertically .
To contract the spectra vertically.
58
59. Gamal A. Hamid
If the spectrometer has passed all of its tests, the System Status indicator
shows a green check mark.
If the System Status indicator shows a yellow icon containing an
exclamation mark, a cooled detector has become warm or data cannot be
collected because the printer port is being used to print information (on
some systems).
If the System Status indicator shows red "X," the spectrometer has failed
a test and requires corrective action or the computer cannot
communicate with the spectrometer.
For help with solving the problem, click the indicator, click Instrument
Status in the System Status Overview dialog box and click the Explain
Error button.
59
60. Gamal A. Hamid
COLLECTION , PROCESSING INFORMATION
Title ,Collected time, Accessory,
Correction parameters.
DATA COLLECTION INFORMATION
Number of sample scans: 128
Collection length: 152.2 sec
Resolution: 4.000
Number of background scans: 128
Background gain: 8.0
DATA DESCRIPTION
SPECTROMETER DESCRIPTION
Spectrometer, Source: IR
Detector: DTGS KBr
Smart Accessory ID: Unknown
Beamsplitter: KBr
Optical velocity: 0.6329
Aperture: 100.00
60
62. Gamal A. Hamid
Turn on the spectrometer, the system status and system scan
LEDs next to the power switch flash in various sequences as the
system performs its diagnostic routines.
When the routines are finished, the system status LED stops
flashing and remains lit.
The system scan LED will intermittently blink, indicating that the
interferometer is scanning and working properly.
If the system status LED continues to flash or does not light at all,
turn the spectrometer power off and then back on.
If this does not resolve the problem, see Troubleshooting for
possible causes and solutions.
62
63. Gamal A. Hamid
Turn on the computer. The spectrometer should be on the entire time line
Launch OMNIC on the desktop.
Make sure the bench Status is √ on the top right corner of the window.
Make sure that there isn’t anything left on the crystal.
Click on Col Bkg to take a background of air. When the confirmation window
pops up, click YES.
When the confirmation window pops up to ask to add Window 1, click NO.
Place your sample on the crystal- Liquids -place a drop of sample on the
crystal with a medicine dropper. Solids – place a small neat sample on the
crystal with a spatula.
Dial the knob of the ATR until the pressure .
63
64. Gamal A. Hamid
Click on Col sample, Collect Sample Window pops up, type in “sample name” and
enter, confirmation window pops up, click YES.
When the confirmation window pops up to add Window 1, click YES.
To have peaks labeled, Click Find Pks. Adjust the threshold by clicking on the window
with the left mouse button. When peaks are selected, Click on “Replace”.
If for some reason some of the peaks are not labeled, extra peaks can be manually
labeled by clicking on the “T” on the bottom left corner.
Use the “Text” too to select and or write a label or description.
If satisfied with the information on the computer displaced spectrum, then can be
printed by clicking on Print icon and then print again in the print window.
64
66. Gamal A. Hamid
FTIR spectra reveal the composition of solids, liquids, and gases. The most common use
is in the identification of unknown materials and confirmation of production materials -
The areas where FTIR is applicable are listed below:
Environmental
Forensic
pharmaceutical
Polymer
Quality
Others
66
67. Gamal A. Hamid
Infrared spectroscopy is a valuable technique for
monitoring :-
Air quality,
Testing water quality,
Analyzing soil
to address environmental and health concerns
caused by increasing pollution levels.
67
68. Gamal A. Hamid
FTIR, FT-Raman, GC-IR, and IR microscopy techniques
build a complete understanding of evidence samples
and allow forensic scientists to confidently give expert
testimony in court. These techniques can provide fast,
easy and consistent analysis for:
Seized drugs: controlled substances and cutting agents
Clandestine labs: chemical evaluation
Hit and run: paint and materials
Textile identification: fibers, coatings, and residues
68
69. Gamal A. Hamid
FTIR is an excellent technique for pharmaceutical
analysis because it is easy to use, sensitive, fast, and
helps ensure regulatory compliance through
validation protocols. Applications include:
Basic drug research and structural elucidation
Formulation development and validation
Quality control processes for incoming and
outgoing materials
Packaging testing
69
70. Gamal A. Hamid
FTIR spectroscopy is used to quickly and definitively identify
compounds such as compounded plastics, blends, fillers,
paints, rubbers, coatings, resins, and adhesives.
Key areas where infrared analysis adds value include:
Material identification and verification
Copolymer and blend assessment
Additive identification and quantification
Contaminant identification - bulk and surface
Molecular degradation assessment.
70
71. Gamal A. Hamid
Infrared spectroscopy is an ideal analytical tool
for both routine quality control (QC) analysis to
verify if materials meet specification, and
analytical investigations to identify the causes of
failures when they occur.
FTIR instrumentation can be located in the
analytical laboratory or near the production
line. With its low cost, speed, and ease of
analysis,
FTIR is a method of choice for many industrial
applications.
71