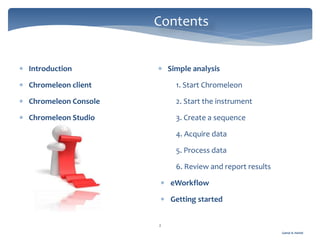
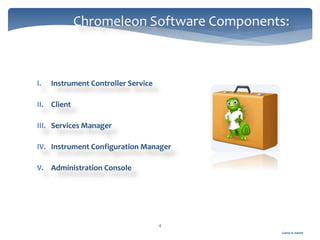
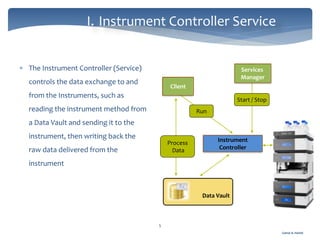
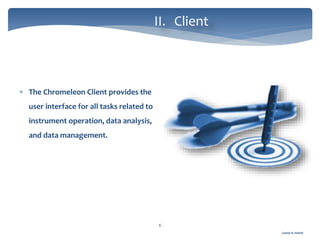
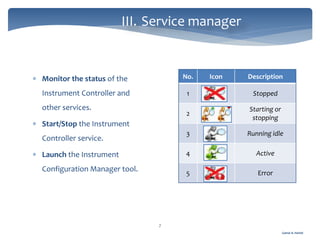
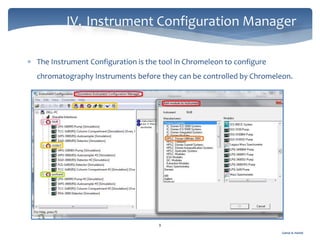
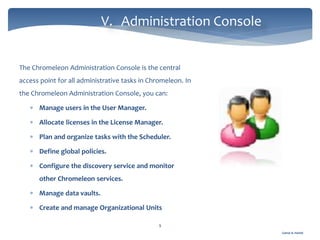
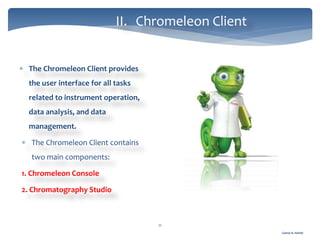
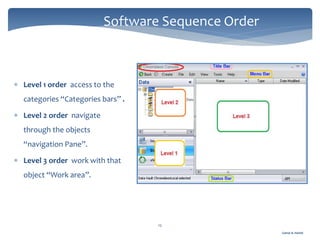
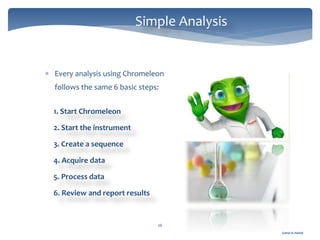
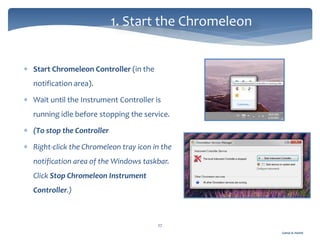
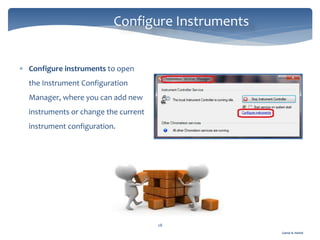
The document discusses Chromeleon, a chromatography data system. It describes the main Chromeleon software components, including the instrument controller service, client, services manager, instrument configuration manager, and administration console. It also covers the Chromeleon client, which contains the Chromeleon console and chromatography studio. The simple steps of an analysis using Chromeleon are outlined as starting Chromeleon, starting the instrument, creating a sequence, acquiring data, processing data, and reviewing/reporting results.
Chromeleon CDS software now supports mass spectrometry (MS) instrument control and data processing, allowing laboratories to integrate MS into their chromatography data system (CDS) workflow. Key features include native MS instrument drivers for remote control and monitoring, MS-specific data organization and visualization tools, a suite of MS data processing tools including extracted ion chromatogram creation and library searching, and reporting objects tailored for MS data. The integrated CDS approach provides advantages like single software validation, enhanced data security, and use of Chromeleon's compliance and data processing features for MS data.
This document provides an introduction and overview of gas chromatography (GC). It discusses the basic principles of GC, which involves separating components of a mixture based on how they partition between a stationary and mobile phase. The key components of a GC system are described, including the injector where samples are introduced, the column where separation occurs, the oven that controls temperature, and various detectors. Different types of columns, stationary phases, temperature programs, and detectors are discussed to provide flexibility in GC analysis for a wide range of applications.
Thin layer chromatography (TLC) is a technique used to separate components of a mixture using a thin stationary phase coated on an inert backing. TLC functions on the principle that compounds have different affinities for mobile and stationary phases, affecting their migration speed. Key steps are applying sample spots, developing the plate in a solvent, and visualizing spots. The retention factor (Rf) value characterizes a compound's polarity. TLC is a simple, fast, and inexpensive analytical method useful for reaction monitoring and purification.
Nilesh Dashrath Kamble presented a seminar on method development and validation in HPLC. The presentation discussed the steps involved in HPLC method development including column selection, mobile phase composition, pH range selection, and optimization of separation conditions. It also covered validation parameters such as accuracy, precision, specificity, limit of detection, and limit of quantification as per ICH guidelines. The presentation included an example method development for the simultaneous estimation of atorvastatin and telmisartan from a tablet formulation.
This document discusses analytical method validation. It provides definitions and guidelines for validating analytical methods from regulatory agencies. Key aspects of method validation discussed include accuracy, precision, specificity, range, linearity, limits of detection and quantification. Validation parameters are described for different types of analytical tests including identification, quantitative impurity tests and assays. Guidelines are provided for qualifying analytical instrumentation and categorizing instruments based on complexity.
This document provides instructions for operating a Shimadzu HPLC instrument and software. It details the instrument specifications, operation of components like the detector, pump, and column oven. It also describes how to set up the software, perform a system check, set method parameters, monitor the analysis, and integrate peaks from a chromatogram. The goal is to demonstrate basic HPLC operation and perform a single sample analysis.
The document discusses high pressure liquid chromatography (HPLC). It begins with contact information for the author and provides a brief history of chromatography, including early techniques like paper chromatography. It then defines HPLC as using high pressure to push a liquid mobile phase through a packed column for separation. Key advantages of HPLC are its sensitivity, reproducibility, and suitability for separating nonvolatile compounds. The summary concludes by noting that HPLC systems consist of pumps to deliver the mobile phase at high pressure through an injector, column, and detectors.
Steps to consider when developing analytical methods in your laboratory. Most important validation criteria to consider, including tips on how to remain relevant.
HPLC Method Development & Method Validation (mr.s)22suresh
This document describes the development and validation of an HPLC method for estimating drugs. It discusses the principles of HPLC, steps in method development including selecting the method, column, mobile phase and detector. Method validation parameters like accuracy, precision, specificity, linearity and robustness are also summarized. The document provides details on the optimization process and validation procedures to ensure the method is suitable for its intended use.
This presentation was made to solely for students to make them aware/ understand basics of “Analytical Method Validation”. These slides are part of lectures delivered in M. Pharmacy Curriculum & taken up from various books and websites
UPLC uses smaller particle sizes (<2 microns) than HPLC (3-5 microns) which allows it to operate at higher pressures and provide faster, more sensitive and selective separations compared to HPLC. Some key differences are that UPLC uses smaller diameter columns, achieves higher resolution and plate counts, reduces run times, solvent consumption and cost of operation compared to HPLC. However, the smaller particles used in UPLC columns have a narrower usable lifespan than HPLC columns.
The document discusses various chromatography techniques including: open-column chromatography, paper chromatography, thin-layer chromatography, gas chromatography, high-pressure liquid chromatography, supercritical fluid chromatography, and electrophoresis. It provides details on the basic principles, instrumentation, applications and limitations of each technique.
Stationary Phase and Mobile Phase Selection for Liquid Chromatography
The presentation focuses on how to choose the appropriate mode of separation, the correct column and highlights the importance of the correct mobile phase. This approach will be applied to a wide selection of compound types ranging from proteins, peptides, glycans to small pharmaceutical molecules and their metabolites. It will also look at specific application areas for monoclonal antibody analysis, namely: titer, aggregation, charge and oxidation variant. Platform methods for biologics characterization are also discussed.
Bioanalysis of drugs from biological samples involves three key steps: sample collection, sample preparation, and detection methods. Common biological samples include blood, plasma, serum, urine, and tissues. Sample preparation techniques aim to remove interfering matrix components, concentrate the analyte, and prepare the sample for detection. Common techniques include protein precipitation, liquid-liquid extraction, and solid phase extraction. The goal is to isolate and concentrate the drug or metabolite for accurate quantitative analysis.
The document discusses analytical method development for HPLC. It notes that method development requires selecting requirements, instrumentation type, and why. Existing methods may be unreliable, expensive, or time-consuming, necessitating new method development. Key steps in development include defining goals, establishing sample preparation, selecting detector and mode of separation, performing preliminary separations, optimizing conditions, and validating the method. Method development is informed by factors like number of analytes, sample matrix, and analyte properties.
Sample preparation is an essential part of HPLC analysis to provide a reproducible and homogenous solution suitable for injection onto the column. The goal of sample preparation is to remove interferences and ensure the sample is compatible with the HPLC method without damaging the column. Sample matrices can be organic or inorganic solids, semisolids, liquids or gases, with liquids being easiest to prepare. Solid and semisolid samples require reducing particle size through processes like blending or grinding. Filtration is also important to remove particles that could damage the column. Common pretreatment methods for liquid samples include liquid-liquid extraction and solid phase extraction, while newer techniques are used for solid samples like supercritical fluid extraction. Derivatization can improve
Okay, let me break this down step-by-step:
* We are given absorbance values for known concentrations of trimethoprim and quinine standards at two wavelengths
* Using Beer's law, we can calculate the molar absorptivities (ε) of each at each wavelength
* Then using the absorbance readings of the combined sample, and the ε values, we can calculate the concentrations of each in the sample
* From the concentrations and sample volume, the masses and thus amounts of each in the tablet can be determined
Does this help explain the approach? Let me know if you would like me to show the full working.
Use of control charts in laboratory as per ISO 17025:2017Rahul Gupta
This document discusses the use of control charts in laboratories to monitor testing processes and ensure validity of test results. It provides examples of different types of control charts, including mean charts, range charts, recovery control charts, and duplicate sample charts. Control charts can be used to detect changes in testing processes, monitor equipment performance, compare testing methods, and evaluate different analysts. Trend analysis of control charts allows labs to determine if a process is in or out of statistical control. Control charts are a powerful tool for internal quality control in testing laboratories.
Gas chromatography is a technique used to separate and analyze compounds that can be vaporized without decomposing. It works by carrying a gaseous or vaporized sample mixture through a column via an inert gas mobile phase. Components interact differently with the stationary phase coating the column and exit at different retention times, allowing separation. Common applications include analyzing purity, identifying unknown compounds, and preparing pure samples. Advantages include high sensitivity and resolution, while disadvantages include limited sample types and inability to recover individual components.
This document provides an overview of analytical method validation. It discusses key validation characteristics such as specificity, linearity, range, accuracy, precision, LOD and LOQ. Guidelines for validation from organizations like ICH, USP, ANVISA and AOAC are also mentioned. The document describes procedures for establishing various validation parameters and evaluating the results. It emphasizes that validation is necessary to ensure analytical methods consistently provide reliable results.
This document provides an overview of HPLC methodology and validation requirements. It discusses the key components of an HPLC test procedure including system suitability testing, relative response factors, and the validation parameters of specificity, linearity, accuracy, precision, LOD/LOQ, and robustness. Validation requirements depend on whether the method is compendial or non-compendial, with full validation needed for non-compendial methods. System suitability criteria and validation acceptance limits are outlined for various analytical techniques like assay, impurities testing, and dissolution.
Analytical method validation as per ich and usp shreyas B R
Analytical method validation is a process of documenting/ proving that an analytical method provides analytical data acceptable for the intended use.After the development of an analytical procedure, it is must important to assure that the procedure will consistently produce the intended a precise result with high degree of accuracy. The method should give a specific result that may not be affected by external matters. This creates a requirement to validate the analytical procedures. The validation procedures consists of some characteristics parameters that makes the method acceptable with addition of statistical tools.
Dynamic data processing tools to minimize time spent on chromatogram review and integration (Dynamic Data Linking, SmartLink, Cobra, SmartPeaks).
Learn more about our chromatography data system Chromeleon: http://www.thermoscientific.com/en/about-us/general-landing-page/chromeleon-resource-center.html?ca=chromeleon
Thermo Scientific Chromeleon 7 CDS can streamline an entire enterprise chromatography laboratory. It features a client-server architecture that allows for centralized management, data storage, and security across the network. During network failures, it ensures continued operation and data security using a local secure data vault. The system integrates a variety of tools for administration, licensing, scheduling, and user management. It also provides integration capabilities with third-party software like LIMS.
Showing universal instrument control and ways to increase instrument uptime by getting more “right first time” analyses (instrument control, eWorkflows™, Smart Startup, SST/IRC)
Learn more about our Chromatography Data System Chromeleon:
http://www.thermoscientific.com/en/about-us/general-landing-page/chromeleon-resource-center.html?ca=chromeleon
Introducing the principle of Operational Simplicity and how this is applied in the Chromeleon 7 user interface (Console/Studio, Categories, MiniPlots, Ribbons, Deleted Items)
Learn more about our chromatography data system: http://www.thermoscientific.com/en/about-us/general-landing-page/chromeleon-resource-center.html?ca=chromeleon
The document discusses handling out-of-specification (OOS) results in a quality control lab. It begins by summarizing a 1992 court case between Barr Laboratories and the FDA regarding OOS results. It then defines OOS results, unexpected results, and reportable values according to FDA guidelines. The document outlines when investigations of OOS results should be conducted and provides a flow chart depicting the investigation process. It also discusses retest sample size and the expectations of regulators regarding the handling and investigation of OOS results.
This document provides an overview of operations management concepts across multiple departments. It discusses key components like the basic philosophy to cut costs, improve quality, and improve productivity. It also outlines departments like engineering, quality, ERP systems, production planning, purchasing, and supply chain. Key terms are defined related to quality control, lean manufacturing, inventory management, outsourcing, project planning, and performance metrics.
The recent spike in solar cell failures experienced by TIR Solar Energy has been attributed to inconsistent titanium dioxide particles used in solar cell production. To institute proper quality controls of this material and to minimize further failures, the Quality Control department has proposed purchasing a Rigaku MiniFlex600 Benchtop XRD Instrument for just under $95,000. An X-ray diffractometer would allow them to characterize the crystal phase of the titanium dioxide nanoparticles, determining whether they have the desired anatase phase or the less effective rutile phase. This testing is needed to improve quality control over the production process and prevent further costly defects.
The Indian Cosmetics Industry is defined as skin care, hair care, color cosmetics, fragrances and oral care segments which stood at an estimated $2.5 billion in 2008 and is expected to grow at 7%, according to an analysis of the sector. Today herbal cosmetics industry is driving growth in the beauty business in India and is expected to grow at a rate of 7% as more people shun chemical products in favor of organic ones.
This document discusses process capability analysis and process analytical technology. It begins with an introduction to capability, including histograms and the normal distribution. It then covers capability indices like Cp, Cpk, Pp and Ppk and how to calculate sigma. It discusses using capability analysis with attribute data by calculating defects per million opportunities (DPMO). It concludes with a brief overview of process analytical technology (PAT).
The document provides guidelines for good chromatographic practices in HPLC. It discusses proper procedures for maintaining the mobile phase, stationary phase, solvent management system, and sample management system. Key points include using purified water and HPLC-grade solvents for the mobile phase, equilibrating columns before use, priming and purging the solvent lines, using appropriate needle wash and seal wash solutions, and filtering samples prior to injection. Frequent maintenance such as changing purge liquids and checking for leaks is also emphasized.
Este documento describe el limoneno, un compuesto químico encontrado en los aceites esenciales de cítricos. Existen dos isómeros del limoneno, (R)-limoneno y (S)-limoneno, que tienen olores distintivos de naranja y limón, respectivamente. El limoneno se extrae comúnmente de los cítricos mediante destilación por arrastre de vapor y tiene múltiples usos industriales y de la vida cotidiana.
The document discusses the cosmetics industry in India. It notes that the Indian cosmetics market is growing rapidly at around 20% annually and is projected to reach $3.5 billion by 2016. Major players in the Indian cosmetics market include Hindustan Unilever, Procter & Gamble, L'Oreal, Lakme, and Ponds. The document also provides details on the market shares and products of these leading brands. It states that the non-store retailing channel is increasing in India and companies are relying more on direct sales networks.
This document discusses guidelines for handling Out of Specification (OOS) test results in the pharmaceutical industry. It provides an overview of the history of OOS guidelines, including FDA audits in the 1980s-90s that identified issues like "testing until pass", which led the FDA to publish formal OOS guidelines in 2006. The document outlines the OOS investigation process, which should first thoroughly check for laboratory errors and assign a cause, then may proceed to extended investigations including retesting or plant investigations if no error is found. Tools like 5M analysis and the five whys technique can be used to identify and analyze the root cause.
1) The document discusses the cosmetic industry in India, providing background on major players in the Indian cosmetic market.
2) It outlines key companies like Lakme, Ponds, Procter & Gamble, L'Oreal, and Hindustan Unilever Ltd that dominate the industry.
3) The cosmetics industry in India has seen rapid growth in recent years and is expected to continue growing due to rising incomes and increased fashion awareness among Indian consumers.
This document discusses guidelines and best practices for handling out-of-specification (OOS) analytical results. It outlines procedures that regulatory agencies like the FDA recommend for investigating OOS results, including performing a preliminary assessment, full laboratory investigation, and documenting findings. The document emphasizes that OOS results should not be invalidated without a thorough investigation to identify the root cause and prevent future errors.
The document discusses various aspects of high performance liquid chromatography (HPLC), including the types of separations, columns and stationary phases, mobile phases, injection, and detection methods. It provides details on normal phase, reversed phase, adsorption, and size exclusion chromatography. The roles of the stationary phase, mobile phase, column, and detector are explained. Common detection techniques like UV-VIS, diode array detection, refractive index, and evaporative light scattering are outlined.
This document discusses quality control procedures for evaluating a project. It outlines several ways to assess quality, including submitting progress reports, conducting pre-and post-tests, providing a warranty, and acknowledging limitations. Quality control focuses on controlling elements of production, ensuring competence, and addressing soft elements like culture. It emphasizes testing products for defects and reporting issues to management.
The cosmetics industry in India is valued at $950 million and is growing at 15-20% annually. Color cosmetics, deodorants, and talcum powder are the largest segments by value, with color cosmetics being the fastest growing. Lakme is a leading cosmetics brand in India, operating 88 beauty salons across the country. The salons offer a variety of facial treatments and makeup services at price points from Rs. 275 to Rs. 9,350. Lakme leverages its partnership with Unilever for global expertise and technologies. The salons maintain high standards of cleanliness, hospitality, and beautician training to provide customers with a premium experience.
The document discusses quality control, quality assurance, and total quality management. It defines quality as meeting or exceeding customer expectations through consistent standards and processes. Quality control focuses on identifying defects during production, while quality assurance aims to prevent defects through upfront planning and audits. Both work together to deliver high quality outputs, increase efficiency, and ensure customer satisfaction. Total quality management requires company-wide commitment to quality through elements like training, teamwork, statistical methods, and customer service. It also discusses quality design, benchmarking, and factors important for quality in the construction industry.
This Arena tutorial aims to provide beginners with a guide to get started using Arena simulation software. It discusses installing Arena, describes the overall features and interface of Arena including the model window, modules, and project bar. It then provides a step-by-step example of building a simulation model of a single server queueing system, defining the necessary data and flowchart modules, setting the run conditions, running the simulation, and reviewing the output reports.
This document provides information about UV/VIS spectroscopy software. It discusses the various components and features of the software, including the main window, menus, toolbars, data store, status bar, and reporting capabilities. It also describes the different application modes like scan, fixed, quantitative, rate, MCA, and DNA analysis. Parameters for these applications and accessories like rapid mixing, stirrer, temperature control, cell changer, and sipper are outlined as well.
The document provides instructions for logging into the GigaSpaces cloud computing framework and demoing three applications - a data grid demo, trader stock desktop demo, and pet clinic demo. It describes accessing a trial account, logging in with GigaSpaces credentials, and launching the demo applications from the cloud console. Detailed steps are given for running benchmarks and tests for each demo to experience features like high availability and auto-scaling.
The document provides instructions for using a multifunction skin analysis system. It includes:
1. An overview of the instrument's characteristics such as its imaging system, hardware specifications, operating temperature and humidity ranges, and USB connectivity.
2. Steps for installing the analysis system software which includes running an installation file from the included CD and selecting an installation path.
3. A description of how to log in as a member, take and compare photos, and receive a professional analysis with recommendations.
4. Details on product management features for maintaining information on different brands and series that can be prescribed.
Automation and Robotics 20ME51I_Week_4_Practicals.pdfGandhibabu8
HMI systems allow humans to interact with machines through user-friendly interfaces. The document discusses several types of HMI interfaces including push-button, touchscreen, graphical user interfaces, mobile interfaces, web-based interfaces, augmented reality interfaces, and virtual reality interfaces. It also covers considerations for selecting an HMI such as functionality requirements, user experience, and environmental factors. Additionally, it provides specifications to evaluate like display, connectivity, processing power, software compatibility, and reliability. The document then describes how a PLC can be integrated with an HMI using a touchscreen to allow operators to monitor and control industrial processes visually.
This document provides an overview of a Flexible Manufacturing System (FMS) implemented in a mechanical engineering CAD/CAM laboratory. The FMS consists of multiple components including two 5-axis robots, conveyors, sensors, PLC devices, and computers. One robot picks and places parts based on barcode information while the other picks parts detected by a sensor and moves them to another area. PLCs control the motors, conveyors, sensors and other components. Computers program and monitor the robots and PLCs. The FMS allows for flexible, automated production of different part types in the laboratory environment.
1. The document provides instructions for logging into the GigaSpaces Cloud Computing Framework and demoing three applications - a data grid demo, trader stock desktop demo, and pet clinic demo.
2. It describes how to log in with a trial key or paid license, and launch the demo applications from the cloud web console.
3. Setup, usage, and testing instructions are provided for each demo application, including adding and terminating machines, viewing statistics, and testing high availability and self-healing functionality.
Ccure 9000 Monitoring Station User's ManualBill Kelly
The document is a user's manual for a C-Cure 9000 security monitoring system. It provides instructions for operating the monitoring station software, including how to log in, acknowledge and clear alarms, monitor camera feeds, view the activity log, check hardware statuses, and log messages. The manual describes the main interface windows and explains how to perform key tasks like responding to alarms, monitoring video, and initiating manual actions on security objects.
This document discusses various tools and techniques for performing basic dynamic malware analysis, including sandboxes, Process Monitor, Process Explorer, and Regshot. It explains how sandboxes like GFI Sandbox can provide initial analysis of malware but have limitations. Process Monitor and Process Explorer allow monitoring processes, registry changes, and other activity in real-time. Regshot facilitates comparing registry snapshots before and after malware is run.
This document provides instructions for creating a virtual probe tool in NX CMM Inspection Programming using Renishaw tool part files. It describes downloading the required Renishaw probe library files, setting up the file search paths, and using the NX assemblies application to add individual probe components like the PAA1 adapter, TP200 body, force module, extension, and stylus tip. Detailed steps are provided to begin a new probe tool file, add each component through selecting their interface arc centers, and define probe tool properties like the mounting junction and tracking points.
Internet of Things exercise on IBM BluemixLennartF
The document describes steps for building a sample application using Node-RED to process temperature readings from a simulated IoT device published to IBM Cloud. The sample flow checks readings against a threshold and reports if the temperature is safe or critical. Users deploy the boilerplate, import the sample flow, configure it for the simulated device, test it by changing the reported temperature, and review how the flow works.
The document provides a tutorial on how to query contoured results from a finite element analysis using the HV-4000 software. It describes how to:
1) Load a model file and results file, contour the model for von Mises stresses, and animate the results
2) Access the Query panel to view element properties and contour values for selected elements
3) Change the averaging method to simple, re-query to view nodal contour values, and export the query results to a CSV file for further analysis.
The document provides instructions for setting up and running a real-time PCR experiment using a Roche LightCycler 480 instrument and qBiomarker Mutation PCR Arrays. It describes how to create a run template with two programs - a heat activation program and PCR cycling program. It also outlines the steps to load the PCR array plate, start the run using the template, and analyze the results using the Second Derivative Maximum method.
The document provides an overview of building J2ME applications using the Mobile Information Device Profile (MIDP). It discusses MIDP and MIDlet fundamentals like the MIDlet lifecycle and API levels. It also demonstrates using the Wireless Toolkit to create, build, and run a simple "Hello World" MIDlet with commands for navigation between forms.
Lab Deliverable for Lab nYour NameDateTitle Creating, Using, Remo.docxDIPESH30
Lab Deliverable for Lab nYour NameDate
Title: Creating, Using, Removing System Restore Points for Windows 8.1Operating Environment:
1. Operating System: Windows 8.1 Pro
2. Hardware
3. SoftwareDescription:
Notes, Warnings, & Restrictions:Resources (Further Reading):Procedures:
[First Section Heading & Brief Intro / Explanation]
[Step-by-Step]
[Second Section Heading & Brief Intro / Explanation]
[Step-by-Step]
[Last Section Heading & Brief Intro / Explanation]
[Step-by-Step]
Title:Operating Environment:
1. Hardware
2. SoftwareDescription:
Notes, Warnings, & Restrictions:Resources (Further Reading):Procedures:
[First Section Heading & Brief Intro / Explanation]
[Step-by-Step]
[Second Section Heading & Brief Intro / Explanation]
[Step-by-Step]
[Last Section Heading & Brief Intro / Explanation]
[Step-by-Step]
1
2
· Week 4 Discussion
· Discussion response - your response to the discussion question should be between 150 - 300 words.
· Must provide a minimum of at least one (1) reference in your discussion.
Discussion Topic
Updated
Discuss ONE of the following: (Try not replicate other’s answers)
e) What is an installment loan?
Make sure you are properly citing your source(s) and providing your reference(s) for information you obtain from another source.
· Week 4 Lecture (embedded below)
· Code of Federal Regulations (eCFR). TITLE 42 Chapter IV Centers for Medicare & Medicaid Services, U.S. Department of Health & Human Services Subchapter G. Standards and Certification.
http://www.ecfr.gov/cgi-bin/text-idx?c=ecfr&tpl=/ecfrbrowse/Title42/42cfr483_main_02.tpl
· NCSL. (2009). Certificate of Need Programs by State and Service. The National Conference of State Legislatures, Denver CO.
· http://www.ncsl.org/issues-research/health/con-certificate-of-need-state-laws.aspx#Regulated
· Healthcare accreditation systems: further perspectives on performance measures http://intqhc.oxfordjournals.org/content/23/6/645.full
· Week 4 Discussion
Discussion Topic
Updated
Please address all three questions:
Article 1.....Regulations for Long Term Care Facilities.
A. Identify by name and location and research a Long Term Care Facility that had a regulatory deficiency.
-What was the deficiency?
-How was the deficiency addressed by the facility?
-Were there any penalties involved?
Article 2, CON
A. From the map choose a state that has CON regulations.
B. From that state, identify a hospital/ health system that had project review by CON.
C. Describe the project and the outcome of the CON process.
Article 3, Accreditation,
A. Joint Commission on the Accreditation of Healthcare Organizations (JCAHO)....define their m ...
Multisim is a circuit design software that allows users to capture schematics, simulate circuits, and transfer designs to PCB layout software. It supports the entire circuit design process from schematic capture to simulation to board layout. The user interface provides toolbars for common functions, component placement, virtual components, graphic annotations, and instruments. It also includes menus for file management, editing, viewing, simulation, transferring designs to board layout, and help.
how to create scada offline with comap applicationsmarconordiocdn
This document provides instructions for creating a SCADA diagram offline using the InteliMonitor software when final controller configuration files do not exist. It describes preparing the disk structure, using default controller archives from the ComAp installation package, and placing objects on the diagram. Key objects can be linked to communication objects from an archive to display values offline. The process involves selecting a site name, disabling automatic rendering, and choosing communication objects from the archive selected in the Line Diagram Editor tool.
The document provides instructions for setting up and running a real-time PCR experiment using a Bio-Rad iCycler or iQ real-time PCR system. It describes how to create a PCR protocol template and plate setup template before the experiment, load the plate and templates, and initiate the PCR run. It also outlines the steps to analyze the PCR data and save reports after the run is completed.
The document provides an introduction to marketing concepts. It defines marketing and discusses key aspects of the marketing process including marketing strategy, planning, implementation, monitoring and analysis. The marketing strategy section covers developing strategic plans, conducting SWOT and portfolio analyses to evaluate strengths, weaknesses, opportunities and threats. Different marketing orientations such as production, product and marketing concepts are also outlined.
يقوم كلا منا بالإستعداد وتجهيز و تسخير كل ما يملك لخوض إمتحانات حياته الهامة
قد سخّر الله كل ما قد نحتاجه لتجاوز إمتحان الحياة الدنيا و العبور به إلى الجنة
دعنا نراجع هذا معا
This document provides an overview of Microsoft PowerPoint and instructions for using its features.
It introduces PowerPoint as a presentation program for developing slide-based presentations. It then covers designing presentations by changing themes, colors, and backgrounds.
The document explains how to customize the slide master for consistent formatting across slides. It also provides directions for creating individual slides, including selecting layouts, adding and formatting text and pictures, reusing slides, and setting transition effects. Finally, it mentions printing options.
The document provides details on method development for chromatography. It discusses defining key terms, developing a test method plan, optimizing methods through experimental design techniques like factorial design. The method development process involves studying samples, setting goals, reviewing literature, selecting an approach, optimizing parameters, and finalizing the method. Critical parameters like column length and temperature, flow rate, mobile phase composition are identified for optimization. Formal validation is required once the method is developed.
This document is too short to summarize meaningfully in 3 sentences or less. It only contains the word "Gam" which provides no context or identifiable information that could be condensed into a high-level summary.
It is a multi-element analysis technique where The ICP source converts the atoms of the elements in the sample to ions. These ions are then separated and detected by the mass spectrometer
This document provides an overview of the key components of a high-performance liquid chromatography (HPLC) system, including the pump, solvent rack, autosampler, column, column compartment, and detector. It discusses the different types of pumps (isocratic, gradient, dual gradient), solvent racks, autosamplers (split loop, pulled loop), and columns. It also provides details on the configuration options and specifications for these various components. The goal is to help users select the appropriate components for their HPLC system based on their application needs.
This document discusses and compares inductively coupled plasma atomic emission spectroscopy (ICP-AES) and atomic absorption spectroscopy (AAS). It outlines the fundamental parts and techniques of each method including sample introduction, atomization, and detection. Key differences are described such as ICP-AES being able to analyze multiple elements simultaneously while AAS is single-element. The document also compares factors such as detection limits, linear ranges, analysis speeds, costs, ease of use, interferences, and applications.
Direct Mercury Analyzer for analysis of liquid, solid and gaseous samples
DMA which uses the principle of thermal decomposition, amalgamation and atomic absorption.
The DMA-80 can analyze solid, liquid and gas matrices with equal precision.
All mercury is released from the sample through thermal decomposition.
This eliminates the need for any sample preparation.
This document provides an overview of the Qtegra Intelligent Scientific Data Solution (ISDS) software. It describes the various components and features of the software, including:
- The Configurator tool allows administrators to control user access and permissions, configure instrument settings and experiments, create report templates, and view log files.
- The Qtegra user interface includes pages for dashboards, lab books, templates, queries, file management, and help. Templates are used to define analytical methods and workflows for sample measurement.
- Method parameters in templates control analytes, acquisition settings, standards, quantification methods, and more. Templates standardize the measurement process.
- Lab books contain the results of
1. The document discusses UV-visible spectroscopy, describing the basic components and functioning of a UV-visible spectrophotometer.
2. Key aspects covered include the electromagnetic spectrum, sample cuvettes, light sources, monochromators, detectors, and performance verification tests to ensure the instrument is functioning properly.
3. UV-visible spectroscopy is a technique used to study light absorption by molecules to determine concentration and identify substances.
The document discusses instrumentation and methods for gas analysis using Fourier transform infrared (FTIR) spectroscopy. It describes the key components of an FTIR gas analysis system including the FTIR spectrometer, gas cell, temperature control, flow control, pressure control, vacuum pump, and gas diluter. It also discusses sampling tools, gas standards, quantitative analysis methods, and the general steps for running an FTIR gas analysis which includes pretest preparations, connecting the sampling loop, preparing the FTIR, and running the analysis.
The TQA software offers a complete selection of qualitative and quantitative analytical techniques for FTIR.
It contains all of the algorithms that are typically used for calculating component concentrations and classifying spectra based on a set of standards
This document provides an overview of Fourier transform infrared (FT-IR) spectroscopy and the components of an FT-IR spectrometer. It describes the main parts of an FT-IR including the source, interferometer, detector, and how an interferogram is produced and transformed to a spectrum. It also explains common experimental parameters like resolution, scans, spectral range and how to collect background and sample scans.
The analyst is required to analyze a number of QC samples throughout the run where there are decisions to be made based on a window of acceptance for each QC sample analyzed.
Organic Elemental Analyzer “OEA” is a simultaneous
technique to determination of :-
Carbon,
Hydrogen,
Nitrogen,
Sulfur.
contained in organic and inorganic materials.
in solid, liquid, and gas forms.
This document provides information on classifying and labeling hazardous materials. It discusses the health effects of chemicals on humans and how they can enter the body. It describes common symptoms of chemical exposure and classifications of hazardous materials including explosives, flammable substances, toxic substances, corrosives, irritants, sensitizers, carcinogens, and substances dangerous to the environment. The document also covers labeling requirements, the Hazardous Materials Identification System (HMIS), and references several standards for hazardous materials classifications.
This document provides an overview of wound healing, its functions, stages, mechanisms, factors affecting it, and complications.
A wound is a break in the integrity of the skin or tissues, which may be associated with disruption of the structure and function.
Healing is the body’s response to injury in an attempt to restore normal structure and functions.
Healing can occur in two ways: Regeneration and Repair
There are 4 phases of wound healing: hemostasis, inflammation, proliferation, and remodeling. This document also describes the mechanism of wound healing. Factors that affect healing include infection, uncontrolled diabetes, poor nutrition, age, anemia, the presence of foreign bodies, etc.
Complications of wound healing like infection, hyperpigmentation of scar, contractures, and keloid formation.
How to Make a Field Mandatory in Odoo 17Celine George
In Odoo, making a field required can be done through both Python code and XML views. When you set the required attribute to True in Python code, it makes the field required across all views where it's used. Conversely, when you set the required attribute in XML views, it makes the field required only in the context of that particular view.
हिंदी वर्णमाला पीपीटी, hindi alphabet PPT presentation, hindi varnamala PPT, Hindi Varnamala pdf, हिंदी स्वर, हिंदी व्यंजन, sikhiye hindi varnmala, dr. mulla adam ali, hindi language and literature, hindi alphabet with drawing, hindi alphabet pdf, hindi varnamala for childrens, hindi language, hindi varnamala practice for kids, https://www.drmullaadamali.com
বাংলাদেশের অর্থনৈতিক সমীক্ষা ২০২৪ [Bangladesh Economic Review 2024 Bangla.pdf] কম্পিউটার , ট্যাব ও স্মার্ট ফোন ভার্সন সহ সম্পূর্ণ বাংলা ই-বুক বা pdf বই " সুচিপত্র ...বুকমার্ক মেনু 🔖 ও হাইপার লিংক মেনু 📝👆 যুক্ত ..
আমাদের সবার জন্য খুব খুব গুরুত্বপূর্ণ একটি বই ..বিসিএস, ব্যাংক, ইউনিভার্সিটি ভর্তি ও যে কোন প্রতিযোগিতা মূলক পরীক্ষার জন্য এর খুব ইম্পরট্যান্ট একটি বিষয় ...তাছাড়া বাংলাদেশের সাম্প্রতিক যে কোন ডাটা বা তথ্য এই বইতে পাবেন ...
তাই একজন নাগরিক হিসাবে এই তথ্য গুলো আপনার জানা প্রয়োজন ...।
বিসিএস ও ব্যাংক এর লিখিত পরীক্ষা ...+এছাড়া মাধ্যমিক ও উচ্চমাধ্যমিকের স্টুডেন্টদের জন্য অনেক কাজে আসবে ...
Communicating effectively and consistently with students can help them feel at ease during their learning experience and provide the instructor with a communication trail to track the course's progress. This workshop will take you through constructing an engaging course container to facilitate effective communication.
ISO/IEC 27001, ISO/IEC 42001, and GDPR: Best Practices for Implementation and...PECB
Denis is a dynamic and results-driven Chief Information Officer (CIO) with a distinguished career spanning information systems analysis and technical project management. With a proven track record of spearheading the design and delivery of cutting-edge Information Management solutions, he has consistently elevated business operations, streamlined reporting functions, and maximized process efficiency.
Certified as an ISO/IEC 27001: Information Security Management Systems (ISMS) Lead Implementer, Data Protection Officer, and Cyber Risks Analyst, Denis brings a heightened focus on data security, privacy, and cyber resilience to every endeavor.
His expertise extends across a diverse spectrum of reporting, database, and web development applications, underpinned by an exceptional grasp of data storage and virtualization technologies. His proficiency in application testing, database administration, and data cleansing ensures seamless execution of complex projects.
What sets Denis apart is his comprehensive understanding of Business and Systems Analysis technologies, honed through involvement in all phases of the Software Development Lifecycle (SDLC). From meticulous requirements gathering to precise analysis, innovative design, rigorous development, thorough testing, and successful implementation, he has consistently delivered exceptional results.
Throughout his career, he has taken on multifaceted roles, from leading technical project management teams to owning solutions that drive operational excellence. His conscientious and proactive approach is unwavering, whether he is working independently or collaboratively within a team. His ability to connect with colleagues on a personal level underscores his commitment to fostering a harmonious and productive workplace environment.
Date: May 29, 2024
Tags: Information Security, ISO/IEC 27001, ISO/IEC 42001, Artificial Intelligence, GDPR
-------------------------------------------------------------------------------
Find out more about ISO training and certification services
Training: ISO/IEC 27001 Information Security Management System - EN | PECB
ISO/IEC 42001 Artificial Intelligence Management System - EN | PECB
General Data Protection Regulation (GDPR) - Training Courses - EN | PECB
Webinars: https://pecb.com/webinars
Article: https://pecb.com/article
-------------------------------------------------------------------------------
For more information about PECB:
Website: https://pecb.com/
LinkedIn: https://www.linkedin.com/company/pecb/
Facebook: https://www.facebook.com/PECBInternational/
Slideshare: http://www.slideshare.net/PECBCERTIFICATION
How to Setup Warehouse & Location in Odoo 17 InventoryCeline George
In this slide, we'll explore how to set up warehouses and locations in Odoo 17 Inventory. This will help us manage our stock effectively, track inventory levels, and streamline warehouse operations.
Main Java[All of the Base Concepts}.docxadhitya5119
This is part 1 of my Java Learning Journey. This Contains Custom methods, classes, constructors, packages, multithreading , try- catch block, finally block and more.
4. Gamal A. Hamid
Chromeleon Software Components:
4
I. Instrument Controller Service
II. Client
III. Services Manager
IV. Instrument Configuration Manager
V. Administration Console
5. Gamal A. Hamid
I. Instrument Controller Service
5
The Instrument Controller (Service)
controls the data exchange to and
from the Instruments, such as
reading the instrument method from
a Data Vault and sending it to the
instrument, then writing back the
raw data delivered from the
instrument
Data Vault
Instrument
Controller
Process
Data
Run
Start / Stop
Services
Manager
Client
6. Gamal A. Hamid
II. Client
6
The Chromeleon Client provides the
user interface for all tasks related to
instrument operation, data analysis,
and data management.
7. Gamal A. Hamid
III. Service manager
7
No. Icon Description
1 Stopped
2
Starting or
stopping
3 Running idle
4 Active
5 Error
Monitor the status of the
Instrument Controller and
other services.
Start/Stop the Instrument
Controller service.
Launch the Instrument
Configuration Manager tool.
8. Gamal A. Hamid
IV. Instrument Configuration Manager
8
The Instrument Configuration is the tool in Chromeleon to configure
chromatography Instruments before they can be controlled by Chromeleon.
9. Gamal A. Hamid
V. Administration Console
9
The Chromeleon Administration Console is the central
access point for all administrative tasks in Chromeleon. In
the Chromeleon Administration Console, you can:
Manage users in the User Manager.
Allocate licenses in the License Manager.
Plan and organize tasks with the Scheduler.
Define global policies.
Configure the discovery service and monitor
other Chromeleon services.
Manage data vaults.
Create and manage Organizational Units
11. Gamal A. Hamid
II. Chromeleon Client
11
The Chromeleon Client provides
the user interface for all tasks
related to instrument operation,
data analysis, and data
management.
The Chromeleon Client contains
two main components:
1. Chromeleon Console
2. Chromatography Studio
12. Gamal A. Hamid
Software Sequence Order
12
Level 1 order access to the
categories “Categories bars” .
Level 2 order navigate
through the objects
“navigation Pane”.
Level 3 order work with that
object “Work area”.
13. Gamal A. Hamid
1. Chromeleon Console
13
The main Chromeleon window that appears after starting Chromeleon.
The Console comprises three major areas:
The Category Bars which provide access to the categories
Instruments, Data, and eWorkflows where you can control
instruments, navigate through all data and use or manage
eWorkflows.
The Navigation Pane where you can navigate through the objects
related to the selected category.
The Work Area which shows the content of the object that was
selected in the Navigation Pane, and allows you to work with that
object.
15. Gamal A. Hamid
1. Category Bars – These provide direct access to
a. Instruments b. Data c. eWorkflows
2. Navigation Area – This displays all objects associated with a specific category bar.
Details are provided in the relevant section for the category bars.
3. Work Area – This displays details about the selected object in the navigation area.
More details are provided in the relevant section for the category bars.
4. The Filter Toolbar offers different views of the list in the Navigation Pane:
a. Local: Items available on the local Chromeleon station.
b. Global: Items available on the Chromeleon Domain.
c. Custom: Filter based on text input.
5. Menu Bar – provides major commands relevant to the console.
6. The Sequence Toolbar is available when a Sequence is selected in the Navigation Pane.
7. The Sequence Status Bar indicates the sequence status.
8. Status Bar shows general information such as the currently logged on user and role.15
16. Gamal A. Hamid
2. Chromatography Studio
16
A separate window that is launched from
the Console, in which you can work with
data and objects related to a selected
sequence.
Here you can view and optimize all aspects
of the data, modify instrument methods and
processing methods, define and generate
reports, and manage spectral libraries.
18. Gamal A. Hamid
Chromatography Studio
18
In the Chromatography Studio you can edit all
objects related to the selected sequence:
I. Injection List
II. Instrument Methods
III. Data Processing
IV. View Settings
V. Report Templates
VI. Electronic Reports
VII. Spectral Libraries
19. Gamal A. Hamid
I. Injection List
19
The injection list is the primary
element of a Sequence.
The injection list groups
injections in the order in which
they will be processed and
includes injection variables
(name, type, etc.) that
characterize each injection.
20. Gamal A. Hamid
II. Instrument Methods
20
The instrument method
contains the control commands
that are executed in
chronological order by an
instrument when running an
analysis.
The tool used to create an
instrument method is the
Instrument Method Wizard;
the tool used to view and
modify methods is the
Instrument Method Editor.
Double-clicking an existing
instrument method
automatically launches the
Instrument Method Editor in
the Chromatography Studio.
23. Gamal A. Hamid
IV. View Settings
23
View settings define how the results
for a sequence are represented in the
data processing window.
This includes information such as:
The panes displayed in the data
processing window, The zoom level
and any layout properties of the
chromatogram plot, calibration plot,
spectral plot, contour plot, and 3D
plot, The sheets (tables), columns,
auto formats, and properties of the
interactive results tables.
24. Gamal A. Hamid
Reports and libraries
24
V. Report Templates
VI. Electronic Reports
VII. Spectral Libraries
Will cover later.
26. Gamal A. Hamid
Simple Analysis
26
1. Start Chromeleon
2. Start the instrument
3. Create a sequence
4. Acquire data
5. Process data
6. Review and report results
Every analysis using Chromeleon
follows the same 6 basic steps:
27. Gamal A. Hamid
1. Start the Chromeleon
27
Start Chromeleon Controller (in the
notification area).
Wait until the Instrument Controller is
running idle before stopping the service.
(To stop the Controller
Right-click the Chromeleon tray icon in the
notification area of the Windows taskbar.
Click Stop Chromeleon Instrument
Controller.)
28. Gamal A. Hamid
Configure Instruments
28
Configure instruments to open
the Instrument Configuration
Manager, where you can add new
instruments or change the current
instrument configuration.
29. Gamal A. Hamid
Modules Selection
29
Retrieving the configuration from module
given the right setting of each module.
Select the modules according to the
configuration of the system
30. Gamal A. Hamid
2. Start Instrument
30
To start the Chromeleon software:
Double-click the Chromeleon 7 icon on
the desktop:
The Chromeleon Console window
opens.
If user management is active, you will
be prompted to log on to the software.
Enter the credentials provided by your
Chromeleon administrator to proceed
31. Gamal A. Hamid
Establishing a Connection
31
Before you can control an
instrument, communication
must be established between
the modules and the
Chromeleon Instrument
Controller.
For all installed modules, the
Connect command is executed
automatically when the
Chromeleon instrument service
is running.
To connect the modules follow these
steps:
1. In the Console, choose the
Instruments category and click your
instrument’s name in the Navigation
Pane.
2. Select the ePanel tab for the
required module in the Work Area
(for example Pump).
32. Gamal A. Hamid
Controlling and Monitoring the Instrument
32
To issue instrument commands follow these steps:
1. In the Console, choose the Instruments
category. Select the instrument by clicking its
name in the Navigation Pane.
2. In the Work Area select the ePanel tab for the
required module.
3. Use the controls on the ePanel to issue
instrument commands (for example setting the
wavelength of a UV/VIS detector or starting
mobile phase flow on a pump).
33. Gamal A. Hamid
ePanel/ePanel Set
33
An ePanel is the window where you
monitor and control a module's
operation.
ePanels are displayed on the
Console in the Instruments view.
If an Instrument includes more
than one module, ePanels are
grouped into collections, called
ePanel Sets.
36. Gamal A. Hamid
Other Commands
36
Command
Most common commands are
available from the ePanels.
If you need to execute a
command that is not available in
the ePanel,
you can access all available
instrument commands from a
dialog box that is accessible via
the Command button in the
Instruments toolbar
37. Gamal A. Hamid
3. Creating a Sequence
37
A sequence determines how a group
of injections should be processed.
Sequences can be created in the
Console or by using an eWorkflow.
You create a sequence using the
Sequence Wizard within the
Console. the following files
should be created:
I. Instrument Method (Must)
II. Processing Method
III. Report Template
But first
38. Gamal A. Hamid
I. Instrument Method
38
The instrument method contains
the instrument commands that
will be executed for a sample
analysis.
All data entry values are checked
against the allowed values.
The commands available depend
on the instrument that the
program file is connected to.
39. Gamal A. Hamid
Creating an Instrument Method
39
1. In the Instruments category of the Console, select
the instrument from the Navigation Pane
2. On the Create menu, click Instrument Method.
3. Complete all wizard steps and click Finish.
The created instrument method opens in the
Chromatography Studio.
4. Review the instrument method by selecting the
module views in the Navigation Pane.
5. Edit settings, if required.
6. Save the instrument method
7. Close the Chromatography Studio.
40. Gamal A. Hamid
Instrument Method Wizard
40
Create
Instrument method
Select Instrument
System General Setting
Pump Flow Gradient
Pump general Setting
Sampler General Setting
Sampler Injection Mode
Sampler Temp. Control
Column Oven general Setting
41. Gamal A. Hamid
Cont.
41
Column Oven Columns
Column Oven Time Program
DAD Channels Setting
DAD Time Table
FLD General Setting
FLD General Setting page 2
Completion
Check Method.
42. Gamal A. Hamid
II. Processing Method
42
A processing method is used to
detect and quantify peaks and to
evaluate the recorded
chromatographic data.
The processing method contains
all the data processing instructions
(e.g. detection parameters, peak
names, etc.).
43. Gamal A. Hamid
Creating a Processing Method
43
1. In the Console, on the Create
menu, click Processing Method.
2. Select one of the predefined
layouts and click Next.
3. Enter a name, select a file location
and optionally enter a comment.
4. Click Finish to save the processing
method and close the wizard.
The new processing method
opens in the Chromatography
Studio.
44. Gamal A. Hamid
Processing Method Wizard
44
Create
Processing Method
Processing Method Template
Named the Method & Finish
Processing Method in Studio
46. Gamal A. Hamid
Detection Parameters
46
Cobra Wizard
Integration area
Baseline noise range
Smoothing width
Minimum Area
Channels and Injection types
47. Gamal A. Hamid
III. Creating a Report Template
47
1. In the Console, on the Create
menu, click Report Template.
2. Select one of the predefined
templates and click Next.
3. Select a file location and enter
a file name.
4. Click Finish to save the report
template and close the wizard.
49. Gamal A. Hamid
Sequence
49
A sequence determines how a group of injections is processed.
The following elements can be included in a sequence:
Injection list (a group of injections that are analyzed)
Injection results (the chromatographic data acquired for each injection)
Instrument method (the commands used for controlling the Instrument)
Processing method (the parameters used for evaluating the injection results)
View settings (the settings used for displaying data in the Chromatography
Studio)
Report template (the template used for printing injection results)
Spectral library (a group of spectra used for identifying unknown
substances)
50. Gamal A. Hamid
Sequence
50
Is a collection of
injections that are
analyzed and
processed together
in series.
Unknown: A sample for which the quantity,
presence, or absence of components is to
be determined during the analysis.
Calibration Standard: A sample with known
concentration(s) of component(s).
Calibration Standards are used in the
construction of calibration curves.
Check Standard: A sample with known
component concentration(s). Check
Standards are used to verify a calibration.
51. Gamal A. Hamid
Cont.
51
Blank: An injection used to characterize
the background signal (baseline), and/or
to ensure that unwanted components
are not detected. Blank “injections” can
be made without an actual injection
taking place.
Matrix: The sample matrix. The peak
areas in the Matrix can be subtracted
from the corresponding peak areas in all
the other injections in the sequence.
Unspiked: An Unknown sample
to be analyzed with the
Standard Addition method.
Spiked: An Unknown sample to
be analyzed with the Standard
Addition method, with known
amounts of components added.
52. Gamal A. Hamid
Creating a Sequence
52
To create a sequence using the
Sequence Wizard within the Console:
1. In the Instruments category of
the Console, select the
instrument from the
Navigation Pane.
2. In the Console, on the Create
menu, click Sequence.
53. Gamal A. Hamid
3. Complete the injection configuration settings for the injections
4. Click Next.
Note: When you are creating a sequence using the wizard, you can only add
injections with type Unknown. After the sequence has been created, you
can modify the injection types and positions.
5. Select methods and reporting preferences: For each field use the button to
navigate to and select the file you want to use. When all fields are
completed click Next.
6. Enter a comment for the sequence (optional) and click Finish.
7. The Save dialog box opens.
8. Specify where to save the sequence, enter a file name, click Save.
53
Cont.
55. Gamal A. Hamid
4. Acquire Data
55
1- Starting an Analysis
After the sequence has been created and the instrument is
ready, you can start data acquisition.
Checking that the Instrument is Ready
Check the baseline, for example, select the detector’s ePanel and
click the Monitor Baseline button.
When you are satisfied that the instrument is ready for analysis,
start the sequence.
Starting the Sequence
1. Select the Data category in the Console.
2. In the Navigation Pane, select the sequence you want to run
by clicking on it. Sequence then opens in the Work Area.
56. Gamal A. Hamid
56
2- Monitoring an Ongoing Analysis
During analysis it is useful to monitor the detector signal and other
instrument parameters (such as pressure and temperature).
To monitor an ongoing analysis:
1. In the Console, choose the Instruments category and click your
instrument’s name in the Navigation Pane.
2. Select the Home ePanel in the Work Area to monitor the detector
signal and audit trail.
Note: The settings of other modules can be monitored on their respective
ePanels.
57. Gamal A. Hamid
5. Processing Data
57
After chromatographic has been
acquired, it can be processed.
All processing steps are performed in
the Studio and saved in a processing
method.
59. Gamal A. Hamid
Data Processing Steps
59
I. Reviewing Data in the
Chromatography Studio
II. Working with Chromatograms
III. Detecting and Integrating Peaks
IV. Identifying Peaks
V. Calibration and Quantitation
60. Gamal A. Hamid
I. Reviewing Data in the Studio
60
After data for all samples in a
sequence has been acquired, it is
useful to review the
chromatograms and peak data
before reporting the results.
Often, peak detection, integration
and calibration settings need to be
modified before results are
reported.
61. Gamal A. Hamid
View Options
61
There are several views in
Chromeleon which can be
selected from the Presets
group on the Data
Processing Home tab.
You can also create new
views and store these to be
used again.
62. Gamal A. Hamid
II. Working With Chromatograms
62
You can view the integrated
chromatogram of the current
injection in the chromatogram .
If the evaluation of data is not what
you want, you can adapt the layout
of the chromatogram to your
needs.
64. Gamal A. Hamid
III. Detecting and Integrating Peaks
64
For correct quantification or qualification of a chromatogram, all
peaks of interest must be detected and correctly integrated.
To achieve this you can either: Create a new set of detection
parameters. or Modify an existing processing method.
65. Gamal A. Hamid
Creating a New Set of Cobra
Detection Parameters
Modifying an existing Processing
Method
Insert a New Detection Parameter
Modify and Delete Detection
Parameters
Integrate Unresolved Peaks
65
Steps
66. Gamal A. Hamid
Smart peaks
66
The SmartPeaks™
assistant helps you to quickly
calculate the baseline of
unresolved peaks.
All you need to do is drag a
window over the peaks of interest
in your chromatogram.
Cobra + Smart peaks together are
enough to integrate 99% of
chromatograms.
67. Gamal A. Hamid
IV. Identifying Peaks
67
After peaks have been detected
and satisfactorily integrated, they
can be used for reporting or
results calculations.
When reporting, it is useful to
name components in a
chromatogram.
Creating a Component Table
Modifying Retention Times and
Windows
68. Gamal A. Hamid
Component Table
68
The component table is part of
the Processing Method Editor and
contains all parameters required
to identify a peak and to
determine the amounts of the
substances serving as standards.
The Name variable, is set to a generated name
(Component 1, Component 2, etc.).
The Window variable is set to an absolute
value, which represents one-fourth of the
distance from a peak to either the preceding
peak or the next peak, depending on which
peak is nearer.
The Peak Type variable is set to AutoDetect,
indicating that Chromeleon determined the
peak type.
The Comment variable is set to auto generated,
indicating the component was created with the
wizard.
69. Gamal A. Hamid
Create a Component Table
69
There are three ways to create a component table:
Via the Component Table Wizard
Interactively in the chromatogram pane
Via the component table (processing method)
70. Gamal A. Hamid
V. Calibration and Quantitation
70
In order to convert the area below a
peak or the peak height into
absolute amount or concentration
values, calibration is required before
the analysis.
The calibration coefficients obtained
during calibration can then be used
to calculate unknown amounts.
71. Gamal A. Hamid
71
Specifying the type.
Creating and Assigning Calibration Levels.
Entering Calibration Standard Amounts
or Concentrations.
Viewing Calibration
Curves.
72. Gamal A. Hamid
6. Reviewing and Reporting Results
72
After data has been acquired and
calibration performed you can review and
report results.
You can create report templates in any
format and layout you require, or use one
of Chromeleon's default templates.
73. Gamal A. Hamid
To Start a Report
73
Open the injection for which you want to view the report.
On the Navigation Pane of the Chromatography Studio, click Report
Designer.
As an alternative, you can double-click a report template file in a
sequence (under Associated Items). This will open the report showing the
first injection in the injection list.
Chromeleon opens the report with the default report template that is
assigned to the sequence. If the sequence does not contain a report
template yet, the Create a Report Template wizard is opened
To create a new report template
In the Chromeleon Console, on the Create menu, click Report Template.
76. Gamal A. Hamid
eWorkflow
76
An eWorkflow is an electronic procedure for
automating the laboratory processes related
to a chromatographic analysis.
It assists the user in creating an appropriate
sequence with predefined associated files
and a well-defined structure.
An eWorkflow is typically created and
configured by an administrator or lab
manager in the eWorkflow Editor.
77. Gamal A. Hamid
Creation
77
1. Click eWorkflow in bars
2. Create, create eWorkflow.
3. Add the required field:
Instrument,
Methods,
Attached files.
4. Select the state Ready for
Use.
78. Gamal A. Hamid
Sequence General
78
Select :
The Report Template .
The View Settings.
The channel to be
displayed during injection.
Sequence name .
Data Vault, Path - select
the Storage Location for
the Sequence.
80. 80
No. Option Description
1 Max. Samples per
Bracket
that is, the repetitions of the sample block allowed per bracket. (e g. 4
samples)
2
Max. Brackets per
Sequence
Define the maximum number of bracketed sample blocks allowed in a
sequence. ( e g. 3 Brackets)
( 3 Brackets, 4 is Max Number of samples per Bracket) so this sequence
can contains 12 samples max.
No. of Alternate
Brackets
As complex sequences may require different types of brackets, Define
the number of alternating brackets in the layout. Max 5
4 Use Bracket Block
after Sequence
Header
Select this check box to insert a bracket block directly after the header
block and before the first sample block.
5
Layout template
The layout template is divided into several blocks, each in a different
color. To add a new injection to a block, click the bottom line of the
block.
6
Sequence Preview
Type or select a number in the Number of Samples box to see what the
injection list will look like.
The preview will be refreshed as soon as you change the above settings
or layout.
Sequence layout
82. Gamal A. Hamid
Run eWorkflow
82
click the category eWorkflows Select which eWorkflow
Click Launch Set the number of samples to 12
Set the start position to 1. Click Finish.
85. Gamal A. Hamid
Getting Started Steps
85
1- Switch on the instrument (open each module)
2- Switch on the PC .
3- Make sure the dongle is inserted at USB port.
4- Make Sure server is ON if not follow the following
a- click on server icon
b- click "start Instrument controller“
c- close service manager
5- Double Click on the Chromeleon icon
6- The "Home page" will open, make sure
all modules are connected.
86. Gamal A. Hamid
86
7- Open purge valve from Pump Module.
8- Open "Pump" page, Press the purge button.
9- Make sure to get all air bubble out of the
lines then close the purge.
10- Open the "Sampler" page.
11- Press the "Prime syringe" & "Wash buffer
loop" & "Wash needle" button respectively .
87. Gamal A. Hamid
87
12- Open the "Detector" page.
13- Switch on the Lamps and enter the
wavelength
14- Go to "Data" Page
15- Create New Folder and name it.
16- Press "create" and create sequence
17- Follow the wizard to create your sequence.
18- Press "create" and create your inst. Method.
19- Follow the wizard to create your method.
20- "Start" your sequence.
88. Gamal A. Hamid
88
21- Create your processing Method Using
"Cobra" wizard
22- Create & print Report using "Report Page“
89. Gamal A. Hamid
89
Using Calibration
1- From sequence need to choose standards.
2- Choose level (create levels equal to no. of
different concentration)
3- Save Sequence
4- double click on any sample to open
processing method
5- Enter the concentration of each
point at Levels box
6- To View Calibration curve click on
"Calibration Plot"
7- To view result you will find Amount, Tab active NOW
91. Gamal A. Hamid
The instrument is automatically shut down.
The pump flow is stopped at the end of the method.
Certain system components (for example, detector lamps and temperature-
controlled modules) are turned off.
Shutdown procedures are launched from the Console.
You can specify whether the procedure starts immediately or automatically, as part
of a queue.
Before launching Smart Shutdown, make sure the mobile phase in the flow path
does not contain dissolved salts (such as those in buffer solutions). Salt crystals
that can form after the flow stops will shorten the lifetime of piston seals and may
cause damage to columns. To avoid such problems, flush the flow path with a non-
ionic fluid that is compatible with your column, such as deionized water and/or an
organic solvent. 91
Smart Shutdown
92. Gamal A. Hamid
To run Smart Shutdown
92
Display the queue
Click the down arrow next to After
running the queue, and then click
run Smart Shutdown or run Smart
Standby.