
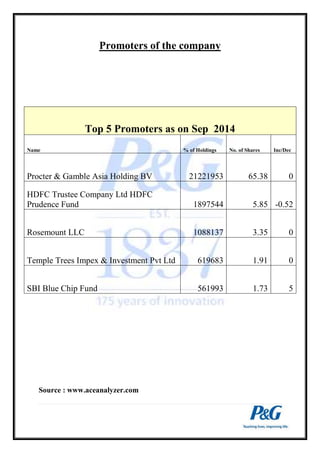
![Snapshot of Procter and Gamble
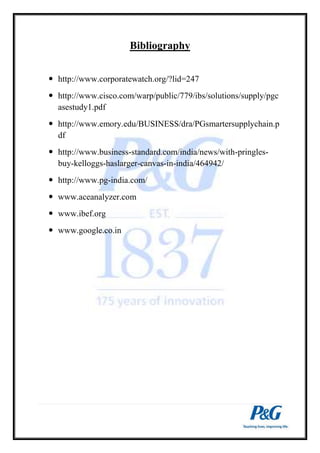
Company Details
Industry Household & Personal Products
House Procter & Gamble - MNC
Registered
Office Registered Office
Address
P & G Plaza,Cardinal Gracias Road,Chakala Andheri
(East)
Mumbai , 400099 , Maharashtra
BSE Code [500459]
NSE Symbol PGHH
Bloomberg PG IN
ISIN Code INE179A01014
Chairman R A Shah
Managing
Director Shantanu Khosla
Secretary Preeti Bishnoi
Source : www.aceanalyzer.com](https://image.slidesharecdn.com/f1f4fde1-4d19-4d56-9edc-8e98cf72ba53-141215061522-conversion-gate02/85/Final-Presentation-on-Procter-and-Gamble-12-320.jpg)
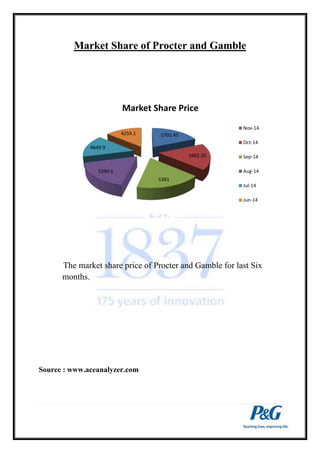
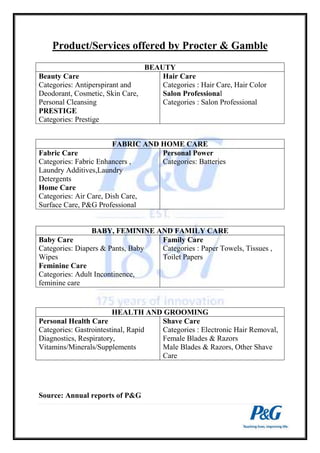
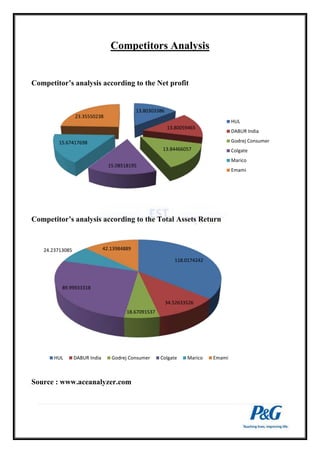


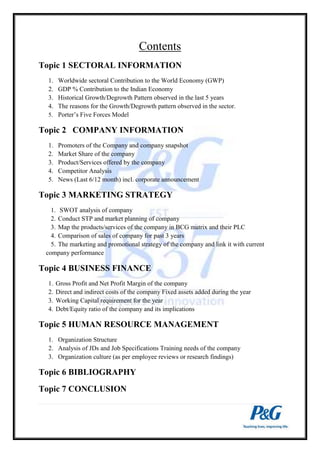
The document is a presentation on Procter & Gamble by Rishiraj Das. It includes an acknowledgement section thanking mentors for their support. The contents section outlines the various topics to be covered in the presentation, including sectoral information, company information, marketing strategy, business finance, human resource management, and a conclusion. Under sectoral information, it provides details on the FMCG sector's contribution to the Indian and world economies, historical growth patterns, and a PEST analysis. Company information includes an overview of P&G's history and promoters, market share, product offerings, and competitor analysis.