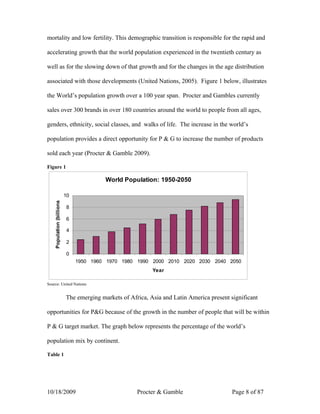
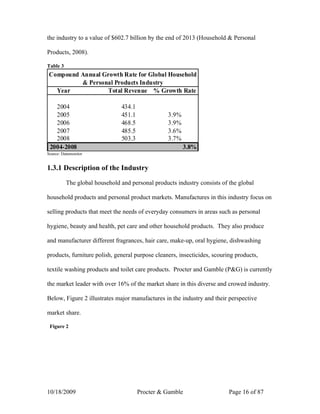
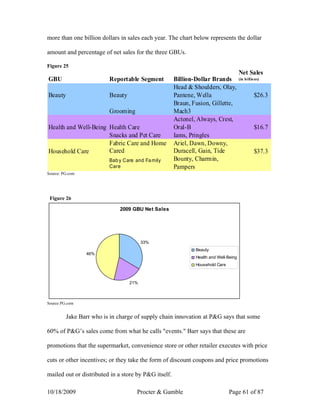
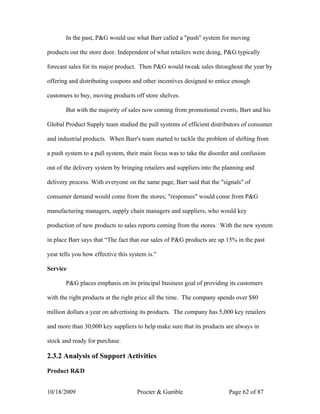
University of Houston-Victoria
          School of Business Administration


                    Individual Project


                Procter and Gamble


                     Submitted by:


                    Frank J. Paul


                     October 18, 2009


Seminar in Strategic Management – MGT 6359 (Section 34509)
         University of Houston - Victoria Fall 2009

              Instructor: Dr. T. T. Selvarajan
Table of Contents

1.0.0 External Environmental Analysis…………………………………………

3

1.1.0 General Environmental Analysis……………………………………………

3
      1.1.1 Demographic Segment……………………………………………….

      3
      1.1.2. Economic Segment………………………………………………….

      6
      1.1.3 Political/Legal Segment………………………………………………

      10
      1.1.4 Social-Cultural Segment………………………………………………

      11
      1.1.5 Technological Segment……………………………………………….

      12
      1.1.6 Global Segment……………………………………………………….

      15
      1.1.7 Summary of General Environment Analysis………………………….

      15

1.2.0 Driving Forces………………………………………………………………….

16

1.3.0 Industry Analysis………………………………………………………………..

19
      1.3.1. Description of the Industry……………………………………………..

      19


10/18/2009                 Procter & Gamble            Page 2 of 87
1.3.2. Industry Dominant Economic Features………………………………….

      19
      1.3.3. Industry Trends………………………………………………………….

      20
      1.3.4. Summary of Industry Analysis………………………………………….

      21

1.4.0 Five Forces Competitive Analysis…………………………………………..…..

22
      1.4.1. Threat of New Entrants…………………………………………………

      23
      1.4.2. Power of Buyers………………………………………………………..

      24
      1.4.3. Power of Suppliers……………………………………………………….

      24
      1.4.4. Threat of Substitutes……………………………………………………..

      25
      1.4.5. Intensity of Rivalry……………………………………………………….

      25
      1.4.6. Summary of Five Forces Competitive Analysis………………………….

      26

1.5.0 Competitor Analysis……………………………………………………………….

26
      1.5.1 What Market Positions Rivals Occupy…………………………………….

      26
      1.5.2 Strategic Group Maps of Competitors…………………………………….

      27
      1.5.3 Competitor’s Strategies……………………………………………………

      28


10/18/2009                 Procter & Gamble              Page 3 of 87
1.5.4 Strengths and Weaknesses of Competitors……………………………….

      30
      1.5.5 Competitor’s Next Moves…………………………………………………

      32
      1.5.6 Competitive Advantage of the Company in Relation to the Rivals………

      32
      1.5.7 Summary of Competitor Analysis………………………………………..

      33


10/18/2009                     Procter & Gamble                  Page 4 of 87
2.0.0 Internal Analysis and SWOT Analysis

2.1.0 Financial Analysis………………………………………………………………..

34
      2.1.1 Valuation Analysis………………………………………………………

      35
      2.1.2 Growth Analysis…………………………………………………………

      35
      2.1.3 Profitability Analysis……………………………………………………

      36
      2.1.4 Financial Strength Analysis……………………………………………..

      36
      2.1.5 Dividend Analysis………………………………………………………

      37
      2.1.6 Management Efficiency Analysis……………………………………….

      37
      2.1.7 Stock Price Analysis…………………………………………………….

      38
      2.1.8 Summary of Financial Analysis…………………………………………

      39

2.2.0 Strategic Analysis………………………………………………………………

39
      2.2.1 Current Business Level Strategies……………………………………….

      39
      2.2.2 Elements of Company’s Strategy………………………………………..

      40
      2.2.3 Components of Company’s Business Level Strategy…………………….

      42
      2.2.4 How Well the Company’s Strategy is Working…………………………


10/18/2009                     Procter & Gamble           Page 5 of 87
43
      2.2.5 Summary of Strategic Analysis………………………………………….

      44

2.3.0 Value Chain Analysis…………………………………………………………….

44
      2.3.1 Analysis of Primary Activities…………………………………………..

      45
      2.3.2 Analysis of Support Activities……………………………………..……

      46
      2.3.3 Analysis of Company’s Cost Competitiveness in Relation to Rivals……

      46
      2.3.4 Summary of Value Chain Analysis………………………………………

      47

2.4.0 SWOT Analysis…………………………………………………………………

48
      2.4.1 Strengths……………………………………………………………….

      48
      2.4.2 Weaknesses………………………………………………………………

      49
      2.4.3 Opportunities…………………………………………………………..

      50
      2.4.4 Threat………………………………………………………………….

      51
      2.4.5 Summary of SWOT Analysis………………………………………….

      51


3.0.0 References…………..………………..………………………………………..


10/18/2009                      Procter & Gamble                   Page 6 of 87
52


1.0.0 External Environmental Analysis
1.1.0 General Environment Analysis

       All companies whether global, regional, or local operate in a macro-environment

shaped by influences stemming from the economy at large, population demographics,

societal values and lifestyles, governmental legislations and regulations, technological

factors, and the industry and competitive arena in which the company operates. Most

organizations do not have direct influence on its broad environment such as society, the

economy, technology, global politics; it can shield itself from most threats and take

advantage of opportunities as they present themselves.

       Many major companies have lost industry dominance, market share, or gone out

of business because of their failure to recognize and adapt to changes in their

environments, or by failing to be leaders in making necessary changes. The key point is

that an organization needs to be in tune with its often turbulent external environment.

There must be a strategic fit between what the external environment needs or wants and

what the organization has to offer.

1.1.1 Demographic Segment

Population Size

       The world population is in the midst of an unprecedented transformation brought

about by the transition from a regime of high mortality and high fertility to one of low

10/18/2009                            Procter & Gamble                     Page 7 of 87
mortality and low fertility. This demographic transition is responsible for the rapid and

accelerating growth that the world population experienced in the twentieth century as

well as for the slowing down of that growth and for the changes in the age distribution

associated with those developments (United Nations, 2005). Figure 1 below, illustrates

the World’s population growth over a 100 year span. Procter and Gambles currently

sales over 300 brands in over 180 countries around the world to people from all ages,

genders, ethnicity, social classes, and walks of life. The increase in the world’s

population provides a direct opportunity for P & G to increase the number of products

sold each year (Procter & Gamble 2009).

Figure 1

                                           World Population: 1950-2050

                            10
    Population (billions)


                             8

                             6

                             4

                             2

                             0
                                 1950 1960 1970 1980 1990 2000 2010 2020 2030 2040 2050
                                                             Year

Source: United Nations


                            The emerging markets of Africa, Asia and Latin America present significant

opportunities for P&G because of the growth in the number of people that will be within

P & G target market. The graph below represents the percentage of the world’s

population mix by continent.

Table 1


10/18/2009                                             Procter & Gamble                     Page 8 of 87
Population Percentage Estimates
Continent                        1950       1975      2000     2010     2025        2050
Africa                            8.99%     10.31% 13.40% 14.95% 17.48%             21.84%
Asia                             55.46%     58.59% 60.48% 60.31% 59.57%             57.17%
Europe                           21.64%     16.65% 11.88% 10.61%         9.10%       7.55%
Latin America and the
Caribbean                          6.61%     7.96%     8.52%     8.52%     8.36%      7.97%
North America                      6.78%     5.97%     5.21%     5.09%     4.96%      4.90%
Oceania                            0.51%     0.52%     0.51%     0.52%     0.53%      0.56%
World                              100%       100%      100%      100%     100%        100%
Source: Geohive


1.1.2 Economic Segment

          The United States, the country with the world’s largest economy, is currently in

an economic recession. Since the recession began in December 2007, the real gross

domestic product (GDP), the total value of U.S. goods and services produced in a year

and a basic measure of an economy’s performance, dropped at an annual rate of more

than 6 percent in the fourth quarter of 2008. Federal Reserve Chairman Ben Bernanke

said conditions in the labor market and declines in the value of housing along with tight

consumer credit conditions will continue to hold consumers back from spending more

until they experience a loosening of conditions that impact them directly. Bernanke said

economic activity abroad is also an important consideration in how soon the U.S.

economy rebounds. He states “the steep drop in U.S. exports that began last fall has been

a significant drag on domestic production, and any improvement on that front would be

helpful”. (America.gov)


1.1.3 Political/Legal Segment

          With the U.S. economy currently experiencing a recession, other countries may

not be far behind. Japan, Britain, Spain and Singapore, which together represent about 12


10/18/2009                            Procter & Gamble                      Page 9 of 87
percent of the world’s economy, are equally vulnerable as fallout from the U.S. worsens

their economic weakness. Even emerging markets, including China, are likely to suffer as

exports to the U.S diminish.

       The developing slump has put pressure on central bankers in Japan, the U.K. and

the euro region to follow the lead of Federal Reserve Chairman Ben S. Bernanke, who in

the 1st quarter of 2009 accelerated interest- rate cuts in the U.S. with an emergency move

to lower the benchmark rate by three-quarters of a percentage point.

       The effect of the U.S. recession, which according to the IMF represents about 21

percent of the global economy, is spreading via multiple channels. There is less spending

by American consumers and companies are reducing demand for imported goods. The

meltdown of the U.S. subprime-mortgage market has pushed up credit costs worldwide

and forced European and Asian banks to write down billions of dollars in holdings.

Tumbling U.S. stock prices are also dragging down markets elsewhere. (Miller 2009)

1.1.4 Socio-Cultural Segment

       Women form the major target group for household, personal products and

consumer goods companies. Several P&G consumer products, such as skin care and

beauty care, are addressed directly to women. Other products, such as food and

beverages, home cleaning and detergents are addressed to women as the primary decision

makers or decision influencers. In addition to the media choice, companies have to decide

on the type of programs they sponsor, so as to attract the attention of their target

audience.

1.1.5 Technological Segment

       Organizations are rapidly trying to incorporate the Internet into their supply chain

practices. Global competitive pressure and heightened shareholder expectations have


10/18/2009                           Procter & Gamble                      Page 10 of 87
accelerated the rate of Internet adoption.Electronic markets are Web sites where buyers

and sellers converge to advertise, bid for products in auctions, post catalog information,

procure inventory, and manage inventory and fulfillment. An electronic market can be

aligned vertically, focusing on the procurement of industry-specific products such as

paper, metal, chemicals, agriculture, and energy. Or it can be horizontal, providing

products for a diverse range of industries. These markets act as hubs where buyers can

procure direct goods, and suppliers can market their products. In many respects, the

electronic market is a microcosm of the many-to-many supply chain market advocated

earlier.

           Today, electronic markets deal mostly with transactions related to the

procurement of indirect and direct goods, whether they are by auction, request for

proposal (RFP), spot electronic procurement, or e-catalogs. P&G can use the electronic

marketplaces to consolidate its location on where to procure goods, which can immensely

lower the administrative and inventory costs. It also provides P&G and others an

additional channel to market their goods. (Kahl & Berquist 2000).

1.1.6 Global Segment

           Procter and Gamble operates in more than 80 countries worldwide and sells more

than 300 products to over 5 billion people. The health of each nation’s economy and the

global economy as a whole affects P&G operations immensely. Given the current

economic recession of the United States, the world’s largest economy, the International

Monetary Fund predicts that the world economy, which grew by a robust 4.9% last 2007,

to slow sharply. The IMF predicts the global economy to grow by 3.7% in 2009 and 3.8%

in 2010 (IMF says U.S. recession, 2008). The graph below, lists the Current U.S.

Economic Indicators.


10/18/2009                             Procter & Gamble                     Page 11 of 87
Table 2

              Current U.S. Economic Indicators
October 06, 2009 (Close of Day)

                   Indicator                             Value
Inflation %                                               -1.44
GDP Growth %                                              -0.74
Unemployment %                                             9.80
Gold $/oz                                                1,038.75
Oil $/bbl                                                 70.88
Prime %                                                    3.25
Source: www.forecast.org
1.1.7 Summary of General Environment Analysis

          In the fast changing world of electronic commerce, no industry has been left

untouched by the impact of the Internet and the World Wide Web. The Internet has

caused fundamental shifts in the way consumers shop for and purchase goods and

services. This shift has the most impact on the household and personal care industry.

This industry is very dependent on the population growth of both developed and

developing countries. Major companies such as Procter and Gamble (P&G), market their

products to every demographic member of the global community. The final factor

affecting this industry is the current state of the global economy, especially the United

States with the world’s largest economy.

1.2.0 Driving Forces

Product innovation

          Procter & Gamble attempts to maintain its competitive edge by focusing on

product innovation. P&G currently spends almost twice as much on R&D spending

nearly $2.2 billion in 2008 as its closest competitor.

          The two most important factors in P&G's innovation process are its practice of

consumer demand research and its "Connect and Develop" R&D structure. When P&G


10/18/2009                            Procter & Gamble                    Page 12 of 87
first enters a new market it sets up in-home visits with consumers in order to fully

comprehend the needs, wants, and desires its’ potential consumers have for household

and personal products. P&G also incorporates consumers' input into the R&D process

through its "Connect and Develop" initiative. Through "Connect and Develop" P&G has

an online website where people can submit what P&G calls “game-changing product”

ideas, and provide input on topics such as packaging, product improvement and services

offered. P&G’s staff collects and sorts through all the ideas and work with the most

promising ones. This process is not responsible for the entire R&D that P&G does, but

approximately 42% of new products in the last several years were influenced by or

originated from "Connect and Develop." (PGconnectdevelop.com)

Regulatory influences and government policy changes

       Several consumer protection groups are voicing concerns over the presence of

harmful chemical ingredients in cosmetic products. A recent study showed that about one

third of cosmetic products contain carcinogens. Due to increasing public pressure, the

U.S. Food and Drug Administration is expected to impose stringent quality norms on

cosmetic products. New regulations may delay the launch of new products for companies

like P&G and result in higher product development expenditure. In Europe new rules on

ingredients contained in a European Union draft are expected to come into force this year

and a European Chemicals Agency has been created to improve regulation of products.

The cost of compliance with more stringent regulations creates new barriers of entry and

increases the number of counterfeits of household and personal care products on the

market. P&G and other companies must monitor and try to control the widespread use of

counterfeit products because they can both weaken a companies' brand image, and also

divert revenues that should be obtained by the brand's owner.


10/18/2009                          Procter & Gamble                      Page 13 of 87
Changes is cost

       P&G depends heavily on a diverse number of global commodities for

manufacturing its goods. Since 2002 prices have risen by nearly 50%. Nearly half of the

P&G’s cost of goods is directly related to commodity goods. The company has increased

prices due to higher costs of oil and other raw materials. In its recent conference call, the

company stated that it expected raw material costs to increase $3 billion in 2009. The

company has raised prices on most products such as Cascade dishwashing detergent,

Iams pet food, and Gillette razors to counter the increasing cost of oil in the first half of

2008. As the market leader, the company does benefit from pricing power and can

moderate commodity inflation better than its competitors (Wolf, 2008).

Some commodities of note:

       ▪ Coffee prices affect P&G’s Folgers’s brand, which most suffered from the rising
       coffee prices as a result of Hurricane Katrina
       ▪ Growing paper pulp prices affect several of the company's tissue businesses, as
       well as many of its products' paper packaging
       ▪ Increasing petroleum prices affect the fabric and home care businesses.
       ▪ Natural gas is a key energy input into the manufacturing process of toilet and
       diaper goods, which are air dried

Changing societal concerns, attitudes, and lifestyles

       Societal concerns, attitudes, and changing lifestyle not only affect P&G but every

company in the world that provides products, goods and services. P&G has faced a

number of boycotts over the years concerning the use of animals in testing the effects of

its products. Animal rights organizations argue that it is not only the specific practices of

individual companies that cause problems, but the attitude created by the currrent system

of exploitation that gives power and profits to the few, at the expense of people, animals

and the environment. They feel it is important to expose the unethical practices of

specific companies as their behavior is often indicative of the entire system.


10/18/2009                            Procter & Gamble                       Page 14 of 87
P&G admitted in 2005 at the 5th World Congress on Alternative and Animal Use

in the Life Sciences in Berlin, Germany that “P&G sometimes conducts research using

animals to demonstrate safety or efficacy in pharmaceuticals, pet nutrition studies and for

consumer products. Such studies are only conducted as a last resort once all other

reasonable options have been excluded”. P&G stated that it ultimately wants to eliminate

the need for all research involving animals for consumer products and their ingredients

(Procter & Gamble at the 5th World Congress, 2005).

       In the meantime, P&G is dedicated to use non-animal alternatives whenever

possible across the company. P&G also stated that a large majority of its research studies

do not employ animals. Animal testing is therefore the exception, not the rule at P&G.

In order to control and protect its company image, P&G has been working with

government and different academia to promote the acceptance of alternative ways for

testing its products. P&G claim that it wants to ultimately eliminate the need for all

research involving animals for consumer products and their ingredients (Procter &

Gamble at the 5th World Congress, 2005).

1.3.0 Industry Analysis

       The global household and personal products industry generated total revenues of

$503.3 billion in 2008. During the period from 2004 to 2008 the compound annual

growth rate (GAGR) was approximately 3.8%. The sales of personal products proved to

be the most lucrative for the global household and personal products industry in 2008,

generating total revenues of $408.5 billion, equivalent to 81.17% of the industry's overall

value. The performance of the industry is forecast to decelerate slightly, with an

anticipated CAGR of 3.7% for the five-year period 2008-2013, which is expected to drive


10/18/2009                          Procter & Gamble                      Page 15 of 87
the industry to a value of $602.7 billion by the end of 2013 (Household & Personal

Products, 2008).

Table 3
Compound Annual Growth Rate for Global Household
         & Personal Products Industry
  Year            Total Revenue % Growth Rate

   2004                        434.1
   2005                        451.1              3.9%
   2006                        468.5              3.9%
   2007                        485.5              3.6%
   2008                        503.3              3.7%
 2004-2008                                               3.8%
Source: Datamonitor


1.3.1 Description of the Industry

          The global household and personal products industry consists of the global

household products and personal product markets. Manufactures in this industry focus on

selling products that meet the needs of everyday consumers in areas such as personal

hygiene, beauty and health, pet care and other household products. They also produce

and manufacturer different fragrances, hair care, make-up, oral hygiene, dishwashing

products, furniture polish, general purpose cleaners, insecticides, scouring products,

textile washing products and toilet care products. Procter and Gamble (P&G) is currently

the market leader with over 16% of the market share in this diverse and crowed industry.

Below, Figure 2 illustrates major manufactures in the industry and their perspective

market share.

 Figure 2


10/18/2009                             Procter & Gamble                   Page 16 of 87
Global Household & Personal Products Industry Share %


                                           16.60%

                                                                    Procter & Gamble
                                                5.40%               Unilever
                                                                    L'Oréal S.A.
                                                 5.00%
                                                                    Kimberly-Clark
                                                  5.60%             Johnson & Johnson
                 62.40%
                                                3.20%               Other


Source: Datamonitor & Kimberly-Clark’s 10-K annual report

1.3.2 Industry Dominate Economic Features

Market size and growth rate

        The global household and personal care industry generated total revenues of $40.7

billion in 2008, representing a compound annual growth rate (CAGR) of 3.7% for the

period spanning 2004-2008. In comparison, the Americas and European markets grew

with CAGRs of 4.5% and 2.7%, respectively, over the same period, to reach respective

values of $13.9 billion and $16.7 billion in 2008. Market consumption volumes increased

with a CAGR of 3.1% during 2004-2008, to reach a total of 10.6 billion units in 2008.

The market's volume is expected to rise to 12.2 billion units by the end of 2013,

representing a CAGR of 2.9% for the 2008-2013 periods. (Household & Personal

Products, 2008).

Number of rivals

        The global household and personal products industry is a highly fragmented

industry with an enormous amount of products and manufactures. P&G faces competition

from local, low-cost manufacturers in developing countries and from increasing private


10/18/2009                             Procter & Gamble                     Page 17 of 87
label brands introduced by large format retailers and discounters worldwide. P&G’s

products must effectively compete with products from strong competitors as well as that

of retail chains at all times (Procter & Gamble Company 2008).

Scope of competitive rivalry

       There are considerable substitutes for all of P&G's product offerings, creating an

intense competitive environment. In order to differentiate itself, the P&G must continue

to provide new, innovative products and branding to the customer.

Number of buyers

       Although P&G is an extreme large company, its future is dependent on buyers.

Wal-Mart is P&G largest customer and accounted for over 15% of P&G total revenue in

2009, 2008, and 2007. This percentage of total revenue gives Wal-Mart the ability to

bargain with the P&G for lower prices, which would result in lower earnings. The current

credit crisis will not have a significant impact on P&G because of the diversity and

“recession-proof” status of its products. The products that P&G offers can sustain a

slowdown or recession in the US economy because of their product types. Consumers

will continue to purchase these goods through an economic correction. While P&G had

disappointing 2nd quarter earnings due to higher commodity costs in 2009, analysts’

reports indicate strong sales forecasts and growth opportunities for the rest of the year.

Degree of product differentiation

       Procter and Gamble has one of the most diversified product portfolios among

leading global manufactures and marketers of consumer products. P&G participates in

more than 40 product categories with 300 brands in over 60 different markets.

       The company is organized into three global business units (GBUs): Beauty,


Health and Well-Being, and Household Care. Please see Figure 21 for P&G three GBUs.

10/18/2009                           Procter & Gamble                      Page 18 of 87
In the beauty segment, the company's products include cosmetics, deodorants, feminine

care products, hair care, personal cleansing and skin care products. Tooth paste,

pharmaceuticals, personal healthcare, and pet food products are marketed under the

healthcare segment. The home care segment comprises of fabric care, hair care, dish care

and surface care products. In addition, P&G's products include baby care and family care

products such as diapers, baby wipes and bath tissue. The recent purchase of Gillette will

add blades and razors, batteries, electric razors, and small appliances to its broad product

offering. The company has more than 20 brands with sales exceeding one billion dollars,

which, together, have sales of over $24 billion. Brands include Pampers, Tide, Ariel,

Always, Whisper, Pantene, Bounty, Pringles, Crest, Clairol Nice 'n Easy, Actonel, Dawn

and Olay (Procter & Gamble 2009).

Product Innovation

       P&G’s global scale allows it to quickly flow innovation across developing

countries. The diversity of P&G’s brand portfolio gives it the opportunity to innovate in

more aspects of consumers’ lives than nearly any other company. P&G brands are in

every room of the house, at virtually every hour of the day. As a result, P&G is able to

get a better sense of consumers’ needs than other companies. This helps them spot more

problems and allows P&G innovations to help solve consumer’s needs and wants.

Demand Drivers

       Demand drivers in the household and personal care products industry include

some of the following categories: price, demographics, household income, and

innovation. The industry is mainly comprised of necessity products; meaning that even in

times of recession, sales remain steady. The price of the product is generally reflected on

the quality of the product and consumer preferences over a brand name or private label


10/18/2009                           Procter & Gamble                      Page 19 of 87
brands. Disposable income also plays a role, if a consumer has more disposable income,

they may buy the more expensive product.

Pace of technological change

       Procter & Gamble’s advertising and R&D is spread over 44 brands that account

for 90% of the company’s profits. This allows P&G more opportunities to leverage

proprietary technology among multiple categories. Moreover, P&G’s research and

development is enhanced by a global relationship with nearly two million researchers in

technology areas connected with P&G businesses. New products can be quickly brought

to market using P&G’s existing brands and distribution system. P&G’s relative level of

innovation is apparent from the results of the 2008 industrial research institute’s pace

setter study that measures the top new products measured by sales. In 2008, P&G had 10

out of 25 of the top new products in the non-food category. In comparison, Unilever, J&J,

Kimberly Clark, Colgate (CL), L’Oreal (LRLCY.PK), and Energizer (ENR) collectively

had 7 (Q4, 2009)

Vertical Integration

       Procter & Gamble, along with many of its top competitors have formed strategic

alliances and partnerships with suppliers such as Wal-Mart, Costco and other retailers in

order to improve is supply chain management, reduce storage cost and improve

efficiency. P&G has also created a special website for its customers called P&G

Everyday Solutions where its customers can get product updates, free samples, and print

coupons.

Economies of Scale

       P&G will continue to innovate because economies of scale allow P&G to spend

much more than rivals on R&D. For example, P&G spends over twice as much on


10/18/2009                          Procter & Gamble                      Page 20 of 87
research and development than its nearest competitor. P&G’s largest competitors by

trailing 4 quarters revenue are Unilever (UL) ($60B), Kimberly Clark (KMB) ($19B),

and Johnson & Johnson’s (JNJ) consumer segment ($16B). Moreover, the same

economies of scale allow P&G to efficiently signal this value to consumers through

advertising. P&G economies of scale allow it to meet consumer needs in a particular

region and then quickly flow that technology across multiple countries faster than its

competitors.

Learning / Experience Curve Effects

        Globally, there are many household care and personal product companies that

P&G must constantly be aware of and their decisions. Switching costs remain very low

in this industry and it allows consumers to easily switch their brands because of product

dissatisfaction, increased costs, or even out-of-stocked items.

        Also it is becoming more difficult for consumers to differentiate competing

brands as the number of product introductions is continually increasing. Companies

within the industry are regularly enhancing older product lines, while new product lines

are also being introduced. Being first to market can be extremely profitable for P&G or

any other company, but it could also back fire as more brands and product features are

offered, thus making it more difficult for consumers to differentiate among the products

that are available.

1.3.3 Industry Trends

        The personal care industry had an excellent growth rate in all the major markets

of the world in 2005-2006. Since the past few years, people have become more conscious

about their appearance and look, which has led to a huge demand for these products

worldwide. New products are launched by the leading brands to attract consumers. The


10/18/2009                          Procter & Gamble                     Page 21 of 87
trends in all the leading personal care markets show that this industry has massive

potential for growth. The women’s beauty industry is also growing at a rate of

approximately USD 202.254 billion every year where as the global market for cosmetics

alone USD 30.33 billion. The global personal care products industry is growing at a very

rapid pace; some of the factors directly responsible for this growth are:

        ▪ Rise in consumer spending power

        ▪ Increased demand due to people consciousness

        ▪ Entry of herbal and organic products

        ▪ Lifestyle and climactic changes, and

        ▪ Massive advertising and promotion strategy

1.3.4 Summary of Industry Analysis

        In summary, the household and personal products industry is a mature,

fragmented, and stable industry. The industry is considered highly competitive with

considerable substitutes for most products on the market. In such a climate companies

must be able to differentiate themselves and build customer loyalty by providing

outstanding service and providing new, innovative products and branding to the everyday

customers.

        The majority of developed countries are predicted to have only a small population

increase in the next decade. The developing and emerging markets will provide P&G

and other manufactures with incredible and unprecedented growth opportunities as

economies become more globally intertwined. Most of the products within this market

are considered recession proof and are considered necessities, therefore demand is

typically stable.


10/18/2009                          Procter & Gamble                        Page 22 of 87
1.4.0 Five Forces Competitive Analysis

          Michael Porter developed a framework consisting of five competitive forces,

which analyze how industry factors impacts a company's strategy. These factors are: the

threat of new entrants, power of buyers, power of suppliers, availability of substitutes and

competitive rivalry (Porter, 1985).


 Figure 3
Porter's Five Competive Forces

                                                   Potential
                                                   Entrants


     Suppliers' Power                             Industry          Buyers' Power
                                                 Competitors


                                                 Substitutes

Source: Michael Porter’s Competitive Advantage


1.4.1 Threat of New Entrants

          The enormous amount of products that are distributed under Procter & Gamble's

name creates a challenge for new entrants. Since the P&G possess a significant amount of

market shares around the world, a potential competitor that lack large sums of capital for

heavy marketing and research and development, would hardly be able to effectively

compete. However, there is concern about firms that specialize in niche markets. This

type of company could possibly become a threat to P&G's corresponding business

segment. Proctor and Gamble must continue to expand its operations internationally, due


10/18/2009                                       Procter & Gamble            Page 23 of 87
to the decline of the US dollar to other currencies and the emergence of new markets,

such as India or China.

1.4.2 Power of Buyers

       Although P&G is an extreme large company, its future is dependent on buyers.

P&G is heavily dependent on Wal-Mart and its affiliates for generating a major part of its

revenue. Sales to Wal-Mart and its affiliates have represented approximately 15% of its

total revenue since 2006 thus creating the “Wal-Mart effect.” High dependence upon

Wal-Mart reduces the bargaining power of P&G. Wal-Mart could use its bargaining

power to impose unfavorable terms on the company. Any decrease in revenue from Wal-

Mart could have a negative impact on the company's businesses.

1.4.3 Power of Suppliers

       P&G has a codependent relationship with most of its suppliers. In order to

generate above average revenues the P&G needs various quality materials for product

production at the best prices available. Suppliers of these materials also need key

customers like P&G for profitable revenue generation and will very likely have little

bargaining power because of its small size. P&G can use its tremendous size and large

amounts of available cash to its advantage during this current credit crisis. Rising interest

rates and the declining availability of credit ultimately should not affect P&G’s

relationship with its suppliers. P&G’s successful history and large market share can be

used to back its borrowings, under the assumption that P&G continues to maintain its

current market share.

1.4.4 Threat of Substitutes

       There is substantial number of substitutes for all of P&G's product offerings,

creating an intense competitive environment. In order to differentiate itself, the P&G

10/18/2009                           Procter & Gamble                      Page 24 of 87
must continue to provide new, cutting edge, and innovative products and branding to the

customer. P&G notes that working collaboratively with customers and developing deep

shopper and consumer understanding will improve the in-store presence of its products

and win the "first moment of truth." This happens when customers choose which brands

to buy. Winning the "second moment of truth," when consumers decide whether P&G

products deliver on the brand promise, is essential for growth in such a competitive

environment (Procter & Gamble 2009).

1.4.5 Intensity of Rivalry

       The intensity of rivalry is very high in this industry. P&G has several strong

competitors in different markets like Amway Corporation, Intimate Brands, Colgate-

Palmolive Company, Kimberly-Clark, Maybelline, Johnson & Johnson, Revlon, Inc.,

Estée Lauder, General Mills, S.C. Johnson & Son, Unilever, Sara Lee Corporation among

other big and medium sized competitors (Jones, 2005). Another important element

affecting the intensity of rivalry is that the switching costs in this industry are quite low

as it does not cost anything for a consumer to buy one brand of a consumer product

instead of another. The thing in favor of P&G is that unlike most of its competitors, who

use wholesalers who sell a variety of competing products, P&G’s network, while

independently owned and operated, mainly sells only P&G products giving the company

a slight competitive advantage.

1.4.6 Summary of Five Forces Competitive Analysis

       The Michael Porter's Five Force Competitive Analysis is a powerful tool that

helps business managers understand both the strength of their company’s current

competitive position and whether new products, services or businesses have the potential

to be profitable. With a clear understanding of where power lies, managers can take


10/18/2009                            Procter & Gamble                       Page 25 of 87
advantage of a company’s situation of strength, improve a situation of weakness, and

avoid taking wrong steps.

       The factors affecting P&G are economic, political, social, technological

advancements, environmental and legal. A detailed SWOT analysis revealed that the

company enjoys the strengths of a strong brand, R&D capabilities and strong global

infrastructure but also depends too much on a few top customers such as Wal-Mart and

mature markets. P&G should leverage its strengths to realize opportunities in emerging

markets and thwart away the threat from intense competition and increase in raw

materials. In the consumer products industry, P&G has a limited supplier power, mixed

buyer power, high risk of substitutes, intense competition and enjoys low risk of new

entrants.

1.5.0 Competitor Analysis

       The global household and personal care industry is an $82.6 billion dollar

industry. It is projected to have a market value of $95.1 billion by 2013. In 2008, the

United States accounted for over $17.2 billion and Europe was estimated to be around

$35.1 billion. Supermarkets and hypermarkets lead the global household products

market, distributing 56.1% of the market’s overall value. P&G accounts for 17.1% of the

global household and personal care products market value.

       Procter & Gamble principal activity is manufacturing and marketing consumer

products. It operates in six business segments: Beauty; Grooming; Health Care; Snacks,

Coffee and Pet Care; Fabric Care and Home Care. The Beauty Care segment includes

cosmetics, deodorants, fragrances, hair care and other products. Grooming includes

blades and razors, electric hair removal devices, face and shave products and home

appliances. The Health Care segment includes feminine care, oral care, personal health


10/18/2009                          Procter & Gamble                     Page 26 of 87
care and pharmaceuticals. The Snacks, Coffee and Pet Care segment includes coffee, pet

food and snacks. The Fabric Care and Home Care business includes air care, batteries,

dish care, fabric care and surface care. The Baby Care and Family Care business includes

baby wipes, bath tissue, diapers and facial tissue. Some of its brands are Head &

Shoulders, Olay, Pantene, Gillette, Oral-B, Pringles, Ariel, Tide, Downy and Pampers.

The products are sold in more than 180 countries around the world.

1.5.1 What Market positions rivals occupy

       Procter & Gamble (P&G) is the world's largest producer of household and

personal products by revenue with net sales of $83,503 million and with its products

reaching 4 billion people worldwide. P&G's product line includes 24 brands across

beauty, healthcare, and food including Tide detergent, Pampers diapers, and Gillette

razors, that generate over $1 billion in revenue annually. One of the key areas of growth

for the company is in emerging markets worldwide. Sales in developing nations have

increased steadily from 20% of total revenue in 2002 to 30% in 2008. According to

Wikinvest.com P&G already owns a large and growing market share in countries

including China and Russia. In light of the global economic downturn, P&G has

announced it will focus its growth strategy on emerging markets, opening almost all of its

20 new manufacturing facilities outside its established markets.

       Johnson & Johnson (JNJ) is the world's second largest and most broadly based

manufacturer of health care products, with 2008 annual sales of $63.8 billion. The

company holds a significant share of the consumer and pharmaceutical markets, and is

the world's largest developer and manufacturer of medical treatment and diagnostic

devices. In the company's continuing effort to diversify its business and increase profits,

JNJ is constantly acquiring new companies. According to Wikinvest.com, JNJ acquired


10/18/2009                          Procter & Gamble                      Page 27 of 87
8 companies in 2008. JNJ over-the-counter pharmaceuticals and nutritionals include:

skin care, baby & kids care, and women's health products, totaling $16.0 billion in sales

in 2008. Although the Consumer Health Care division is the smallest of the company's

three segments, it includes some of the company's most recognizable brands such as

Tylenol, Neutrogena, and Band-Aid.

           Kimberly-Clark is a consumer products giant with 19.4 billion in sales for FY

2008 and net income of $1.7 billion. KMB is microscopic in comparison to P&G, but

nevertheless a large force to be reckoned within the consumer products industry. In fact,

KMB continues to hold a significant market share in household and personal care

industry, with the No. 1 or No. 2 market share position in more than 80 countries. In

order to see continued growth and profits, however, Kimberly-Clark must develop new

innovative products or figure out a way to compete more effectively with its current line

of products. If KMB cannot do this, it is possible that the company will become

increasingly less profitable.

1.5.2 Strategic group maps of competitors

           Driving forces and competitive pressures do not affect all strategic groups evenly.

Profit prospects vary from group to group based on the relative attractiveness of their

market potential. A Strategic group is a cluster of firms in an industry with similar

competitive approaches and market positions. Strategic group mapping is an analytical

tool for displaying the different market and/or competitive positions that rival firms

occupy in a particular industry. Figure 4 and Figure 5 below represent the strategic group

map of the household and personal care industry with three main competitors.


Figure 4


10/18/2009                             Procter & Gamble                     Page 28 of 87
Household and Personal Care
                               Industry Strategic Group Map

   High
                                             Johnson &
                                              Johnson


                                                                Procter &
    Net Income


                                                                 Gamble


                           Kimberly
                            -Clark
  Low


                         Number of Operations in Different Countries
                   Low                                                     High

Figure 5
                              Household and Personal Care
                              Industry Strategic Group Map
   High


                                                              Procter &
                                                               Gamble
    Market Share


                         Kimberly
                          -Clark


                                                Johnson &
                                                 Johnson
  Low


                                    Advertising Expenditure
                   Low                                                    High


10/18/2009                                         Procter & Gamble               Page 29 of 87
1.5.3 Competitor’s Strategies

          JNJ diverse revenue base has helped insulate it from the highs and lows that affect

its competitors from time to time. As a result of this and its acquisition strategy, JNJ has

reported more than 70 years of sales growth and produce impressive free cash flow,

which is its operating cash flow less capital expenditures, reaching almost 20% of sales.

This excellent cash generation has enabled JNJ to grow its dividend for the last 44 years,

a trend that is expected to continue in the next couple of years.

          KMB has been expanding its portfolio of services by entering into strategic

agreements, and acquiring alliances in order to strengthen its position in the industry. In

March of last year, KMB decided to purchase the remaining shares of its South African

subsidiary, Kimberly-Clark of South Africa (K-CSA) from the Lion Match Company. K-

CSA is a leading manufacturer and marketer of tissue, personal care and business-to-

business products and also markets Kimberly-Clark's line of health care products. KMB

increased ownership in K-CSA will allow it to expend its international reach and gain

market share in the African region.

1.5.4 Strength and Weaknesses of competitors

          Johnson & Johnson (JNJ), the world’s leading consumer health company, is

engaged in the R&D, manufacture and sale of household and personal care products,

pharmaceuticals and medical devices and diagnostics. JNJ has a number of strengths and

weaknesses which are depicted in the table below.

Table 4
Strengths                                    Weakness
▪ Strong Brand Image                         ▪ Over Dependence on Pharmaceutical Sales
▪ R&D                                        ▪ Lack of size in therms of revenue
▪ Interaction with Customers                 ▪
▪


10/18/2009                            Procter & Gamble                     Page 30 of 87
J&J attaches great importance to developing an understanding about its products

among consumers, doctors and medical professionals. There is also a constant focus on

educating customers. This constant interaction with customers has afforded JNJ the

ability to grow its brand image that is almost unparallel to anyone else. JNJ’s R&D team

of scientists works in partnership with the marketing department and product supply

teams to improve products, packaging and supporting advertising claims. Several new

products have been developed and launched successfully by understanding the

consumer’s wants, needs, and requirements. Despite its remarkable strengths, JNJ has a

number of weaknesses. More than 40% of J&J’s revenue currently comes from its

pharmaceutical group, with seven drugs each bringing in more than $1 billion in sales.

Even with a strong brand portfolio and geographically diversified operations, JNJ lacks

the size, in terms of revenue, to compete with companies like Procter & Gamble, whose

revenues for the fiscal year ended June 2008 were $83,503 million, where as JNJ were

$63,747 million.

          Kimberly-Clark Corporation (KMB) is a global health and hygiene company

offering household and personal care and consumer tissue products. KMB has a number

of strengths and weaknesses which are represented in the table below.

Table 5
Strengths                                   Weakness
▪ Strong Brand Image                        ▪ Lack of Scale
▪ Strong Customer Loyalty                   ▪ High Dependence on Wal-Mart
▪ Broad Portfolio of Products               ▪ Lack of International Revenue
▪ Diversified business structure


          Kimberly-Clark's product portfolio includes some of the most popular brands of

the world such as GoodNites, Cottonelle, Kleenex, Scott, Andrex, Hakle, Huggies, Pull-


10/18/2009                           Procter & Gamble                    Page 31 of 87
Ups, Kotex, Poise, Kimberly-Clark, Fiesta, Little Swimmers, Andrex, Ballard, Kimwipes,

Lightdays, Page and Depend. KMB has some of the most recognizable products in the

industry that have allowed it to achieve consumer loyalty and over time have ensured a

lofty market share. KMB has a diversified business structure that has been organized into

four reportable global business segments: Personal Care; Consumer Tissue; K-C

Professional & Other; and Health Care. Wal-Mart is KMB largest customers and

accounted for approximately 14 percent in 2008 and 2007, and approximately 13 percent

in 2006 of its net sales and revenue. KMB had approximately $10,461 million, which

was 52.1% of the total revenue coming from the North American region; out of which

$10,143 was from the U.S. alone.

1.5.5 Competitor’s next moves

       In an effort to keep pace with a more competitive and ever changing market

Johnson & Johnson has decided to focus on redefining the image of certain products

through marketing drives that are closely integrated with packaging and product design.

The success of many of Johnson & Johnson’s packaging redesign projects is based partly

on the creative imagination of the designers.

       Within this new structure today, JNJ also believes that another key focus is on

relationship management. JNJ wants to ensure that all divisions, from R&D to sales,

communicate effectively and collaborate around shared goals. Within a collaborative

environment that functions well, the product is linked to the process of packaging design

at a much earlier stage than ever before. JNJ believes that this bond between product

design and packaging design is crucially important to the future success of any

advertising and/or marketing campaign, because all internal stakeholders have an input

on the final product and the strategy to place it in the market.


10/18/2009                           Procter & Gamble                   Page 32 of 87
KMB main focus is on its growth through acquisitions. KMB in October 2008,

purchased the remaining shares of Colombina Kimberly Colpapel (CKC) from Compañía

Colombiana de Inversiones. This acquisition will enhance KMB’s growth potential in

the rapidly developing markets of Bolivia, Colombia, Ecuador, Peru and Venezuela.

Earlier this year, KMB acquired Jackson Products, a privately held safety products

company. Jackson Products was one of the leading providers of welding safety products,

personal protective equipment and work zone safety products. The acquisition is expected

to bring a wealth of strengths to Kimberly-Clark's professional business, including a

strong product portfolio with an experienced sales force.

       Kimberly-Clark will also focus its growth through product innovation. The

company will spend approximately 1.5% of its annual revenue on R&D in an effort to

drive innovative new products to the market. KMB will work more closely with

customers in order to increase shopper loyalty. Finally, in order to further build brand

equity and market share, KMB has decided to increase its marketing spending by $200

million over the last four years and plans to continue increasing its marketing investments

for the foreseeable future.

1.5.6 Competitive advantage of company in relation to the rivals

       Procter and Gamble is one of the most admired and industry dominating

companies in the world today. P&G takes great pride in the products they produce and

work hard to ensure that their products are of the highest quality. They strongly believe

in the importance of advertising and research and development. They research intensely

to determine their target markets and what types of products would best fit their needs. In

fact P&G currently spends almost twice as much on R&D spending nearly $2.2 billion in

2008 as its closest competitor. P&G’s advertising and R&D are spread over 44 brands


10/18/2009                          Procter & Gamble                     Page 33 of 87
that account for 90% of the company’s profits. P&G’s research and development is

enhanced by a global relationship with nearly two million researchers in technology areas

connected with P&G businesses. P&G promotes its products to those who most fit their

target market by appealing to the lifestyles that the consumer lives and understanding

what the consumer’s values and morals are. P&G has a long standing reputation of

having a family of products that are of excellent quality and continues to be a leader in

household goods.

1.5.7 Summary of competitor analysis

       The household and personal care products industry is a highly competitive,

mature, and stable industry for the market. More times than not, it has not experienced

the major downfalls because of the economy. From the information provided by most

analysts a general conclusion can normally be made about the nature of this industry.

According to most analysts most slips in sales or volume are resulting from current

economical standings; however, these drops are not normally significant enough to affect

an industry that provides products people rely on for everyday living. Generally, when

the market falters it is because of a decrease in the consumers’ purchase of luxury items.

The household and personal care industry offer both types, necessity products which are

normally considered recession proof products and those of luxury.

       In order for P&G to maintain its current market position, they must continue to

scan the environment for possible threats. Whether through acquisitions or Greenfield

investments, P&G must start to focus on developing and emerging markets. Rising gas

prices and new regulations will not only impact P&G but its competitors also. Therefore

P&G must work non-stop to ensure that they can continue to put forth a superior quality


10/18/2009                          Procter & Gamble                      Page 34 of 87
of product. P&G has many loyal customers and has to continue to meet their needs while

attracting new customers in order to remain on top of their industry.


2.0.0 Internal Analysis and SWOT Analysis
2.1.0 Financial Analysis

          Financial analysis is the use of financial statements to analyze a company’s

financial position and performance, and to assess future financial performance. It reduces

the reliance on hunches, guesses, and intuition for business decisions. Procter and

Gamble and it competitors’ financial statements were obtained from Yahoo Finance,

AOL Money & Finance, and the Securities and Exchange Commission (SEC). The most

recent annual 10-K report from each of the companies was evaluated in order to insure

the accuracy of the information provided.

2.4.1 Valuation Analysis

          Financial minds are constantly trying to measure the value of securities (or

businesses). Valuation ratios are mathematical calculations that help individuals assess

and determine the cost of a security (or business) to the benefits of owning it. These

ratios are typically calculated by dividing a measure of price by a measure of value or

vice-versa. For purposes of my analysis, I am applying the following ratios:

Price/earnings ratio, Price to earnings growth ratio, Price/Cash flow ratio, Price/Book

ratio and Dividend yield.

Table 6


10/18/2009                            Procter & Gamble                     Page 35 of 87
Valuation Ratios
                           PG             JNJ          KMB         Industry
Market Cap            168.28 Billion 167.94 Billion 24.48 Billion 260 Billion
P/E Ratio                 16.71          14.14          14.44        16.90
P/E Growth Ratio           1.46           1.65           1.50         N/A
Price/Cash Flow Ratio     11.70          10.70          10.30        12.90
Price/BookRatio            2.69           3.62           5.41        5.82
Dividend Yield             2.51           3.00           4.40         2.9
Source: MSN Money


        ▪ Price/earnings ratio (P/E): This formula is calculated by dividing the price of

        the stock per share by the earnings per share. Although this calculation is simple,

        the information is readily available and the ratio is a good valuation method to use

        versus peers and for historical purposes.


        ▪ PEG ratio (Price to earnings growth ratio): This ratio is closely related to the

        first ratio, but it is slightly more dynamic and incorporates the estimated growth

        of a company. In the PEG ratio the formula uses the price/earnings ratio and then

        divides that number by the expected annual earnings per share growth rate. This is

        a great valuation method to use when considering whether a stock that is growing

        quickly is still a good value or not, but the method is also subject to objective

        guesses as to the growth rate.


        ▪ Price/cash flow ratio: This method measures the ability of a company to

        provide cash flow on a per share basis. The ratio is calculated by taking the stock

        price per share and dividing that by the operating cash flow per share. A top

        reason to use this method is that it typically excludes possible accounting

        distortions that other investment ratios might not be able to exclude.


10/18/2009                           Procter & Gamble                       Page 36 of 87
▪ Price/book value ratio: The book value of a company is a nice conservative

       valuation method that value investors and more traditional investors love to use.

       The price book value ratio is found by taking the stock price per share and

       dividing it by the shareholder’s equity per share. Over the years the book value

       has lost importance in many circles due to its undervaluing of modern asset types.


       ▪ Dividend Yield: While not every stock has a dividend, understanding that a

       dividend yield is essential in valuing a company is important. An investor can find

       the dividend yield of a stock by taking the annual dividend amount per share and

       dividing that by the stock price per share. A Dividend yielding stocks are typically

       more mature and more value related, as opposed to growth stocks which often

       yield nothing or almost nothing.


Valuation Conclusion: Although the P/E ratio is slightly higher than the peer

comparison, the P/E ratio is in line with the industry. Plus, based on the more favorable

P/E growth ratio, cash flow and book ratio, it appears P&G is a more valuable option than

JNJ and KMB; therefore, investors are willing to spend more for an ownership interest in

P&G.

2.4.2 Growth Analysis

Growth ratios or growth rates tell us just how fast a company is growing. The most

important of these growth ratios include:


       ▪ Sales %: Sales growth is normally stated in terms of a percentage growth from

       the prior year. Sales is the term used for operating revenues so it is important to

       see the sales growth rate as high as possible.


10/18/2009                          Procter & Gamble                      Page 37 of 87
Figure 6


                                                                       Sales %


       200 6


                                                                                                                            Kim be rly- Cla rk
       200 7                                                                                                                Joh nso n & Joh nso n
                                                                                                                            Pr octer & G amb le


       200 8


            0.0%                5.0%               1 0.0%            1 5.0 %              2 0.0 %                2 5.0 %


                                                        2008                           2007                2006
                Procter & Gamble                           9.2%                          12.1%               20.2%
                Johnson & Johnson                          4.3%                          14.6%                5.6%
                Kimberly-Clark                             6.3%                           9.1%                5.3%
Source: Data and Chart constructed from each company’s 10-K Annual Report


           ▪ Net Income: Growth in net income is even more important that sales because

           net income tells you how much money is left over after all of the operating costs

           are subtracted from sales.


Figure 7                                                          Net Income %

    2 5.00 %
                              2 2.40 %                                     2 1 .6 0%
                                                       19 .10 %                              1 9.6 0%
    2 0.00 %
                   16 .80 %
    1 5.00 %
                                                                                                        9.9 0%
    1 0.00 %                                                                                                                   P ro cter & Ga mb le
                                                                                                                               Jo hn so n & Jo hn son
      5.00 %                                                                                                                   K imb e rly-Cl ar k
      0.00 %
                               2 0 08                             2 00 7                                2 00 6
     -5.00 %
                                                              - 4.30 %                                           -4 .40 %
                                        - 7.30 %
    -1 0.00 %


                                         2008                     2007                        2006
Procter & Gamble                             16.80%                  19.10%                      19.60%
Johnson & Johnson                            22.40%                   -4.30%                       9.90%
Kimberly-Clark                                -7.30%                 21.60%                       -4.40%
Source: Data and Chart constructed from each company’s 10-K Annual Report


10/18/2009                                                  Procter & Gamble                                                 Page 38 of 87
▪ Dividends: Dividend growth is a good indicator of the financial health of a

          company. Some companies do not pay stock dividends at all; rather they use these

          excess profits to reinvest money back into the company to hopefully accelerate

          growth. One thing we like to see in Dividends (%) is that it does not go negative.

          That is, once a dividend rate is established, a company needs to have a very good

          reason to decrease the dividend payout.

  Figure 8                                        Dividend Yield %


     20 06


                                                                                            Ki mbe rl y-Cla rk
     20 07
                                                                                            Joh nso n & Joh nso n
                                                                                            Pr octe r & G am ble

     20 08


        0.0 0%             0 .0 1%            0 .01 %            0.02 %            0.0 2%


                                             2008          2007           2006
              Procter & Gamble                0.01%         0.01%          0.01%
              Johnson & Johnson               0.01%         0.01%          0.01%
              Kimberly-Clark                  0.01%         0.01%          0.01%
Source: Data and Chart constructed from each company’s 10-K Annual Report


Growth Analysis Conclusion: P&G has demonstrated a stronger ability to grow than

JNJ ad KMB. P&G’s sales growth has outpaced their peers and has resulted in strong net

income growth. P&G has been able to grow sales and net income year over year unlike

its peers.


2.4.3 Profitability Analysis

10/18/2009                                       Procter & Gamble                             Page 39 of 87
Profitability ratios or profitability margins are a good indicator of how efficient a

company is operating. This is a measure were you would normally compare a company

to its industry as a benchmark rather than the overall stock market since the profitability

of companies can vary greatly by industry.


          ▪ Gross Margin (%): Sales Revenue less COGS divided by net sales revenue

  Figure 9

                                                Gross Profit Margin %

                                             30%
      2006                                                                          72%
                                                                    51%

                                              31%                                                 K imberly-Clark
      2007                                                                          71 %
                                                                                                  Johnson & Johnson
                                                                   52%
                                                                                                  P rocter & G amble
                                             30 %
      2008                                                                          71%
                                                                   51%

          0%       10%       20%       30%          40%      50%     6 0%     70%      80%


                                                      2008                  2007           2006
                      Procter & Gamble                51%                   52%            51%
                      Johnson & Johnson               71%                   71%            72%
                      Kimberly-Clark                  30%                   31%            30%
Source: Data and Chart constructed from each company’s 10-K Annual Report


          ▪ Earnings per Share trending

   Figure 10


10/18/2009                                          Procter & Gamble                              Page 40 of 87
Earning per Share

     $5.00
                        $4.55                           $4.25
     $4.50                      $4.14           $4.15                       $3.76    $3.90
     $4.00      $3.64
     $3.50                                 $3.04
     $3.00                                                           $2.64                   Procter & Gamble
     $2.50                                                                                   Johnson & Johnson
     $2.00                                                                                   Kimberly-Clark
     $1.50
     $1.00
     $0.50
     $0.00
                         2008                      2007                       2006


                                              2008               2007                2006
              Procter & Gamble                $3.64              $3.04               $2.64
              Johnson & Johnson               $4.55              $4.15               $3.76
              Kimberly-Clark                  $4.14              $4.25               $3.90
Source: Data and Chart constructed from each company’s 10-K Annual Report


          ▪ Net Profit Margin (%): Gross sales revenue less all (not just COGS) expenses

          divided by gross revenue. The net profit margin is the ratio of net profits to sales.

          This is the best indicator of the company's efficiency in that net profit takes into

          consideration all expenses of the company. You want the net profit margin to be

          as high as possible.

  Figure 11


10/18/2009                                       Procter & Gamble                             Page 41 of 87
Net Profit Margin %

    25%
                                                                             21%
                      20%
    20%
                                                  17%
                14%                         14%                       13%                Procter & Gam ble
    15%
                                                         10%                             Johnson & Jo hnson
    10%                      9%                                                     9%
                                                                                         Kimberly-Cla rk

     5%

     0%
                      2008                        2007                       2006


                                          2008             2007             2006
            Procter & Gamble              14%              14%              13%
            Johnson & Johnson             20%              17%              21%
            Kimberly-Clark                 9%              10%               9%
Source: Data and Chart constructed from each company’s 10-K Annual Report


Profitability Conclusion: Although P&G shows solid profitability performance, JNJ

appears to be the benchmark for our comparison. P&G demonstrates a strong gross

margin and healthy net margin. However, both peer comparisons demonstrate stronger

per share performance.

2.1.4 Financial Strength Analysis

          ▪ Current Ratio: current assets/current liabilities

Figure 12


10/18/2009                                        Procter & Gamble                       Page 42 of 87
Current Ratio

   1.8
                     1.65                       1.51
   1.6
   1.4                      1.22                       1.24          1.22 1.20
   1.2                                                                              1.05           Procter & Gamble
     1
              0.79                       0.78                                                      Johnson & Johnson
   0.8
                                                                                                   Kimberly-Clark
   0.6
   0.4
   0.2
     0
                     2008                       2007                         2006


                                                          2008              2007            2006
                            Procter & Gamble              0.79              0.78            1.22
                            Johnson & Johnson             1.65              1.51            1.20
                            Kimberly-Clark                1.22              1.24            1.05
Source: Data and Chart constructed from each company’s 10-K Annual Report


             ▪ Quick Ratio: cash + net receivables + marketable securities/ current liabilities

   Figure 13


                                                       Quick Ratio

      1.6
                       1.41
      1.4                                          1.25
      1.2
                                                                     0.90     0.94
         1                                                                                          Procter & Gamble
                              0.70                        0.74
      0.8                                                                                           J ohnson & Johnson
                                            0.56                                     0.65
                0.52                                                                                Kimberly-Clark
      0.6
      0.4
      0.2
         0
                       2008                        2007                       2006


                                                2008             2007                2006
               Procter & Gamble                 0.52             0.56                0.90
               Johnson & Johnson                1.41             1.25                0.94
               Kimberly-Clark                   0.70             0.74                0.65
Source: Data and Chart constructed from each company’s 10-K Annual Report


             ▪ Working capital: Current assets less current liabilities


10/18/2009                                         Procter & Gamble                                  Page 43 of 87
Figure 14

                                                  Working Capital

     $15,000,000

     $10,000,000

       $5,000,000                                                                                 Procter & Gamble
                                                                                                  Johnson & Johnson
                $0                                                                                Kimberly-Clark
                                2008                  2007                    2006
      ($5,000,000)

    ($10,000,000)


                                   2008        2007                                   2006
              Procter & Gamble ($6,443,000) ($6,686,000)                            $4,344,000
              Johnson & Johnson $13,525,000 $10,108,000                             $3,814,000
              Kimberly-Clark     $1,061,000 $1,168,000                                $253,000
Source: Data and Chart constructed from each company’s 10-K Annual Report


           ▪ Times interest earned: Net income + interest exp + income tax expense divided

           by interest expense

  Figure 15

                                              Times -Interes t-Earned

     200
                                                                             175.44
     180
     160
     140
     120                                                                                           Procter & Gamble
     100                                          95.73
                                                                                                   J ohnson & Johnson
      80                                                                                           Kimberly-Clark
      60
                       29.77
      40
               8. 23           5.59        7.93           6.88        7.75            6.81
      20
       0
                       2008                       2007                        2006


                                                          2008              2007          2006
                          Procter & Gamble                8.23               7.93         7.75
                          Johnson & Johnson               29.77             95.73        175.44
                          Kimberly-Clark                  5.59               6.88         6.81
Source: Data and Chart constructed from each company’s 10-K Annual Report


10/18/2009                                        Procter & Gamble                                  Page 44 of 87
▪ Debt-equity ratio: Total liabilities/ total shareholders equity
Figure 16

                                                  Debt-to-Equity Ratio


       2 00 6


                    `
                                                                                                 K imb er ly-Cla rk
       2 00 7
                                                                                                 Jo hn son & Joh n son
                                                                                                 P rocte r & G am bl e


       2 00 8


                0        0 .5          1    1.5            2     2 .5        3            3 .5


                                                  2008           2007               2006
                    Procter & Gamble              1.07           1.07               1.16
                    Johnson & Johnson             1.00           0.87               0.79
                    Kimberly-Clark                3.40           2.34               1.80
Source: Data and Chart constructed from each company’s 10-K Annual Report


          ▪ Debt-to-Assets Ratio: total liabilities/total assets
  Figure 17

                                                  Debt-to-Assets Ratio

    0.8
                                0.73                      0.66
    0.7                                                                            0.64
    0.6                                                             0.54
                0.52 0.50                  0.52
    0.5                                            0.46
                                                                            0.44                 Procter & Gamble
    0.4                                                                                          Johnson & Johnson
    0.3                                                                                          Kimberly-Clark
    0.2
    0.1
      0
                        2008                      2007                      2006


                                                  2008           2007                2006
                Procter & Gamble                  0.52           0.52                0.54
                Johnson & Johnson                 0.50           0.46                0.44
                Kimberly-Clark                    0.73           0.66                0.64
Source: Data and Chart constructed from each company’s 10-K Annual Report


10/18/2009                                         Procter & Gamble                                Page 45 of 87
Financial Strength Conclusion: As an investor, I would like to see P&G work to

become more liquid and slightly more conservative in their use of debt to finance the

organization. JNJ again is the benchmark to compare against. JNJ has a more liquid

balance sheet and has no concern in covering interest owed. Although, P&G is not as

strong as JNJ, P&G is not leveraged as much as KMB.

2.1.5 Dividend Analysis

Figure 18


10/18/2009                         Procter & Gamble                     Page 46 of 87
Dividend Rate and Yield Ratio

    5.00%
                                                       4.08%
    4.00%
                                            3.28%
                                        2.73%                      Procter & Gamble
    3.00%                    2.40%
               1.76% 1.96%
                                                                   Johnson & Johnson
    2.00%                                                          Kimberly-Clark
    1.00%

    0.00%
                  Div idend Rate              Dividend Yield


                                  Dividend Payout Ratio

     70.00%
                                                60. 56 %
     60.00%
                       46 .41 %
     50.00%
                                   4 1.7 6%
                                                                   Proc ter & Gamble
     40.00%
                                                                   Johnson & Johnson
     30.00%
                                                                   Kimberly-Clark
     20.00%

     10.00%

      0.00%
                          D ividend Payout Ratio


                                                                             Dividend
                                                               Dividend       Payout
                                  Dividend Rate                 Yield          Ratio
Procter & Gamble                      1.76%                     2.73%         46.41%
Johnson & Johnson                     1.96%                     3.28%         41.76%
Kimberly-Clark                        2.40%                     4.08%         60.56%
Source: Data and Chart constructed from Key Financials MSN Money and Finance AOL
Dividend Analysis Conclusion: All three companies pay a reasonable dividend yield.

One can assume that since P&G’s yield is lower and growth rate higher than peers (as

identified above) that P&G is investing its earnings back into the organization. KMB


10/18/2009                                           Procter & Gamble                   Page 47 of 87
which has a high Debt to Asset ratio is choosing to pay its shareholders rather than fund

its operation. JNJ appears to be a healthy blend between the two.


2.1.6 Management Efficiency Analysis

  Figure 19

                                            Management Efficiency

    120
    100
     80                                                                                      Pro cter & G amble
     60                                                                                      Johnson & Johnson
     40                                                                                      Kim berly-Clark
     20
      0
            Days in      Inventory       Avg.        Return on       Return on   Return on
           In ventory    Turnover      Collection    Equit y (pe r    As se ts   I nvested
                                        Period         share)                     Ca pital


                                                                          Return on
                                                            Avg.           Equity Return Return on
                   Days in               Inventory        Collection         (per     on   Invested
                  Inventory              Turnover          Period          share)   Assets  Capital
Procter & Gamble    75.48                   4.84            38.35           17.62   10.24    13.85
Johnson & Johnson   99.62                   3.66            75.29           30.22   15.98    24.68
Kimberly-Clark      67.12                   5.44            49.31           37.35    9.82    16.09
Source: Data and Chart constructed from Finance AOL and each company’s 10-K annual report


Management Efficiency Conclusion: Although P&G is not the lagging in all

measurements, they are behind in return on equity. JNJ has a strong return due to the

strength of their operation. KMB has chosen to limit the shares outstanding and finance a

large percentage of the organization; as a result their return on equity is high. P&G is a

solid performer in the middle of the pack and could use its peers to benchmark against.


2.1.7 Stock Price Analysis

          According to MorningStar.com Procter & Gamble stock opened at $57.37 on

October 13, 2009. Procter & Gamble’s stock price closed at $57.26. By the end of the


10/18/2009                                          Procter & Gamble                            Page 48 of 87
trading day P&G had a volume of 11.28 million shares and a 52wk range is $43.93 to

$66.82 as per figure below.

 Figure 20


Source: http://www.wikinvest.com/stock/Procter_%26_Gamble_Company_(PG)/WikiChart


        MorningStar.com also reported that Kimberly-Clark’s stock opened at $59.38 on

October 13, 2009. KMB’s stock price closed at $59.01. By the end of the trading day

KMB had a volume of 1.81 million shares and a 52wk range is $43.05 to $62.05 as per

figure below.

 Figure 21


Source: http://www.wikinvest.com/stock/Kimberly-Clark_(KMB)/WikiChart?ref=topnav


        Johnson & Johnson’s stock price opened at $60.92, on October 13, 2009. JNJ’s

stock price closed at $61.01. By the end of the trading day JNJ had a volume of 23.50

million shares and a 52wk range is $46.25 to $63.01 as per figure below.


Figure 22


10/18/2009                                Procter & Gamble                         Page 49 of 87
Source: http://www.wikinvest.com/stock/JOHNSON_%26_JOHNSON_(JNJ)/WikiChart


Stock Price Analysis: JNJ has the largest market capitalization of the three and appears

to be a more liquid asset (since the trading volume is significantly more). Based on the

analysis performed above, one would expect JNJ to demand a higher stock price and the

other two close behind. Also, based on KMB highly leveraged position, one would

expect its stock price to be more volatile than PG, and based on this one day snap shot,

this hypothesis holds true.

2.1.8 Summary of Financial Analysis

        P&G’s stock price in relation to its peers sums up all the financial ratios in

comparison to KMB and JNJ. While PG has certain strong ratios, PG is not an industry

leader. JNJ is the most financially sound of the three companies and KMB has a higher

Owner’s equity return (but are more risky due to leveraging). PG is a solid blend that is

demonstrating strong growth compared to its peers, and appears to be a solid value play

for investors.

2.2.0 Strategic Analysis

        Strategic analysis consists of measuring the strengths and weaknesses of a

company's position. There are a number of tools or methods used as the foundation for

strategic analysis of a business. Understanding and analyzing all these factors is crucial

to developing current strengths into competitive advantages over competition and

improving certain weaknesses that hinder a company's efficiency and growth. An

organization's core competencies should be focused on satisfying customer needs or


10/18/2009                             Procter & Gamble                      Page 50 of 87
preferences in order to achieve above average returns. This is done through Business-

level strategies. Business level strategy is an integrated and coordinated set of

commitments and actions a firm uses to gain a competitive advantage by utilizing its core

competencies in specific product markets.

2.2.1 Current Business Level Strategy

       P&G is a global manufacturer and marketer of consumer products. The company

markets more than 300 brands in over 180 countries spanning Americas, Europe, the

Middle East and Africa, and Asian region. The company is currently organized into three

separate Global Business Units (GBUs. The three GBUs are: Beauty, Health and Well-

Being, and Household care.

Figure 23


10/18/2009                           Procter & Gamble                      Page 51 of 87
Procter &
                                                            Gamble


                                                           Health and
                                                                                                      Household
                Beauty GBU                                 W ell-B eing
                                                                                                      Care GBU
                                                              GB U


                                                                    Sn acks, Coffee,   Fabric Care and        Baby Care and
      Beau ty             Groo ming           H ealth Care
                                                                     and Pet Care        H ome Care            Family Care


                                                                                            A riel
     H ead &
                             Braun              Acto nel                                   Dawn                   Bo un ty
    Shou ld ers
                             Fusion             Always                     Iams            Down y                 Charmin
      Olay
                             Gillette            Crest                    Prin gles       D uracell               Pampers
     Pan tene
      Wella                  M ach 3            O ral-B                                     Gain
                                                                                            T id e


Source: Organizational Chart constructed from P&G’s 10-K annual report


2.2.2 Elements of Company’s Strategy

           P&G new CEO Bob McDonald, who assumed office in July, has laid out P&G

new company strategy which will be centered on company values and a sense of purpose.

McDonald said that P&G will “focus on touching and improving more consumers' lives

in more parts of the world... more completely."

           McDonald calls P&G's purpose the most consistent factor in a 171-year history of

the company. He said P&G will continue to provide branded products of superior quality


10/18/2009                                        Procter & Gamble                                       Page 52 of 87
and value that improve the lives of the world's consumers, now and for generations to

come. He believes that as a result of P&G’s new company strategy will cause consumers

to reward P&G with leadership sales, profit and value creations, and “allowing our

people, our shareholders, and the communities in which we live and work to prosper."

(Kanter, 2009)

2.2.3 Components of Company’s Business Level Strategy

Efforts to build competitive advantage

       In an effort to continue its global leadership position and create an additional

competitive advantage, P&G has partnered with Cisco System to help develop its next

phase in supply chain management “Smart Packaging”.

       “Smart Packaging,” is a highly innovative system that will enable the company to

look at its supply chain from a consumer’s perspective. Smart Packaging will embed a

chip into every item in the store, providing more information than today's standard

barcodes. By creating an easy way to track products through the factory, on delivery

trucks, and in the stores, this innovation will dramatically increase supply chain

efficiency. Smart-chip technology will result in fewer out-of-stocks, greater on-time

delivery, better products, and an enhanced user experience for consumers (Procter &

Gamble, 2002).

Collaborative partnerships and strategic alliance

       P&G will outsource its worldwide print operations to Xerox. This collaborative

partnership with Xerox will allow P&G to reduce operational costs by an estimated 20-25

percent. The five-year services contract calls for Xerox to manage P&G's print shops,

offices and home-based work settings. Working with Xerox, P&G has the opportunity to

deliver substantial sustainability benefits in addition to cost savings and increased user


10/18/2009                           Procter & Gamble                      Page 53 of 87
satisfaction and reliability. P&G predicts it will reduce print-related power usage by 30

percent and paper consumption by 20-30 percent annually. (Xerox.com)

Distribution

       P&G is currently working with i2 Technologies to support the physical

distribution of its North American operations. Utilizing the i2 Freight Matrix

transportation solution, P&G is working to drive efficiency across its finished product

logistics through improved carrier selection, event management and dashboard reporting.

Human Resource Strategy

   Procter and Gamble view their more than 138,000 employees as the most important

asset of the company and encourage them to have the same values and principles as the

company. All employees of Procter and Gamble are considered leaders and encouraged

to take responsibility to do the best that they can while meeting business needs, bettering

the system and helping those around them (PG.com). According to P&G’s 2009 Annual

Report, its human resource strategy is built of five core values:

   I. Hire the Best

   P&G claim that almost 500,000 people apply for P&G jobs every year and that they
   normally only hire less than 1% of those applicants. P&G believes that it attracts top
   talent because of its reputation as a great company for current and future leaders

   II. Challenge P&G People from Day One

   P&G has learned that “there’s no substitute for hands-on experience when it comes to
   leadership development.” To help develop this leadership P&G has created
   consequential responsibilities for every employee. Its assignments typically demand
   collaboration inside and outside the Company, disciplined project management and
   the need to be in touch with consumers, retail customers and other external
   stakeholders.

   III. Business and Functional Leaders Actively Recruit, Teach and Coach

   At P&G, leadership by example starts from the top. P&G’s Chairman of the Board
   and former CEO A.G. Lafley, Corporate Officers, Presidents and Functional Officers
   recruit on college campuses and teach in their executive education programs. These


10/18/2009                           Procter & Gamble                     Page 54 of 87
senior executives also act as mentors and coaches for younger managers, helping
   them develop the skills necessary to lead large businesses and organizations.

   IV. Plan Careers

   P&G believes in creating career opportunities and not just jobs. P&G has been very
   successful in managing its talent globally and enable career development and growth
   across businesses and geographies. P&G tries to identify talent early on and groom
   people through a series of varied and enriching assignments that will prepare them for
   future roles.

   V. Never Stop Learning

   P&G provides a plethora opportunities to develop technical, functional and leadership
   skills training. These programs are offered at different level of development or new
   assignments. This process not only helps P&G people develop business skills but
   also deepens their commitment to touching and improving P&G’s consumers’ lives.

R&D, Technology, engineering strategy

       As part of its ongoing initiative to be a supply chain leader and optimize trading

partner relationships, P&G uses Axway’s business-to-business (B2B) solution for their

external managed file transfers. The solution delivers secure file transfer with real-time

visibility and control, improving communication within and outside P&G. It also offers

the agility P&G needs to respond quickly to changes in its supply chain.

       Currently, orders, invoices, shipment notifications and other message files flow

through the Axway gateway daily at P&G, for a total of more than one million files per

month, all of which must be processed automatically and on time for business to flow.

Transmission failures and system downtime would interrupt P&G’s entire supply chain,

negatively impacting production and revenue (Procter & Gamble to Deploy I.D., 2009).

Sales, Marketing & Promotion

       P&G is reinventing marketing in a digital world, by using innovative Web-based

techniques to improve its already considerable consumer listening capabilities. P&G is

now conducting online consumer research and concept studies that dramatically reduce


10/18/2009                          Procter & Gamble                       Page 55 of 87
the time required to gather and analyze consumer opinions. Best of all, online consumer

research reduces costs yet delivers highly reliable results that enable P&G to get to

market faster with new products that customers will buy, all critical success factors in its

business-to-consumer strategy.

       Current Chairman of the Board, A.G. Lafley, stated that “A year or two ago, we

would do thousands of concept tests and consumer panels worldwide, which would take

six to eight weeks. Today we do the majority of our concept tests in 48 to 72 hours online

at a fraction of the cost and with equal or higher reliability. That's the kind of power the

Internet can bring” (Procter & Gamble, 2002).

Moves to respond and react to changing conditions

       With an eye toward expanding retail coverage and providing better service at

lower cost, P&G implemented an online system called “Web Order Management” that

enables retail customers to connect directly to P&G anytime, from anywhere. This online

business-to-business (B2B) network gives retailers full access to P&G promotions,

inventory, and scheduling information. It also allows retailers to easily place and manage

orders on the Web.

2.2.4 How well the Company’s Strategy is working

       P&G has leading market positions across most of its businesses. It competes

primarily in 22 global product categories and is a market leader in over two-thirds of

these categories. P&G is the global market leader in beauty segment with leading market

shares of over 20% and 33% in the hair care and feminine care categories respectively,

owing to its brands Always, Head & Shoulders, Olay, Pantene and Wella. The company

also holds a leading position in oral care. In pharmaceuticals and personal health, P&G

has approximately 33% of the global bisphosphonates market for the treatment of


10/18/2009                           Procter & Gamble                       Page 56 of 87
osteoporosis under the Actonel brand. The company is also a global leader in

nonprescription heartburn medications and in respiratory treatments. Actonel, Crest, and

Oral-B are well known brands in the company's health care segment. The company is

also the market leader in fabric care with global market share of approximately 33%, with

key brands such as Ariel and Tide. In baby care, the company has a global market share

of over 32%, competing through the strong Pampers brand. The acquisition of Gillette

has enabled P&G to hold leading market share in manual blades and razors segment with

a global market share of approximately 70%. Leading market position provides it with

significant competitive advantage as well as stabilizes the company's financial growth.

2.2.5 Summary of Strategic Analysis

       New President and C.E.O. of Procter & Gamble, Bob McDonald, has laid out the

strategic focus of P&G for the next decade. McDonald says that P&G will refocus its

energy on bettering its relationships with retailers, suppliers, and innovation partners

while continuing to provide innovative products to customers worldwide. McDonald

says that P&G is positioned to “grow by touching and improving the lives of more

consumers in more parts of the world…more completely.” In order to fulfill this new

promise P&G will have to focus on building its market share with its core brands, expand

its product portfolios, and increase market share in emerging markets.

       P&G will also have to better control its pricing and reduce outside vendors like

Wal-Mart’s ability to dictate its product’s pricing. They will also want to leverage their

competitive strengths and economies of scale by using new technological advancement to

improve their supply chain efficiency. Finally, P&G will want to continue its strong

support and funding of its world class research and development in order to continue to

provide innovative products to touch the lives of customers worldwide.


10/18/2009                           Procter & Gamble                      Page 57 of 87
2.3.0 Value Chain Analysis

          The Value Chain Analysis has been utilized in both organizational and business

studies for many decades. This fundamental approach allows a company such as P&G to

obtain a competitive advantage over the other competitors in the industry. Specifically,

the value chain analysis is a process that starts from the acquisition of the raw materials

to the actual physical products sold by the company. The figure below illustrates the

current household and personal care industry supply chain. In the context of a diversified

business, the context of the value chain and the individual activities involved in the

process are imperative in determining strategic benefits. Value Chain activities include:

inbound logistics, technology, operations, sales and marketing, distribution, and service.

Figure 24


Source: Chart constructed from An International Journal


2.3.1 Analysis of Primary Activities


10/18/2009                                          Procter & Gamble       Page 58 of 87
P & G developed extensive economies from its scale of operations in finance,

logistics, marketing, research, new product development, innovation, technology and

other functions. It is the global leader in all its four core categories - fabric and home

care, beauty care, baby and family care, health care. Its products are sold in over 160

countries worldwide with manufacturing capabilities in over 42 countries. The company

manufactures and markets close to 300 products. P & G also significant buying power

from commodities to media and is being gradually leveraged through global procurement

and services. A large scale gives P&G important competitive advantages against the

smaller, capital restricted players in both the local and global markets.

Supply Chain Management

       Procter & Gamble, a world leader in consumer packaged goods, sells nearly 300

brands in more than 160 countries. It has sales of $40 billion a year and 130

manufacturing sites around the world. P&G measures consumer satisfaction at two levels,

which it calls the two “moments of truth.” The first moment of truth occurs when the

consumer reaches the shelf and finds that the desired product is, or is not, available. This

is a critical moment, because if the product is not immediately available, the consumer

usually moves on to buy a rival product. The second moment of truth depends on the

buyer’s satisfaction when consuming the product.

       Optimizing supply chain performance demands a drastic new look at the way the

partners in the supply network collaborate, involving retailers, manufacturers and service

providers. P &G’s goal has been to create adaptive, reactive supply networks that will

link together sales and supply processes, inside and outside the organization, to improve

product availability. If successful, this would allow P & G to develop demand chain

management capabilities, especially for promotions. Promotional items are the highest


10/18/2009                           Procter & Gamble                       Page 59 of 87
priority for P & G, because of the large sum of money involved in its marketing

programs. If manufacturers cannot deliver the product on time all of the time, they lose

all the growth that should be generated by their marketing promotions.

Operations

       P&G is a global manufacturer and marketer of consumer products. The company

markets more than 300 brands in over 180 countries spanning Americas, Europe, the

Middle East and Africa (EMEA), and Asian region. The company is organized into three

Global Business Units (GBUs) and a Global Operations group. The three GBUs are

beauty, health and well-being, and household care. The Global Operations group consists

of the Market Development Organization (MDO) and Global Business Services (GBS).

Distribution

       Links between supply chain planning and supply chain execution processes are

critical for P & G continued success. P&G expects major changes in the transportation

area, including improved partnership with logistics outsourcers and more use of

techniques such as cross-docking. This system, under which inbound trucks are unloaded

and the goods are sorted and loaded straight onto outbound vehicles, without ever being

put into store, will be used to drastically cut inventory and handling costs, as well as

delivery times. Daily planning will be phased out for a more efficient continuous plan-

make-ship process, which will demand improved loading techniques to make efficient

use of vehicles as shipment sizes become smaller.

Sales and Marketing

       Currently, P&G sales and markets over 300 brands in over 180 countries to over 4

billion customers. Twenty-three of these brands are categorized by P&G as “Billion-

Dollar Brands.” To be categorized at a “Billion-Dollar-Brand” a product must generate


10/18/2009                           Procter & Gamble                      Page 60 of 87
more than one billion dollars in sales each year. The chart below represents the dollar

amount and percentage of net sales for the three GBUs.

Figure 25
                                                                                      Net Sales
GBU                      Reportable Segment           Billion-Dollar Brands           (in bi llio ns)

                                                      Head & Shoulders, Olay,
Beauty                   Beauty                       Pantene, Wella                             $26.3
                                                      Braun, Fusion, Gillette,
                         Grooming                     Mach3
                                                      Actonel, Always, Crest,
Health and Well-Being Health Care                     Oral-B                                     $16.7
                      Snacks and Pet Care             Iams, Pringles
                      Fabric Care and Home            Ariel, Dawn, Downy,
Household Care        Cared                           Duracell, Gain, Tide                       $37.3
                         Bab y Care and Fa mily       Bounty, Charmin,
                         Care                         Pampers
Source: PG.com


 Figure 26

                             2009 GBU Net Sales


                                        33%
                                                              Beauty
                 46%
                                                              Health and Well-Being
                                                              Household Care


                                  21%


Source PG.com


         Jake Barr who is in charge of supply chain innovation at P&G says that some

60% of P&G’s sales come from what he calls "events." Barr says that these are

promotions that the supermarket, convenience store or other retailer executes with price

cuts or other incentives; or they take the form of discount coupons and price promotions

mailed out or distributed in a store by P&G itself.

10/18/2009                          Procter & Gamble                           Page 61 of 87
In the past, P&G would use what Barr called a "push" system for moving

products out the store door. Independent of what retailers were doing, P&G typically

forecast sales for its major product. Then P&G would tweak sales throughout the year by

offering and distributing coupons and other incentives designed to entice enough

customers to buy, moving products off store shelves.

       But with the majority of sales now coming from promotional events, Barr and his

Global Product Supply team studied the pull systems of efficient distributors of consumer

and industrial products. When Barr's team started to tackle the problem of shifting from

a push system to a pull system, their main focus was to take the disorder and confusion

out of the delivery system by bringing retailers and suppliers into the planning and

delivery process. With everyone on the same page, Barr said that the "signals" of

consumer demand would come from the stores; "responses" would come from P&G

manufacturing managers, supply chain managers and suppliers, who would key

production of new products to sales reports coming from the stores. With the new system

in place Barr says that “The fact that our sales of P&G products are up 15% in the past

year tells you how effective this system is."

Service

       P&G places emphasis on its principal business goal of providing its customers

with the right products at the right price all the time. The company spends over $80

million dollars a year on advertising its products. The company has 5,000 key retailers

and more than 30,000 key suppliers to help make sure that its products are always in

stock and ready for purchase.

2.3.2 Analysis of Support Activities

Product R&D


10/18/2009                           Procter & Gamble                    Page 62 of 87
Product R&D has been the most important factor in Procter and Gamble’s

legendary 172 year history. P&G believes that outstanding products are created by

outstanding people. Within R&D, P&G has a strong commitment to find the best

researchers, and retain them with a culture designed to reward success, stimulate

learning, challenge complacency and nurture innovation. P&G currently holds more than

25,000 active patents worldwide and it draws upon the talent of its 7,500 Ph.D.s with

researchers in over 71 countries. On average P&G invests up to 4% of worldwide sales

to the R&D department every year.

Human Resource Management

       P&G has a long history of human resource practices that have supported high

effectiveness in R&D. No factor has played a more important role in the success of R&D

at P&G than its record of hiring and retaining some of the most talented people in the

industry. P&G employees and R&D staff members are rewarded and acknowledged for

their contributions through financial compensation, promotions, freedom to influence

project selection and financial support for their projects.

       P&G offers extensive training programs to assist its employees to achieve both

personal and professional goals. These programs include self-directed training for high-

potential junior staff; global training programs on how to manage the innovation process;

internal technical symposiums to share knowledge and keep personnel at the forefront of

technical disciplines; a worldwide electronic system of communications for sharing

knowledge; and a liberal policy for attending outside professional society and other

technical meetings (PG.com).

General Administration


10/18/2009                           Procter & Gamble                   Page 63 of 87
P&G uses I.D. Systems, Inc.’s Vehicle Management Systems (VMS) to help

improve workplace safety and security by restricting vehicle access to trained, authorized

operators, providing electronic vehicle inspection checklists, and sensing vehicle impacts.

VMS helps P&G reduce fleet maintenance costs by automatically uploading vehicle data,

reporting vehicle problems electronically, scheduling maintenance according to actual

vehicle usage rather than by calendar or manual data entry, and helping determine the

optimal economic time to replace equipment. In addition, VMS helps improve P&G

supply chain productivity by establishing accountability for the use of equipment,

ensuring equipment is in the proper place at the right time, streamlining material handling

work flow, and providing unique metrics on equipment utilization. (Procter and Gamble

to Deploy I.D., 2009)

2.3.3 Analysis of Company’s Cost Competitiveness in relation to Rivals

       The consumer household and personal care product industry is a highly

competitive industry. The global household and personal products industry consists of the

global household products and global personal product markets. Players are

manufacturers of fragrances, hair care, make-up, oral hygiene, personal hygiene and

skincare, air fresheners, bleach, dishwashing products, furniture polish, general purpose

cleaners, insecticides, scouring products, textile washing products and toilet care

products. Perhaps the three most significant competitors are Procter and Gamble (P&G),

Johnson & Johnson (JNJ) and Kimberly-Clark (KMB).

       Procter and Gamble because of its sheer economies of scale, number of products,

research and development expenditures, and sheer size has allowed it to become the

global market leader in this industry.   In fact, P&G is sometimes characterized as a

category killer in its particular industry segment. P&G dominates the consumer product


10/18/2009                           Procter & Gamble                     Page 64 of 87
goods industry with $83,503 million in revenues reported for its most recent SEC filing

(Procter, 2008) P&G owns and operates 39 manufacturing facilities in the US located in

23 different states. Furthermore, the company owns and operates a total of 103

manufacturing facilities in 42 countries and employs over 138,000 employees. P&G

manufactures beauty products (42 locations), grooming products (13); fabric care and

home care products (49); baby care and family care products (29); pet care, snacks and

coffee products (15); and health care products (37). P&G sells its products through mass

merchandisers, grocery stores, membership club stores, drug stores and in high-frequency

stores.

          Johnson & Johnson (J&J) is a global manufacturer of health care products as well

as a provider of related services. JNJ has more than 250 operating companies in 57

countries employing 117,000 people. The company operates predominantly through three

divisions: consumer, pharmaceuticals and medical devices and diagnostics. Johnson &

Johnson Consumer specializes in producing and marketing well known brands of

personal care, baby care, wound care, skin care, oral care, wound care, women's health

care, nutritional and over-the-counter pharmaceutical products. These products are

distributed either through wholesalers or directly to independent and chain retail outlets.

Johnson & Johnson was second in the industry with a reported $63,747 million in

revenues. Johnson & Johnson also sells its products through grocery stores, membership

clubs, drug stores, and mass merchandisers.

          Kimberly-Clark is also one of the leading consumer product companies in the

world. It has operations in 38 countries and sells its products in more than 150 countries

and employing 53,000 people. The company's business is divided into four segments:

personal care, consumer tissue, K-C professional (Kimberly-Clark professional) and


10/18/2009                           Procter & Gamble                     Page 65 of 87
other, and health care. It currently holds the first or the second position globally in terms

of market share in more than 80 countries. KMB recorded revenues of $19,415 million

during the 2008 financial year that ended in December. The company sells its products

directly, and through wholesalers, to supermarkets, mass merchandisers, drugstores,

warehouse clubs, variety and department stores and other retail outlets.

       Procter and Gamble will continue to rely on its economies of scale and market

specialization to help achieve cost competitiveness in relation to its rivals.

2.3.4 Summary of Value Chain Analysis

       Excellence in supply chain management is an important component of corporate

strategy at Procter & Gamble. The company has been in the forefront of implementing

superior supply chain practices in concert with its suppliers and customers, with practices

that have led to savings across the entire supply chain spectrum for the benefit of the end

consumer. Procter & Gamble continuous market dominance will be largely dependent on

its ability to use technological advancement to create more adaptive, reactive supply

networks that will link together sales and supply processes, inside and outside the

organization, to improve product availability. In order to achieve this goal P&G will

have to work with outside vendors and consultants to establish best in market practices to

create strategic competitive advantages that will be hard for its competitors to duplicate.

In addition to outside assistance, P&G will have to make sure information flows freely

between front line employees, top management, and the R&D department in order to

provide the best products available to customers worldwide.

2.4.0 SWOT Analysis

       SWOT Analysis, is a strategic planning tool used to evaluate the Strengths,

Weaknesses, Opportunities, and Threats of an organization. It involves specifying the


10/18/2009                           Procter & Gamble                       Page 66 of 87
objective of the business venture or project and identifying the internal and external

factors that are favorable and unfavorable to achieving that objective.

       The aim of any SWOT analysis is to identify the key internal and external factors

that are important to achieving the objective. SWOT analysis groups key pieces of

information into two main categories: Internal and External factors.

       The internal factors may be viewed as strengths or weaknesses depending upon

their impact on the organizations objectives. What may represent strengths with respect

to one objective may be weaknesses for another objective. The external factors may

include macroeconomic matters, technological change, legislation, and socio-cultural

changes, as well as changes in the marketplace or competitive position.

2.4.1 Strengths

▪ Strong Brand Name
       P&G is the world's largest consumer goods company that markets more than 300

brands in over 180 countries. Some of P&G most successful and famous brands include:

Pampers, Tide, Ariel, Always, Whisper, Pantene, Bounty, Pringles, Folgers, Charmin,

Downy, Lenor, Iams, Crest, Clairol Nice ’n Easy, Actonel, Dawn and Olay. According to

P&G’s strong brand leadership enables brand building innovations with retail and media

partners giving a distinct competitive advantage (Bannister 2006).

▪ Research and Development
       P&G has strong research and development capacity with nearly 7,500 PhD’s and

researchers in over 71 different countries. P&G has over 20 technical centers on four

continents and more than 25,000 active patents for its products. In 2005, P&G invested

$1.8 billion dollars, which was 3.5% of Net Outside Sales in research and development.


10/18/2009                          Procter & Gamble                      Page 67 of 87
Over the past eight years, P&G has introduced the number one or number two new non-

food products every year (Buckley 2006).

▪ Global Operations
       P&G has global operations and is able to derive substantial economies in finance,

logistics, marketing, research, new product development, innovation, technology and

other functions. The company’s huge buying power (from commodities to media) also

enables it to leverage through global procurement and gives significant competitive

advantage against the smaller, unorganized players in different markets.

▪ Strong Distribution Infrastructure
       The company has a very strong distribution infrastructure consisting of exclusive

distributors worldwide selling only P&G products enabling the company to market faster

and more efficiently, without multiple wholesaler markups that typically occur under the

wholesaler system.

▪ Strong performance in core businesses
       On a worldwide basis, fabric & home care, beauty care, and baby & family care

products are P&G’s largest businesses, contributing a total of roughly 80% of company

sales (Roberts, 2006). Strong performance by its core business groups has contributed to

the company’s above industry average revenue growth rates.

2.4.2 Weakness

▪ Lack of diversified customer portfolio
       P&G’s top 10 customers account for 35% of its sales. Thus, the company’s

revenues are concentrated among a few top customers, which could be a weakness for the

company in the case that any of these top customers experiences any financial difficulties

in the future. Wal-Mart is P&G’s largest customer and accounted for over 15% of P&G

total revenue in 2009, 2008, and 2007 (Procter & Gamble, 2009).


10/18/2009                          Procter & Gamble                       Page 68 of 87
▪ Overdependence on mature markets
       P&G has been focusing quite a lot on mature markets like USA and Western

Europe with 26% and 22% of company’s sales respectively (Bannister 2006). On the

other hand, the sales in the emerging markets is 35% of sales only and the weakness of

P&G is that not much effort has been put in growing in the these emerging markets,

which could hamper the growth of the company in the future.

▪ Quality Control
       Procter and Gamble has quality control problems with some of their products.

They have placed recalls on certain products such as Swiffer Vacuum Cleaner and pet

food for dogs and cats. If they have continual recalls, it could tarnish their brand image

leading to lower customer loyalty (PG.com).

2.4.3 Opportunities

▪ Emerging, developing markets
       The emerging markets of Latin America, China, India, Middle East, Korea, and

trading bloc of ASEAN present significant opportunities for P&G because of the growth

in incomes, an emerging middle class, and household formulations. These factors will

drive the emerging markets and will make them more attractive in the future especially

for the consumer products manufacturing companies like P&G. The markets of Eastern

Europe and the People's Republic of China are among those offering huge potential as

their populations become more affluent.

 Figure 27


10/18/2009                          Procter & Gamble                      Page 69 of 87
2009 Net Sales by Geographic Region


                                                             North America
                   32%
                                                             Western Europe
                                          43%

                                                             Japan

                     4%                                      Emerging/Developing
                                                             Markets
                                 21%


Source: P&G Annual 10-K Report

▪ Acquisitions and resultant value generation
         P&G has grown through acquisitions in the past and further acquisition

opportunities will be available for the company. However, a more important factor is the

set of opportunities these acquisitions provide for P&G. The recent acquisition of Gillette

provided P&G with other brand named products like Duracell batteries and Braun

shavers and razors. P&G will benefit the latter from synergies in emerging markets

according to Jones (2006), cross-leveraging shaving and skin care market segment and

add value to P&G.

▪ Sell or Spinoff of Assets

         The sell of some assets such as Duracell batteries, Braun, Folgers coffee, Pringles

chips, and pet food business including Iams and Eukanuba could allow P&G to

streamline its portfolio and return cash to shareholders or increase its financial bottom

line. According to Lauren Lieberman, an analyst at Lehman Brothers, a recent article in

the New York Times, “P&G could pull in after-tax proceeds of $4.1 billion for Duracell,

$1.5 billion for Braun, $4.1 billion for coffee and snacks and more than $2 billion for the

pet-food business.” P&G could also decide to leverage a spinoff of these companies

10/18/2009                             Procter & Gamble                   Page 70 of 87
instead of selling the outright. Lieberman says that “a reverse leveraged spinoff, which

often includes an investment from a private equity firm, or as a “supercharged I.P.O.,”

which is how General Electric split off its Genworth Financial subsidiary” (Should

Procter, 2007).

2.4.1 Threats
▪ Intense competition
       The markets in which P&G operates are very competitive with players like

Johnson & Johnson, Unilever and Kimberly-Clark (Bartlett, 2005). This could be a

competitive threat for P&G as these competitors continually innovate and price their

products competitively. An increase in competitive onslaught by a majority of these

competitors is expected to be a further threat to P&G’s growth.

▪ Increase in Cost of Raw materials
       P&G depends heavily on a wide basket of global commodities for manufacturing

its goods, the prices for which have risen nearly 50% since 2002. Nearly half of the

company's cost of goods is directly related to commodity goods. The company has

increased prices due to higher costs of oil and other raw materials. During one of its most

recent conference call with analyst, P&G stated that it expected raw material costs to

increase $3 billion in 2009.

▪ Current Credit Crisis
       P&G currently generates significant operating cash flows, which combined with

access to the credit markets provides them with significant discretionary funding

capacity. However, current uncertainty in global economic conditions, resulting from

disruptions in credit markets, poses a risk to the overall economy that could impact

consumer and customer demand for P&G’s products, as well as its ability to manage


10/18/2009                          Procter & Gamble                     Page 71 of 87
normal commercial relationships with its customers, suppliers and creditors, including

financial institutions.

        If the current situation deteriorates significantly, P&G business could be

negatively impacted, including such areas as reduced demand for the company’s products

from a slow-down in the general economy, supplier or customer disruptions resulting

from tighter credit markets and/or temporary interruptions in its ability to conduct day-to-

day transactions through their financial intermediaries involving the payment to or

collection of funds from its customers, vendors and suppliers. If the current credit crisis

were to continue to worsen such that the company were unable to access the credit

market, it could impair its ability to fund discretionary spending.

▪ Technology Infrastructure
        P&G rely extensively on information technology systems in relation to their

current computer network. Some of these systems are managed and controlled by third-

party service providers (3PSP). These systems are critically important as they allow

P&G to communicate and interact with both internal and external stakeholders. These

interactions include, but are not limited to, ordering and managing materials from

suppliers, converting materials to finished products, shipping product to customers,

processing transactions, summarizing and reporting results of operations, complying with

regulatory, legal or tax requirements, and other processes necessary to manage the

business. P&G insists that if their systems are damaged or cease to function properly due

to any number of causes including power outages and security breaches, they may suffer

interruptions in their ability to effectively manage operations which may negatively

impact their operations and/or financial condition.

▪ Government Regulation Changes


10/18/2009                           Procter & Gamble                      Page 72 of 87
Since P&G is a U.S. based multinational company, it is subjected to changes in

laws and regulations in both U.S. and other foreign governments. P&G states that such

changes can significantly alter the environment in which it operates. Failure to

successfully manage these changes can result substantial fines and penalties that will

affect their financial results.

2.4.5 Summary of SWOT Analysis

        SWOT analysis is a general technique for assessing any public or private

organization and its environment. It belongs to the “Analysis” part of a strategic planning

process and helps decision-makers to focus on key issues. Performing a SWOT analysis

involves the generation and recording of the strengths, weaknesses, opportunities and

threats concerning the organization.

        The decline of the US dollar to foreign currencies makes international trading

promising due to the changeover of exchange rates. P&G must continue to scan the

environment for new trends, technological advancements, political threats, and combat

counterfeit products.

        In Summary, Procter and Gamble has an enormous opportunity for continued

growth and market dominance. To keep its current percentages of market share, P&G

needs to place high priority on research and product development and new product

innovation activities. Marketing strategies and brand name awareness will continue to set

P&G apart from its competitors. An important growth factor is the implementation of

their products to internationally emerging markets such as Latin America, India and

China. These emerging markets have projected higher population rates and a growing

middle class society. Growth in foreign markets will provide P&G with strong future


10/18/2009                             Procter & Gamble                  Page 73 of 87
revenue, along with its “recession-proof” products available to consumers worldwide.

Table 5 blow is a summary of P&G SWOT Analysis.


Table 7
 Strengths                                   Opportunities
 ▪ Strong Brand                              ▪ Emerging Developing Markets
 ▪ Research & Development                    ▪ Acquisitions
 ▪ Global Operations                         ▪ Sell or Spinoff of Assets
 ▪ Strong Market Infrastructure
 ▪ Strong Performance in Core Business


 Weakness                                    Threats
 ▪ Lack of Diversified Customer Portfolio    ▪ Intense Competition
 ▪ Overdependence on Mature Markets          ▪ Increase in Cost of Raw Materials
 ▪ Quality Control                           ▪ Credit Crisis
                                             ▪ Technology Infrastructure
                                             ▪ Government Regulation Changes


10/18/2009                         Procter & Gamble                   Page 74 of 87
3.0 References

America.gov (2009). Retrieved October 5, 2009, from http://www.america.gov

Bannister, L (2006) P&G creates branded content, Harvard Business Review, 33 (2),
       pp. 2-5.

Bartlett, C., Ghoshal, S. (2005) Managing across Borders: the Transnational
        Solution, Journal of Marketing, 45(2), Boston: Harvard Business School Press.

Buckley, N. (2005) ‘Reconditioned P&G is continuing to shine’, Financial Times, pp. 30-
      31

Buckley, N., (2006) ‘Change of focus boosts P&G’, Financial Times, pp. 45-46

Company Spotlight: Procter & Gamble. (2007). Datamonitor. pp.20-26

Grant, J. (2006) ‘We can build a juggernaut – P&G and Gillette lead the way through a
        new retail landscape’, Financial Times.

Household & Personal Products Industry Profile: Global. (2008). Datamonitor, April,
      p.1-28.

Household & Personal Products Industry Profile: Global. (2008). Datamonitor, Jan, p.1-
      27.

IMF says U.S. recession will slow global growth. (2008) Associated Press. Retrieved
      October 2, 2009 from http://www.msnbc.msn.com/id/24032732//

Jones, A. (2005) ‘Consumed by the consumer’, Financial Times, pp.23-25

Johnson & Johnson (2009). 2008 Annual Report. Retrieved September 28, 2009, from
      www.sec.gov

Johnson, G., Scholes, K. (2006) Exploring Corporate Strategy, 8th ed, London: Pearson.

Kahl, K. & Berquist, P. (2000). A Primer on the Internet Supply Chain. Supply Chain
       Management Review. Retrieved October 2, 2009 from
       http://www.scmr.com/article/CA629930.html


Kanter, R.M. (2009). Inside Procter & Gamble’s New Values-Based Strategy. Harvard


10/18/2009                         Procter & Gamble                    Page 75 of 87
Business Publishing. Retrieved October 14, 2009, from
       http://blogs.harvardbusiness.org/kanter/2009/09/fall-like-a-lehman-rise-like-
       a.html


Kellerhals, Jr., M.D. (2009) U.S. Economy Should Improve in Late 2009, Fed Chair
       Bernanke Says. American.gov. Retrieved October 1st, 2009, from
       http://www.america.gov/st/business-
       english/2009/May/20090505115000dmslahrellek0.4212152.html

Kimberly-Clark Corporation (2009). 2008 Annual Report. Retrieved September 28, 2009,
      from www.sec.gov

Kumar, S., & Bennett, K. (2003). Global Operations and Logistics Trends in the
      Household and Personal Care Products Market. An International Journal, 4,
      pp.10-20.

Market Watch (2006), P&G: brewing battle, 3 (4), pp. 9-21.

McGowan, E (2006) Corporate Profile :Procter and Gamble, Academy of Management
     Journal,12 (8), pp. 20-28.

Miller, R. (2008, January 28). Global Recession Risk Grows as U.S. Damage Spreads.
        Bloomberg, Retrieved from http://www.bloomberg.com/apps/news?
        pid=20601087&sid=arlKrFbn3pfY&refer=home

Monks, R. and Minow, N. (2005) Corporate Governance, Oxford: Blackwell.

Packaging with a punch. (2009) Packaging & Converting Intelligence. Retrieved October
      18, 2009, from http://www.pci-
      mag.com/editorial/023_spring08/023_packaging.pdf


Procter & Gamble. (2002), Cisco success stories customer profile. Retrieved October 5,
       2009 from
       http://www.cisco.com/warp/public/779/ibs/solutions/supply/pgcasestudy1.pdf

Procter & Gamble (2009). 2009 Annual Report. Retrieved September 28, 2009, from
       www.sec.gov.

Procter & Gamble at the 5th World Congress on Alternatives and Animal Use in the Life
       Sciences. (2005) Procter & Gamble Science (online). Retrieved September 30,
       2009, from http://www.pg.com./science/Brochure_print.pdf

Procter & Gamble Company, The. (2009). Datamonitor, May, p. 1-10.

Procter & Gamble Company, The. (2008). Datamonitor, Sep, p.1-11.


10/18/2009                         Procter & Gamble                     Page 76 of 87
Procter & Gamble Employs Axway Solution to Ensure Supply Chain Efficiencies and
       Cost Management. (2009). Tumbleweed. Retrieved October 6, 2009, from: http://
       www.tumbleweed.com/news/press_releases/2009/2009-06-09.html

Procter & Gamble to Deploy I.D. Systems' Wireless Vehicle Management System.
       (2009). i2 Technologies. Retrieved October 2, 2009, from
       http://finance.yahoo.com/news/Procter-Gamble-to-Deploy-ID-
       pz-2245208884.html?x=0

Procter & Gamble Implements i2 Solutions to Drive Transportation and Distribution
       Efficiency Globally. (2009). Reuters. Retrieved October 7, 2009, from:
       http://www.reuters.com/article/pressRelease/idUS152716+21-
       Jan-2009+BW20090121

P&G Pet Care Announces Voluntary Participation in Menu Foods' Nationwide U.S. and
     Canadian Recall of Specific Canned and Small Foil Pouch 'Wet' Cat and Dog
     Foods. (2007). Procter & Gamble (online). Retrieved October 5, 2009, from
     http://www.pg.com/homepage_announcements.shtml?
     document=/consumer/consumer_homepage_iams_euk_recall.xml

Porter, M. E. . (1985). Competitive Advantage. New York, NY: The Free Press.

Q4: The Long Term Case for Procter & Gamble. (2009). Seeking Alpha. Retrieved
      October 8, 2009 from http://seekingalpha.com/article/154907-q4-results-the-long-
      term-case-for-procter-gamble

Quinn, J., Mintzberg, H., James, R., Lampel, J. and Ghoshal, S. (eds) (2003) The Strategy
       Process, London: Prentice Hall.

Roberts, D., Grant, J. (2006) ‘P&G looks to gain strength through unity’, Financial
       Times.

Should Procter & Gamble Clean House? (2007) New York Times. Retrieved October 4,
       2009, from http://dealbook.blogs.nytimes.com/2007/07/24/should-procter-
       gamble-clean-house/

United Nations (2005). World Population Prospects: The 2004 Revision, vol. I:
       Comprehensive Tables (United Nations publication, ST/ESA/SER.A/244); vol. II:
       Sex and Age Distribution of Populations (United Nations publication,
       ST/ESA/SER.A/245)

Wheelen, T., Hunger, J. (2002) Strategic Management and Business Policy, 8th ed.
      Upper Saddle River, NJ: Addison Wesley

Wolf, C. (2008). Procter & Gamble Profit Beats Estimate as Price Rise. Bloomberg
       Retrieved October 5, 2009 from http://www.bloomberg.com/apps/news?
       pid=20601087&refer=home&sid=ased_GT5nTVk


10/18/2009                         Procter & Gamble                     Page 77 of 87
4.0 APPENDICES
APPENDIX 1


10/18/2009       Procter & Gamble   Page 78 of 87
Procter & Gamble Balance Sheet

(Year ended J une 30)                        2008              2007                  2006         Average
(In thous ands)
Cash and cash equivalents                    $3,313,000        $5,354,000            $6,693,000    $5,120,000
Short-term investments                        $228,000          $202,000             $1,133,000     $521,000
Accounts Recievable                          $8,773,000        $8,356,000            $5,725,000    $7,618,000
Inventories                                  $8,416,000        $6,819,000            $6,291,000    $7,175,333
Pre-paid expense and other
current assets                            $3,785,000           $3,300,000            $4,487,000    $3,857,333
Total Current Assets                     $24,515,000          $24,031,000           $24,329,000   $24,291,667

Long-term Investments
Other Assets                                 $4,837,000        $4,265,000            $3,569,000    $4,223,667
Property, plant, and equipment,
net                                      $20,640,000          $19,540,000           $18,700,000   $19,626,667
Trademarks & Goodwill                    $59,767,000          $56,552,000           $55,306,000   $57,208,333
Other intangible assets                  $34,233,000          $33,626,000           $33,721,000   $33,860,000
Deferred Long-Term Asset
Charges
Total Other Assets                      $119,477,000        $113,983,000       $111,296,000 $114,918,667
Total Assets                            $143,992,000        $138,014,000       $135,625,000 $139,210,333

Accounts payable and accrued
expenses                                     $7,977,000       $13,628,000           $14,497,000   $12,034,000
Short-Term Debt (Loans and
notes payable, current maturities
on long term debt)                       $13,084,000          $12,039,000             $198,000     $8,440,333
Other Current Liabilities                 $9,897,000           $5,050,000            $5,290,000    $6,745,667
Total Current Liabilities                $30,958,000          $30,717,000           $19,985,000   $27,220,000

Long-term debt                           $23,581,000          $23,375,000           $35,976,000   $27,644,000
Other Liabilities                         $8,154,000           $5,147,000            $4,472,000    $5,924,333
Deferred Long Term Liability
Charges                                  $11,805,000          $12,015,000           $12,354,000   $12,058,000
Total Other Liabilities                  $43,540,000          $40,537,000           $52,802,000   $45,626,333
Total Liabilities                        $74,498,000          $71,254,000           $72,787,000   $72,846,333

Preferred Stock                           $1,366,000           $1,406,000         $1,451,000       $1,407,667
Common Stock                             $4,002,000           $3,990,000         $3,976,000        $3,989,333
Captial surplus                         $60,307,000          $59,030,000        $57,856,000       $59,064,333
Retained Earnings                       $48,986,000          $41,797,000        $35,666,000       $42,149,667
Accumulated other
comprehensive income                     $2,421,000            ($691,000)       ($1,806,000)     ($25,333)
Treasury stock                         ($47,588,000)        ($38,772,000)      ($34,235,000) ($40,198,333)
Total Stockholder's Equity              $69,494,000          $66,760,000        $62,908,000 $66,387,333

Total liabilities and Equity           $143,992,000         $138,014,000       $135,695,000 $139,233,667
Common Shares Outstanding           3.03 B                3.13 B            3.17B
APPENDIX 2


10/18/2009                                   Procter & Gamble                               Page 79 of 87
Johnson & Johnson Balance Sheet
(Year ended December 31)               2008            2007            2006        Average
(In thous ands)
Cash and cash equivalents            $10,768,000      $7,770,000      $4,083,000    $7,540,333
Short-term investments                $2,041,000      $1,545,000          $1,000    $1,195,667
Accounts Recievable                  $13,149,000     $12,053,000     $10,806,000   $12,002,667
Inventories                           $5,052,000      $5,110,000      $4,889,000    $5,017,000
Pre-paid expense and other
current assets                        $3,367,000      $3,467,000      $3,196,000    $3,343,333
Total Current Assets                 $34,377,000     $29,945,000     $22,975,000   $29,099,000
Long-term Investments                     $4,000          $2,000         $16,000        $7,333
Other Assets                          $2,630,000      $3,170,000      $2,623,000    $2,807,667
Property, plant, and equipment,
net                                  $14,365,000     $14,185,000     $13,044,000   $13,864,667
Trademarks & Goodwill                $13,719,000     $14,123,000     $13,340,000   $13,727,333
Other intangible assets              $13,976,000     $14,640,000     $15,348,000   $14,654,667
Deferred Long-Term Asset
Charges                               $5,841,000      $4,889,000      $3,210,000    $4,646,667
Total Other Assets                   $50,535,000     $51,009,000     $47,581,000   $49,708,333
Total Assets                         $84,912,000     $80,954,000     $70,556,000   $78,807,333

Accounts payable and accrued
expenses                             $17,120,000     $17,374,000     $14,582,000   $16,358,667
Short-Term Debt (Loans and
notes payable, current maturities
on long term debt)                    $3,732,000      $2,463,000      $4,579,000    $3,591,333
Other Current Liabilities
Total Current Liabilities            $20,852,000     $19,837,000     $19,161,000   $19,950,000
Long-term debt                        $8,120,000      $7,074,000      $2,014,000    $5,736,000
Other Liabilities                    $11,997,000      $9,231,000      $8,744,000    $9,990,667
Deferred Long Term Liability
Charges                               $1,432,000      $1,493,000      $1,319,000    $1,414,667
Total Other Liabilities              $21,549,000     $17,798,000     $12,077,000   $17,141,333
Total Liabilities                    $42,401,000     $37,635,000     $31,238,000   $37,091,333
Preferred Stock
Common Stock                          3,120,000       3,120,000       3,120,000       3120000
Captial surplus
Retained Earnings                   $63,379,000     $55,280,000     $49,290,000      55983000
Accumulated other
comprehensive income                 ($4,955,000)    ($693,000) ($2,118,000) ($2,588,667)
Treasury stock                      ($19,033,000) ($14,388,000) ($10,974,000) ($14,798,333)
Total Stockholder's Equity           $42,511,000 $43,319,000 $39,318,000         $41,716,00 0

Total liabilities and Equity        $84,912,000     $80,954,000     $70,556,000    $78,807,333
Common Shares Outstanding 2.77 B                   2.84 B          2.89 B

APPENDIX 3

10/18/2009                            Procter & Gamble                        Page 80 of 87
Kimberly-Clark Corporation
(Year ended December 31)               2008               2007                2006            Average
(In thous ands)
Cash and cash equivalents                $505,000           $472,700            $625,300       $534,333
Short-term investments                                      $271,000                             $90,333
Accounts Recievable                    $2,623,000         $2,778,000          $2,555,900      $2,652,300
Inventories                            $2,493,000         $2,443,800          $2,004,500      $2,313,767
Pre-paid expense and other
current assets                          $192,000            $131,100             $84,000       $135,700
Total Current Assets                   $5,813,000         $6,096,600          $5,269,700      $5,726,433
Long-term Investments                    $927,000           $390,000            $392,900
Other Assets                             $939,000           $785,000            $726,300        $816,767
Property, plant, and equipment,
net                                    $7,667,000         $8,094,000          $7,684,800      $7,815,267
Trademarks & Goodwill                  $2,743,000         $2,942,000          $2,860,500      $2,848,500
Other intangible assets                                     $131,700           $132,800          $88,167
Deferred Long-Term Asset
Charges
Total Other Assets                    $12,276,000        $12,342,700         $11,797,300     $12,138,667
Total Assets                           $18 ,089,000       $18,439 ,300        $17,06 7,000    $17,86 5,100

Accounts payable and accrued
expenses                               $3,669,000         $3,830,700          $3,689,400      $3,729,700
Short-Term Debt (Loans and
notes payable, current maturities
on long term debt)                     $1,083,000         $1,097,900          $1,326,400      $1,169,100
Other Current Liabilities                                                                             $0
Total Current Liabilities              $4,752,000         $4,928,600          $5,015,800      $4,898,800

Long-term debt                         $4,882,000         $4,393,900          $2,276,000      $3,850,633
Other Liabilities                      $2,969,000         $2,035,100          $2,070,700      $2,358,267
Deferred Long Term Liability
Charges                                 $193,000            $369,700           $391,100        $317,933
Minority Interest                       $404,000            $484,100          $1,216,000       $701,367
Total Other Liabilities                $8,448,000         $7,282,800          $5,953,800      $7,228,200
Total Liabilities                     $13,200,000        $12,211,400         $10,969,600     $12,127,000

Preferred Stock                                                                                        $0
Common Stock                             $598,000          $598,300             $598,300        $598,200
Captial surplus (PIC)                    $486,000          $482,400             $427,600        $465,333
Retained Earnings                      $9,465,000        $8,747,800           $7,895,600       $8,702,800
Treasury stock                        ($4,285,000)      ($3,813,600)         ($1,391,900)    ($3,163,500)
Other Equity, Total                   ($2,386,000)        ($791,200)         ($1,432,200)    ($1,536,467)
Total Stockholder's Equity             $3,878,000        $5,223,700           $6,097,400      $5,066,367
Redeemable Preferred Stock             $1,011,000        $1,004,600
Total liabilities and Equity          $18,089,000       $18,439,700         $17,067,000      $17,193,367
Common Shares Outstanding                             413.60 M           420.90 M


APPENDIX 4

10/18/2009                              Procter & Gamble                             Page 81 of 87
Procter & Gamble Income Statement


(Year ended J une 30)         2008           2007          2006       Average
(In th ous and s)

Net Sales                   $83,503,000   $76,476,000   $68,222,000 $76,067,000
Cost Of Goods Sold          $40,695,000   $36,686,000   $33,125,000 $36,835,333
Gross Margin                $42,808,000   $39,790,000   $35,097,000 $39,231,667

Selling, General &
Administrative              $25,725,000   $24,340,000   $21,280,000 $23,781,667
Non Recurring
Research & Development
Other Operating Charges
Total Operating Expense     $25,725,000 $24,340,000 $21,280,000 $23,781,667
Income from Operations     $17,083,000 $15,450,000 $13,817,000 $15,450,000

Earnings Before Interest
and Taxes (EBIT)           $17,545,000    $16,014,000   $13,530,000 $15,696,333
Interest Expense            $1,467,000     $1,304,000    $1,120,000 $1,297,000
Other Income and
Expense
Income Before Taxes        $16,078,000    $14,710,000   $12,410,000 $14,399,333
Income Tax Expense          $4,003,000     $4,370,000    $3,730,000 $4,034,333
Net Income from
Operations                 $12,075,000    $10,340,000    $8,680,000 $10,365,000
Discontinued Operations
Net Income                 $12,075,000    $10,340,000    $8,680,000 $10,365,000


APPENDIX 5


10/18/2009                       Procter & Gamble                 Page 82 of 87
Johnson & Johnson Income Statement


(Year ended December 31)          2008          2007          2006          Average
(In th ous and s)

Net Sales                      $63,747,000   $61,095,000   $53,324,000      $59,388,667
Cost Of Goods Sold             $18,511,000   $17,751,000   $15,057,000      $17,106,333
Gross Margin                   $45,236,000   $43,344,000   $38,267,000      $42,282,333

Selling, General &
Administrative                 $21,490,000   $20,451,000   $17,433,000      $19,791,333
Non Recurring                    $181,000     $1,552,000      $559,000        $764,000
Research & Development          $7,577,000    $7,680,000    $7,125,000       $7,460,667
Other Operating Charges
Total Operating Expense         $29,248,000 $29,683,000 $25,117,000 $28,016,000
Income from Operations         $15,988,000 $13,661,000 $13,150,000 $14,266,333

Earnings Before Interest
and Taxes (EBIT)               $17,364,000   $13,579,000   $14,650,000     $15,197,667
Interest Expense                  $435,000      $296,000       $63,000        $264,667
Other Income and
Expense
Income Before Taxes            $16,929,000   $13,283,000   $14,587,000     $14,933,000
Income Tax Expense              $3,980,000    $2,707,000    $3,534,000      $3,407,000
Net Income from
Operations                     $12,949,000   $10,576,000   $11,053,000     $11,526,000
Discontinued Operations
Net Income                     $12,949,000   $10,576,000   $11,053,000     $11,526,000


APPENDIX 6


10/18/2009                           Procter & Gamble                    Page 83 of 87
Kimberly-Clark Corporation Income Statement


(Year en ded December 3 1)     2008          2007          2006          Average
(In th ousand s)

Net Sales                    $19,415,000   $18,266,000   $16,746,900 $18,142,633
Cost Of Goods Sold           $13,557,000   $12,562,100   $11,664,800 $12,594,633
Gross Margin                  $5,858,000    $5,703,900    $5,082,100 $5,548,000

Selling, General &
Administrative                $3,291,000   $3,105,900     $2,948,300     $3,115,067
Non Recurring
Research & Development
Other Operating Charges          $20,000
Total Operating Expense       $3,311,000    $3,105,900    $2,948,300     $3,115,067
Income from Operations       $2,547,000    $2,598,000    $2,133,800     $2,432,933

Earnings Before Interest
and Taxes (EBIT)             $2,593,000    $2,582,300    $2,065,200     $2,413,500
Interest Expense               $304,000     $264,800      $220,300        $263,033
Other Income and
Expense                         $46,000      ($15,700)     ($68,600)
Income Before Taxes          $2,289,000    $2,317,500    $1,844,900     $2,150,467
Income Tax Expense             $618,000      $536,500     $469,200        $541,233
Equity in Affiliates           $166,000      $170,000     $218,600
Minority Interest             ($139,000)    ($128,100)     ($94,800)
Net Income from
Operations                   $1,698,000    $1,822,900    $1,499,500     $1,609,233
Discontinued Operations
Exraordinary Items               -$8,000
Net Income                   $1,690,000    $1,822,900    $1,499,500     $1,609,233


APPENDIX 7

10/18/2009                        Procter & Gamble                    Page 84 of 87
Financial Statement Ratios for Proctor & Gamble

                                               2008         2007           2006
Profitability Ratios

Gross Profit Margin                            0.51          0.52          0.51
Operating Profit Margin                        0.69          0.68          0.69
Net Profit Margin                              0.14          0.14          0.13
Return on Total Assets                         0.08          0.07          0.06
Return on Stockholder's Equity                 0.17          0.15          0.14
Earnings per share                             $3.64        $3.04          $2.64

Liquidity Ratios

Current Ratio                                   0.79         0.78           1.22
Quick Ratio                                     0.52         0.56           0.90
Working Capital                             ($6,443,000) ($6,686,000)   $4,344,000

Leverage Ratios

Debt-to-Assets Ratio                            0.52         0.52           0.54
Long-Term Debt-to-Capital Ratio                 0.25         0.26           0.36
Debt-to-Equity Ratio                            1.07         1.07           1.16
Long-Term Equity Ratio                          0.34         0.35           0.57
Times-Interest-Earned Ratio                     8.23         7.93           7.75

Activity Ratios

Days in Inventory                              75.48        67.84          69.32
Inventory Turnover                             4.84          5.38          5.27
Average Collection Period                      38.35        39.88          30.63

Other Important Financial Measures

Dividend yield on common stock                  2.51       1.85             1.88
Price/Earnings (P/E) Ratio                     16.71      20.13            21.06
Dividend Payout Ratio                          $0.11       $0.12           $0.12
Internal Cash Flow                          $15,241,000 $13,470,000     $11,310,000

price per share                               $60.81        $61.19        $55.60
Closed Stock Market Price = As of June 30


APPENDIX 8


10/18/2009                        Procter & Gamble                   Page 85 of 87
Financial Statement Ratios for Johnson & Johnson

                                                2008          2007           2006
Profitability Ratios

Gross Profit Margin                             0.71           0.71           0.72
Operating Profit Margin                         0.54           0.51           0.53
Net Profit Margin                               0.20           0.17           0.21
Return on Total Assets                          0.15           0.13           0.16
Return on Stockholder's Equity                  0.30           0.24           0.28
Earnings per share                              $4.55         $4.15          $3.76

Liquidity Ratios

Current Ratio                                   1.65           1.51           1.20
Quick Ratio                                     1.41           1.25           0.94
Working Capital                             $13,525,000    $10,108,000    $3,814,000

Leverage Ratios

Debt-to-Assets Ratio                            0.50           0.46          0.44
Long-Term Debt-to-Capital Ratio                 0.16           0.14          0.05
Debt-to-Equity Ratio                            1.00           0.87          0.79
Long-Term Equity Ratio                          0.19           0.16          0.05
Times-Interest-Earned Ratio                     29.77         35.73         175.44

Activity Ratios

Days in Inventory                               99.62        105.07         118.52
Inventory Turnover                              3.66           3.47           3.08
Average Collection Period                       75.29         72.01          73.97

Other Important Financial Measures

Dividend yield on common stock                  3.00          2.43        2.20
Price/Earnings (P/E) Ratio                     14.14         14.85       15.94
Dividend Payout Ratio                          $0.10          $0.10       $0.10
Internal Cash Flow                           $15,781,000   $13,353,000 $13,230,000

price per share                                $64.34        $61.62         $59.92
Closed Stock Market Price = As of June 30


APPENDIX 9

10/18/2009                        Procter & Gamble                    Page 86 of 87
Financial Statement Ratios for Kimberly-Clark

                                               2008          2007          2006
Profitability Ratios

Gross Profit Margin                             0.30         0.31          0.30
Operating Profit Margin                         0.83         0.83          0.82
Net Profit Margin                               0.09         0.10          0.09
Return on Total Assets                          0.09         0.10          0.09
Return on Stockholder's Equity                  0.44         0.35          0.25
Earnings per share                             $4.14         $4.25         $3.90

Liquidity Ratios

Current Ratio                                   1.22          1.24         1.05
Quick Ratio                                     0.70          0.74         0.65
Working Capital                             $1,061,000    $1,168,000     $253,900

Leverage Ratios

Debt-to-Assets Ratio                            0.73         0.66           0.64
Long-Term Debt-to-Capital Ratio                 0.56         0.46           0.27
Debt-to-Equity Ratio                            3.40         2.34           1.80
Long-Term Equity Ratio                          1.26         0.84           0.37
Times-Interest-Earned Ratio                     5.59         6.88           6.81

Activity Ratios

Days in Inventory                              67.12         71.01         62.72
Inventory Turnover                              5.44         5.14          5.82
Average Collection Period                      49.31         55.51         55.71

Other Important Financial Measures

Dividend yield on common stock                  4.40         3.06       3.02
Price/Earnings (P/E) Ratio                     14.44        15.74      15.82
Dividend Payout Ratio                          $0.14         $0.12      $0.13
Internal Cash Flow                           $2,473,000   $2,629,400 $2,432,300

price per share                               $59.78        $66.89         $61.70
Closed Stock Market Price = As of June 30


10/18/2009                        Procter & Gamble                     Page 87 of 87

Proctor And Gamble

  • 1.
    University of Houston-Victoria School of Business Administration Individual Project Procter and Gamble Submitted by: Frank J. Paul October 18, 2009 Seminar in Strategic Management – MGT 6359 (Section 34509) University of Houston - Victoria Fall 2009 Instructor: Dr. T. T. Selvarajan
  • 2.
    Table of Contents 1.0.0External Environmental Analysis………………………………………… 3 1.1.0 General Environmental Analysis…………………………………………… 3 1.1.1 Demographic Segment………………………………………………. 3 1.1.2. Economic Segment…………………………………………………. 6 1.1.3 Political/Legal Segment……………………………………………… 10 1.1.4 Social-Cultural Segment……………………………………………… 11 1.1.5 Technological Segment………………………………………………. 12 1.1.6 Global Segment………………………………………………………. 15 1.1.7 Summary of General Environment Analysis…………………………. 15 1.2.0 Driving Forces…………………………………………………………………. 16 1.3.0 Industry Analysis……………………………………………………………….. 19 1.3.1. Description of the Industry…………………………………………….. 19 10/18/2009 Procter & Gamble Page 2 of 87
  • 3.
    1.3.2. Industry DominantEconomic Features…………………………………. 19 1.3.3. Industry Trends…………………………………………………………. 20 1.3.4. Summary of Industry Analysis…………………………………………. 21 1.4.0 Five Forces Competitive Analysis…………………………………………..….. 22 1.4.1. Threat of New Entrants………………………………………………… 23 1.4.2. Power of Buyers……………………………………………………….. 24 1.4.3. Power of Suppliers………………………………………………………. 24 1.4.4. Threat of Substitutes…………………………………………………….. 25 1.4.5. Intensity of Rivalry………………………………………………………. 25 1.4.6. Summary of Five Forces Competitive Analysis…………………………. 26 1.5.0 Competitor Analysis………………………………………………………………. 26 1.5.1 What Market Positions Rivals Occupy……………………………………. 26 1.5.2 Strategic Group Maps of Competitors……………………………………. 27 1.5.3 Competitor’s Strategies…………………………………………………… 28 10/18/2009 Procter & Gamble Page 3 of 87
  • 4.
    1.5.4 Strengths andWeaknesses of Competitors………………………………. 30 1.5.5 Competitor’s Next Moves………………………………………………… 32 1.5.6 Competitive Advantage of the Company in Relation to the Rivals……… 32 1.5.7 Summary of Competitor Analysis……………………………………….. 33 10/18/2009 Procter & Gamble Page 4 of 87
  • 5.
    2.0.0 Internal Analysisand SWOT Analysis 2.1.0 Financial Analysis……………………………………………………………….. 34 2.1.1 Valuation Analysis……………………………………………………… 35 2.1.2 Growth Analysis………………………………………………………… 35 2.1.3 Profitability Analysis…………………………………………………… 36 2.1.4 Financial Strength Analysis…………………………………………….. 36 2.1.5 Dividend Analysis……………………………………………………… 37 2.1.6 Management Efficiency Analysis………………………………………. 37 2.1.7 Stock Price Analysis……………………………………………………. 38 2.1.8 Summary of Financial Analysis………………………………………… 39 2.2.0 Strategic Analysis……………………………………………………………… 39 2.2.1 Current Business Level Strategies………………………………………. 39 2.2.2 Elements of Company’s Strategy……………………………………….. 40 2.2.3 Components of Company’s Business Level Strategy……………………. 42 2.2.4 How Well the Company’s Strategy is Working………………………… 10/18/2009 Procter & Gamble Page 5 of 87
  • 6.
    43 2.2.5 Summary of Strategic Analysis…………………………………………. 44 2.3.0 Value Chain Analysis……………………………………………………………. 44 2.3.1 Analysis of Primary Activities………………………………………….. 45 2.3.2 Analysis of Support Activities……………………………………..…… 46 2.3.3 Analysis of Company’s Cost Competitiveness in Relation to Rivals…… 46 2.3.4 Summary of Value Chain Analysis……………………………………… 47 2.4.0 SWOT Analysis………………………………………………………………… 48 2.4.1 Strengths………………………………………………………………. 48 2.4.2 Weaknesses……………………………………………………………… 49 2.4.3 Opportunities………………………………………………………….. 50 2.4.4 Threat…………………………………………………………………. 51 2.4.5 Summary of SWOT Analysis…………………………………………. 51 3.0.0 References…………..………………..……………………………………….. 10/18/2009 Procter & Gamble Page 6 of 87
  • 7.
    52 1.0.0 External EnvironmentalAnalysis 1.1.0 General Environment Analysis All companies whether global, regional, or local operate in a macro-environment shaped by influences stemming from the economy at large, population demographics, societal values and lifestyles, governmental legislations and regulations, technological factors, and the industry and competitive arena in which the company operates. Most organizations do not have direct influence on its broad environment such as society, the economy, technology, global politics; it can shield itself from most threats and take advantage of opportunities as they present themselves. Many major companies have lost industry dominance, market share, or gone out of business because of their failure to recognize and adapt to changes in their environments, or by failing to be leaders in making necessary changes. The key point is that an organization needs to be in tune with its often turbulent external environment. There must be a strategic fit between what the external environment needs or wants and what the organization has to offer. 1.1.1 Demographic Segment Population Size The world population is in the midst of an unprecedented transformation brought about by the transition from a regime of high mortality and high fertility to one of low 10/18/2009 Procter & Gamble Page 7 of 87
  • 8.
    mortality and lowfertility. This demographic transition is responsible for the rapid and accelerating growth that the world population experienced in the twentieth century as well as for the slowing down of that growth and for the changes in the age distribution associated with those developments (United Nations, 2005). Figure 1 below, illustrates the World’s population growth over a 100 year span. Procter and Gambles currently sales over 300 brands in over 180 countries around the world to people from all ages, genders, ethnicity, social classes, and walks of life. The increase in the world’s population provides a direct opportunity for P & G to increase the number of products sold each year (Procter & Gamble 2009). Figure 1 World Population: 1950-2050 10 Population (billions) 8 6 4 2 0 1950 1960 1970 1980 1990 2000 2010 2020 2030 2040 2050 Year Source: United Nations The emerging markets of Africa, Asia and Latin America present significant opportunities for P&G because of the growth in the number of people that will be within P & G target market. The graph below represents the percentage of the world’s population mix by continent. Table 1 10/18/2009 Procter & Gamble Page 8 of 87
  • 9.
    Population Percentage Estimates Continent 1950 1975 2000 2010 2025 2050 Africa 8.99% 10.31% 13.40% 14.95% 17.48% 21.84% Asia 55.46% 58.59% 60.48% 60.31% 59.57% 57.17% Europe 21.64% 16.65% 11.88% 10.61% 9.10% 7.55% Latin America and the Caribbean 6.61% 7.96% 8.52% 8.52% 8.36% 7.97% North America 6.78% 5.97% 5.21% 5.09% 4.96% 4.90% Oceania 0.51% 0.52% 0.51% 0.52% 0.53% 0.56% World 100% 100% 100% 100% 100% 100% Source: Geohive 1.1.2 Economic Segment The United States, the country with the world’s largest economy, is currently in an economic recession. Since the recession began in December 2007, the real gross domestic product (GDP), the total value of U.S. goods and services produced in a year and a basic measure of an economy’s performance, dropped at an annual rate of more than 6 percent in the fourth quarter of 2008. Federal Reserve Chairman Ben Bernanke said conditions in the labor market and declines in the value of housing along with tight consumer credit conditions will continue to hold consumers back from spending more until they experience a loosening of conditions that impact them directly. Bernanke said economic activity abroad is also an important consideration in how soon the U.S. economy rebounds. He states “the steep drop in U.S. exports that began last fall has been a significant drag on domestic production, and any improvement on that front would be helpful”. (America.gov) 1.1.3 Political/Legal Segment With the U.S. economy currently experiencing a recession, other countries may not be far behind. Japan, Britain, Spain and Singapore, which together represent about 12 10/18/2009 Procter & Gamble Page 9 of 87
  • 10.
    percent of theworld’s economy, are equally vulnerable as fallout from the U.S. worsens their economic weakness. Even emerging markets, including China, are likely to suffer as exports to the U.S diminish. The developing slump has put pressure on central bankers in Japan, the U.K. and the euro region to follow the lead of Federal Reserve Chairman Ben S. Bernanke, who in the 1st quarter of 2009 accelerated interest- rate cuts in the U.S. with an emergency move to lower the benchmark rate by three-quarters of a percentage point. The effect of the U.S. recession, which according to the IMF represents about 21 percent of the global economy, is spreading via multiple channels. There is less spending by American consumers and companies are reducing demand for imported goods. The meltdown of the U.S. subprime-mortgage market has pushed up credit costs worldwide and forced European and Asian banks to write down billions of dollars in holdings. Tumbling U.S. stock prices are also dragging down markets elsewhere. (Miller 2009) 1.1.4 Socio-Cultural Segment Women form the major target group for household, personal products and consumer goods companies. Several P&G consumer products, such as skin care and beauty care, are addressed directly to women. Other products, such as food and beverages, home cleaning and detergents are addressed to women as the primary decision makers or decision influencers. In addition to the media choice, companies have to decide on the type of programs they sponsor, so as to attract the attention of their target audience. 1.1.5 Technological Segment Organizations are rapidly trying to incorporate the Internet into their supply chain practices. Global competitive pressure and heightened shareholder expectations have 10/18/2009 Procter & Gamble Page 10 of 87
  • 11.
    accelerated the rateof Internet adoption.Electronic markets are Web sites where buyers and sellers converge to advertise, bid for products in auctions, post catalog information, procure inventory, and manage inventory and fulfillment. An electronic market can be aligned vertically, focusing on the procurement of industry-specific products such as paper, metal, chemicals, agriculture, and energy. Or it can be horizontal, providing products for a diverse range of industries. These markets act as hubs where buyers can procure direct goods, and suppliers can market their products. In many respects, the electronic market is a microcosm of the many-to-many supply chain market advocated earlier. Today, electronic markets deal mostly with transactions related to the procurement of indirect and direct goods, whether they are by auction, request for proposal (RFP), spot electronic procurement, or e-catalogs. P&G can use the electronic marketplaces to consolidate its location on where to procure goods, which can immensely lower the administrative and inventory costs. It also provides P&G and others an additional channel to market their goods. (Kahl & Berquist 2000). 1.1.6 Global Segment Procter and Gamble operates in more than 80 countries worldwide and sells more than 300 products to over 5 billion people. The health of each nation’s economy and the global economy as a whole affects P&G operations immensely. Given the current economic recession of the United States, the world’s largest economy, the International Monetary Fund predicts that the world economy, which grew by a robust 4.9% last 2007, to slow sharply. The IMF predicts the global economy to grow by 3.7% in 2009 and 3.8% in 2010 (IMF says U.S. recession, 2008). The graph below, lists the Current U.S. Economic Indicators. 10/18/2009 Procter & Gamble Page 11 of 87
  • 12.
    Table 2 Current U.S. Economic Indicators October 06, 2009 (Close of Day) Indicator Value Inflation % -1.44 GDP Growth % -0.74 Unemployment % 9.80 Gold $/oz 1,038.75 Oil $/bbl 70.88 Prime % 3.25 Source: www.forecast.org 1.1.7 Summary of General Environment Analysis In the fast changing world of electronic commerce, no industry has been left untouched by the impact of the Internet and the World Wide Web. The Internet has caused fundamental shifts in the way consumers shop for and purchase goods and services. This shift has the most impact on the household and personal care industry. This industry is very dependent on the population growth of both developed and developing countries. Major companies such as Procter and Gamble (P&G), market their products to every demographic member of the global community. The final factor affecting this industry is the current state of the global economy, especially the United States with the world’s largest economy. 1.2.0 Driving Forces Product innovation Procter & Gamble attempts to maintain its competitive edge by focusing on product innovation. P&G currently spends almost twice as much on R&D spending nearly $2.2 billion in 2008 as its closest competitor. The two most important factors in P&G's innovation process are its practice of consumer demand research and its "Connect and Develop" R&D structure. When P&G 10/18/2009 Procter & Gamble Page 12 of 87
  • 13.
    first enters anew market it sets up in-home visits with consumers in order to fully comprehend the needs, wants, and desires its’ potential consumers have for household and personal products. P&G also incorporates consumers' input into the R&D process through its "Connect and Develop" initiative. Through "Connect and Develop" P&G has an online website where people can submit what P&G calls “game-changing product” ideas, and provide input on topics such as packaging, product improvement and services offered. P&G’s staff collects and sorts through all the ideas and work with the most promising ones. This process is not responsible for the entire R&D that P&G does, but approximately 42% of new products in the last several years were influenced by or originated from "Connect and Develop." (PGconnectdevelop.com) Regulatory influences and government policy changes Several consumer protection groups are voicing concerns over the presence of harmful chemical ingredients in cosmetic products. A recent study showed that about one third of cosmetic products contain carcinogens. Due to increasing public pressure, the U.S. Food and Drug Administration is expected to impose stringent quality norms on cosmetic products. New regulations may delay the launch of new products for companies like P&G and result in higher product development expenditure. In Europe new rules on ingredients contained in a European Union draft are expected to come into force this year and a European Chemicals Agency has been created to improve regulation of products. The cost of compliance with more stringent regulations creates new barriers of entry and increases the number of counterfeits of household and personal care products on the market. P&G and other companies must monitor and try to control the widespread use of counterfeit products because they can both weaken a companies' brand image, and also divert revenues that should be obtained by the brand's owner. 10/18/2009 Procter & Gamble Page 13 of 87
  • 14.
    Changes is cost P&G depends heavily on a diverse number of global commodities for manufacturing its goods. Since 2002 prices have risen by nearly 50%. Nearly half of the P&G’s cost of goods is directly related to commodity goods. The company has increased prices due to higher costs of oil and other raw materials. In its recent conference call, the company stated that it expected raw material costs to increase $3 billion in 2009. The company has raised prices on most products such as Cascade dishwashing detergent, Iams pet food, and Gillette razors to counter the increasing cost of oil in the first half of 2008. As the market leader, the company does benefit from pricing power and can moderate commodity inflation better than its competitors (Wolf, 2008). Some commodities of note: ▪ Coffee prices affect P&G’s Folgers’s brand, which most suffered from the rising coffee prices as a result of Hurricane Katrina ▪ Growing paper pulp prices affect several of the company's tissue businesses, as well as many of its products' paper packaging ▪ Increasing petroleum prices affect the fabric and home care businesses. ▪ Natural gas is a key energy input into the manufacturing process of toilet and diaper goods, which are air dried Changing societal concerns, attitudes, and lifestyles Societal concerns, attitudes, and changing lifestyle not only affect P&G but every company in the world that provides products, goods and services. P&G has faced a number of boycotts over the years concerning the use of animals in testing the effects of its products. Animal rights organizations argue that it is not only the specific practices of individual companies that cause problems, but the attitude created by the currrent system of exploitation that gives power and profits to the few, at the expense of people, animals and the environment. They feel it is important to expose the unethical practices of specific companies as their behavior is often indicative of the entire system. 10/18/2009 Procter & Gamble Page 14 of 87
  • 15.
    P&G admitted in2005 at the 5th World Congress on Alternative and Animal Use in the Life Sciences in Berlin, Germany that “P&G sometimes conducts research using animals to demonstrate safety or efficacy in pharmaceuticals, pet nutrition studies and for consumer products. Such studies are only conducted as a last resort once all other reasonable options have been excluded”. P&G stated that it ultimately wants to eliminate the need for all research involving animals for consumer products and their ingredients (Procter & Gamble at the 5th World Congress, 2005). In the meantime, P&G is dedicated to use non-animal alternatives whenever possible across the company. P&G also stated that a large majority of its research studies do not employ animals. Animal testing is therefore the exception, not the rule at P&G. In order to control and protect its company image, P&G has been working with government and different academia to promote the acceptance of alternative ways for testing its products. P&G claim that it wants to ultimately eliminate the need for all research involving animals for consumer products and their ingredients (Procter & Gamble at the 5th World Congress, 2005). 1.3.0 Industry Analysis The global household and personal products industry generated total revenues of $503.3 billion in 2008. During the period from 2004 to 2008 the compound annual growth rate (GAGR) was approximately 3.8%. The sales of personal products proved to be the most lucrative for the global household and personal products industry in 2008, generating total revenues of $408.5 billion, equivalent to 81.17% of the industry's overall value. The performance of the industry is forecast to decelerate slightly, with an anticipated CAGR of 3.7% for the five-year period 2008-2013, which is expected to drive 10/18/2009 Procter & Gamble Page 15 of 87
  • 16.
    the industry toa value of $602.7 billion by the end of 2013 (Household & Personal Products, 2008). Table 3 Compound Annual Growth Rate for Global Household & Personal Products Industry Year Total Revenue % Growth Rate 2004 434.1 2005 451.1 3.9% 2006 468.5 3.9% 2007 485.5 3.6% 2008 503.3 3.7% 2004-2008 3.8% Source: Datamonitor 1.3.1 Description of the Industry The global household and personal products industry consists of the global household products and personal product markets. Manufactures in this industry focus on selling products that meet the needs of everyday consumers in areas such as personal hygiene, beauty and health, pet care and other household products. They also produce and manufacturer different fragrances, hair care, make-up, oral hygiene, dishwashing products, furniture polish, general purpose cleaners, insecticides, scouring products, textile washing products and toilet care products. Procter and Gamble (P&G) is currently the market leader with over 16% of the market share in this diverse and crowed industry. Below, Figure 2 illustrates major manufactures in the industry and their perspective market share. Figure 2 10/18/2009 Procter & Gamble Page 16 of 87
  • 17.
    Global Household &Personal Products Industry Share % 16.60% Procter & Gamble 5.40% Unilever L'Oréal S.A. 5.00% Kimberly-Clark 5.60% Johnson & Johnson 62.40% 3.20% Other Source: Datamonitor & Kimberly-Clark’s 10-K annual report 1.3.2 Industry Dominate Economic Features Market size and growth rate The global household and personal care industry generated total revenues of $40.7 billion in 2008, representing a compound annual growth rate (CAGR) of 3.7% for the period spanning 2004-2008. In comparison, the Americas and European markets grew with CAGRs of 4.5% and 2.7%, respectively, over the same period, to reach respective values of $13.9 billion and $16.7 billion in 2008. Market consumption volumes increased with a CAGR of 3.1% during 2004-2008, to reach a total of 10.6 billion units in 2008. The market's volume is expected to rise to 12.2 billion units by the end of 2013, representing a CAGR of 2.9% for the 2008-2013 periods. (Household & Personal Products, 2008). Number of rivals The global household and personal products industry is a highly fragmented industry with an enormous amount of products and manufactures. P&G faces competition from local, low-cost manufacturers in developing countries and from increasing private 10/18/2009 Procter & Gamble Page 17 of 87
  • 18.
    label brands introducedby large format retailers and discounters worldwide. P&G’s products must effectively compete with products from strong competitors as well as that of retail chains at all times (Procter & Gamble Company 2008). Scope of competitive rivalry There are considerable substitutes for all of P&G's product offerings, creating an intense competitive environment. In order to differentiate itself, the P&G must continue to provide new, innovative products and branding to the customer. Number of buyers Although P&G is an extreme large company, its future is dependent on buyers. Wal-Mart is P&G largest customer and accounted for over 15% of P&G total revenue in 2009, 2008, and 2007. This percentage of total revenue gives Wal-Mart the ability to bargain with the P&G for lower prices, which would result in lower earnings. The current credit crisis will not have a significant impact on P&G because of the diversity and “recession-proof” status of its products. The products that P&G offers can sustain a slowdown or recession in the US economy because of their product types. Consumers will continue to purchase these goods through an economic correction. While P&G had disappointing 2nd quarter earnings due to higher commodity costs in 2009, analysts’ reports indicate strong sales forecasts and growth opportunities for the rest of the year. Degree of product differentiation Procter and Gamble has one of the most diversified product portfolios among leading global manufactures and marketers of consumer products. P&G participates in more than 40 product categories with 300 brands in over 60 different markets. The company is organized into three global business units (GBUs): Beauty, Health and Well-Being, and Household Care. Please see Figure 21 for P&G three GBUs. 10/18/2009 Procter & Gamble Page 18 of 87
  • 19.
    In the beautysegment, the company's products include cosmetics, deodorants, feminine care products, hair care, personal cleansing and skin care products. Tooth paste, pharmaceuticals, personal healthcare, and pet food products are marketed under the healthcare segment. The home care segment comprises of fabric care, hair care, dish care and surface care products. In addition, P&G's products include baby care and family care products such as diapers, baby wipes and bath tissue. The recent purchase of Gillette will add blades and razors, batteries, electric razors, and small appliances to its broad product offering. The company has more than 20 brands with sales exceeding one billion dollars, which, together, have sales of over $24 billion. Brands include Pampers, Tide, Ariel, Always, Whisper, Pantene, Bounty, Pringles, Crest, Clairol Nice 'n Easy, Actonel, Dawn and Olay (Procter & Gamble 2009). Product Innovation P&G’s global scale allows it to quickly flow innovation across developing countries. The diversity of P&G’s brand portfolio gives it the opportunity to innovate in more aspects of consumers’ lives than nearly any other company. P&G brands are in every room of the house, at virtually every hour of the day. As a result, P&G is able to get a better sense of consumers’ needs than other companies. This helps them spot more problems and allows P&G innovations to help solve consumer’s needs and wants. Demand Drivers Demand drivers in the household and personal care products industry include some of the following categories: price, demographics, household income, and innovation. The industry is mainly comprised of necessity products; meaning that even in times of recession, sales remain steady. The price of the product is generally reflected on the quality of the product and consumer preferences over a brand name or private label 10/18/2009 Procter & Gamble Page 19 of 87
  • 20.
    brands. Disposable incomealso plays a role, if a consumer has more disposable income, they may buy the more expensive product. Pace of technological change Procter & Gamble’s advertising and R&D is spread over 44 brands that account for 90% of the company’s profits. This allows P&G more opportunities to leverage proprietary technology among multiple categories. Moreover, P&G’s research and development is enhanced by a global relationship with nearly two million researchers in technology areas connected with P&G businesses. New products can be quickly brought to market using P&G’s existing brands and distribution system. P&G’s relative level of innovation is apparent from the results of the 2008 industrial research institute’s pace setter study that measures the top new products measured by sales. In 2008, P&G had 10 out of 25 of the top new products in the non-food category. In comparison, Unilever, J&J, Kimberly Clark, Colgate (CL), L’Oreal (LRLCY.PK), and Energizer (ENR) collectively had 7 (Q4, 2009) Vertical Integration Procter & Gamble, along with many of its top competitors have formed strategic alliances and partnerships with suppliers such as Wal-Mart, Costco and other retailers in order to improve is supply chain management, reduce storage cost and improve efficiency. P&G has also created a special website for its customers called P&G Everyday Solutions where its customers can get product updates, free samples, and print coupons. Economies of Scale P&G will continue to innovate because economies of scale allow P&G to spend much more than rivals on R&D. For example, P&G spends over twice as much on 10/18/2009 Procter & Gamble Page 20 of 87
  • 21.
    research and developmentthan its nearest competitor. P&G’s largest competitors by trailing 4 quarters revenue are Unilever (UL) ($60B), Kimberly Clark (KMB) ($19B), and Johnson & Johnson’s (JNJ) consumer segment ($16B). Moreover, the same economies of scale allow P&G to efficiently signal this value to consumers through advertising. P&G economies of scale allow it to meet consumer needs in a particular region and then quickly flow that technology across multiple countries faster than its competitors. Learning / Experience Curve Effects Globally, there are many household care and personal product companies that P&G must constantly be aware of and their decisions. Switching costs remain very low in this industry and it allows consumers to easily switch their brands because of product dissatisfaction, increased costs, or even out-of-stocked items. Also it is becoming more difficult for consumers to differentiate competing brands as the number of product introductions is continually increasing. Companies within the industry are regularly enhancing older product lines, while new product lines are also being introduced. Being first to market can be extremely profitable for P&G or any other company, but it could also back fire as more brands and product features are offered, thus making it more difficult for consumers to differentiate among the products that are available. 1.3.3 Industry Trends The personal care industry had an excellent growth rate in all the major markets of the world in 2005-2006. Since the past few years, people have become more conscious about their appearance and look, which has led to a huge demand for these products worldwide. New products are launched by the leading brands to attract consumers. The 10/18/2009 Procter & Gamble Page 21 of 87
  • 22.
    trends in allthe leading personal care markets show that this industry has massive potential for growth. The women’s beauty industry is also growing at a rate of approximately USD 202.254 billion every year where as the global market for cosmetics alone USD 30.33 billion. The global personal care products industry is growing at a very rapid pace; some of the factors directly responsible for this growth are: ▪ Rise in consumer spending power ▪ Increased demand due to people consciousness ▪ Entry of herbal and organic products ▪ Lifestyle and climactic changes, and ▪ Massive advertising and promotion strategy 1.3.4 Summary of Industry Analysis In summary, the household and personal products industry is a mature, fragmented, and stable industry. The industry is considered highly competitive with considerable substitutes for most products on the market. In such a climate companies must be able to differentiate themselves and build customer loyalty by providing outstanding service and providing new, innovative products and branding to the everyday customers. The majority of developed countries are predicted to have only a small population increase in the next decade. The developing and emerging markets will provide P&G and other manufactures with incredible and unprecedented growth opportunities as economies become more globally intertwined. Most of the products within this market are considered recession proof and are considered necessities, therefore demand is typically stable. 10/18/2009 Procter & Gamble Page 22 of 87
  • 23.
    1.4.0 Five ForcesCompetitive Analysis Michael Porter developed a framework consisting of five competitive forces, which analyze how industry factors impacts a company's strategy. These factors are: the threat of new entrants, power of buyers, power of suppliers, availability of substitutes and competitive rivalry (Porter, 1985). Figure 3 Porter's Five Competive Forces Potential Entrants Suppliers' Power Industry Buyers' Power Competitors Substitutes Source: Michael Porter’s Competitive Advantage 1.4.1 Threat of New Entrants The enormous amount of products that are distributed under Procter & Gamble's name creates a challenge for new entrants. Since the P&G possess a significant amount of market shares around the world, a potential competitor that lack large sums of capital for heavy marketing and research and development, would hardly be able to effectively compete. However, there is concern about firms that specialize in niche markets. This type of company could possibly become a threat to P&G's corresponding business segment. Proctor and Gamble must continue to expand its operations internationally, due 10/18/2009 Procter & Gamble Page 23 of 87
  • 24.
    to the declineof the US dollar to other currencies and the emergence of new markets, such as India or China. 1.4.2 Power of Buyers Although P&G is an extreme large company, its future is dependent on buyers. P&G is heavily dependent on Wal-Mart and its affiliates for generating a major part of its revenue. Sales to Wal-Mart and its affiliates have represented approximately 15% of its total revenue since 2006 thus creating the “Wal-Mart effect.” High dependence upon Wal-Mart reduces the bargaining power of P&G. Wal-Mart could use its bargaining power to impose unfavorable terms on the company. Any decrease in revenue from Wal- Mart could have a negative impact on the company's businesses. 1.4.3 Power of Suppliers P&G has a codependent relationship with most of its suppliers. In order to generate above average revenues the P&G needs various quality materials for product production at the best prices available. Suppliers of these materials also need key customers like P&G for profitable revenue generation and will very likely have little bargaining power because of its small size. P&G can use its tremendous size and large amounts of available cash to its advantage during this current credit crisis. Rising interest rates and the declining availability of credit ultimately should not affect P&G’s relationship with its suppliers. P&G’s successful history and large market share can be used to back its borrowings, under the assumption that P&G continues to maintain its current market share. 1.4.4 Threat of Substitutes There is substantial number of substitutes for all of P&G's product offerings, creating an intense competitive environment. In order to differentiate itself, the P&G 10/18/2009 Procter & Gamble Page 24 of 87
  • 25.
    must continue toprovide new, cutting edge, and innovative products and branding to the customer. P&G notes that working collaboratively with customers and developing deep shopper and consumer understanding will improve the in-store presence of its products and win the "first moment of truth." This happens when customers choose which brands to buy. Winning the "second moment of truth," when consumers decide whether P&G products deliver on the brand promise, is essential for growth in such a competitive environment (Procter & Gamble 2009). 1.4.5 Intensity of Rivalry The intensity of rivalry is very high in this industry. P&G has several strong competitors in different markets like Amway Corporation, Intimate Brands, Colgate- Palmolive Company, Kimberly-Clark, Maybelline, Johnson & Johnson, Revlon, Inc., Estée Lauder, General Mills, S.C. Johnson & Son, Unilever, Sara Lee Corporation among other big and medium sized competitors (Jones, 2005). Another important element affecting the intensity of rivalry is that the switching costs in this industry are quite low as it does not cost anything for a consumer to buy one brand of a consumer product instead of another. The thing in favor of P&G is that unlike most of its competitors, who use wholesalers who sell a variety of competing products, P&G’s network, while independently owned and operated, mainly sells only P&G products giving the company a slight competitive advantage. 1.4.6 Summary of Five Forces Competitive Analysis The Michael Porter's Five Force Competitive Analysis is a powerful tool that helps business managers understand both the strength of their company’s current competitive position and whether new products, services or businesses have the potential to be profitable. With a clear understanding of where power lies, managers can take 10/18/2009 Procter & Gamble Page 25 of 87
  • 26.
    advantage of acompany’s situation of strength, improve a situation of weakness, and avoid taking wrong steps. The factors affecting P&G are economic, political, social, technological advancements, environmental and legal. A detailed SWOT analysis revealed that the company enjoys the strengths of a strong brand, R&D capabilities and strong global infrastructure but also depends too much on a few top customers such as Wal-Mart and mature markets. P&G should leverage its strengths to realize opportunities in emerging markets and thwart away the threat from intense competition and increase in raw materials. In the consumer products industry, P&G has a limited supplier power, mixed buyer power, high risk of substitutes, intense competition and enjoys low risk of new entrants. 1.5.0 Competitor Analysis The global household and personal care industry is an $82.6 billion dollar industry. It is projected to have a market value of $95.1 billion by 2013. In 2008, the United States accounted for over $17.2 billion and Europe was estimated to be around $35.1 billion. Supermarkets and hypermarkets lead the global household products market, distributing 56.1% of the market’s overall value. P&G accounts for 17.1% of the global household and personal care products market value. Procter & Gamble principal activity is manufacturing and marketing consumer products. It operates in six business segments: Beauty; Grooming; Health Care; Snacks, Coffee and Pet Care; Fabric Care and Home Care. The Beauty Care segment includes cosmetics, deodorants, fragrances, hair care and other products. Grooming includes blades and razors, electric hair removal devices, face and shave products and home appliances. The Health Care segment includes feminine care, oral care, personal health 10/18/2009 Procter & Gamble Page 26 of 87
  • 27.
    care and pharmaceuticals.The Snacks, Coffee and Pet Care segment includes coffee, pet food and snacks. The Fabric Care and Home Care business includes air care, batteries, dish care, fabric care and surface care. The Baby Care and Family Care business includes baby wipes, bath tissue, diapers and facial tissue. Some of its brands are Head & Shoulders, Olay, Pantene, Gillette, Oral-B, Pringles, Ariel, Tide, Downy and Pampers. The products are sold in more than 180 countries around the world. 1.5.1 What Market positions rivals occupy Procter & Gamble (P&G) is the world's largest producer of household and personal products by revenue with net sales of $83,503 million and with its products reaching 4 billion people worldwide. P&G's product line includes 24 brands across beauty, healthcare, and food including Tide detergent, Pampers diapers, and Gillette razors, that generate over $1 billion in revenue annually. One of the key areas of growth for the company is in emerging markets worldwide. Sales in developing nations have increased steadily from 20% of total revenue in 2002 to 30% in 2008. According to Wikinvest.com P&G already owns a large and growing market share in countries including China and Russia. In light of the global economic downturn, P&G has announced it will focus its growth strategy on emerging markets, opening almost all of its 20 new manufacturing facilities outside its established markets. Johnson & Johnson (JNJ) is the world's second largest and most broadly based manufacturer of health care products, with 2008 annual sales of $63.8 billion. The company holds a significant share of the consumer and pharmaceutical markets, and is the world's largest developer and manufacturer of medical treatment and diagnostic devices. In the company's continuing effort to diversify its business and increase profits, JNJ is constantly acquiring new companies. According to Wikinvest.com, JNJ acquired 10/18/2009 Procter & Gamble Page 27 of 87
  • 28.
    8 companies in2008. JNJ over-the-counter pharmaceuticals and nutritionals include: skin care, baby & kids care, and women's health products, totaling $16.0 billion in sales in 2008. Although the Consumer Health Care division is the smallest of the company's three segments, it includes some of the company's most recognizable brands such as Tylenol, Neutrogena, and Band-Aid. Kimberly-Clark is a consumer products giant with 19.4 billion in sales for FY 2008 and net income of $1.7 billion. KMB is microscopic in comparison to P&G, but nevertheless a large force to be reckoned within the consumer products industry. In fact, KMB continues to hold a significant market share in household and personal care industry, with the No. 1 or No. 2 market share position in more than 80 countries. In order to see continued growth and profits, however, Kimberly-Clark must develop new innovative products or figure out a way to compete more effectively with its current line of products. If KMB cannot do this, it is possible that the company will become increasingly less profitable. 1.5.2 Strategic group maps of competitors Driving forces and competitive pressures do not affect all strategic groups evenly. Profit prospects vary from group to group based on the relative attractiveness of their market potential. A Strategic group is a cluster of firms in an industry with similar competitive approaches and market positions. Strategic group mapping is an analytical tool for displaying the different market and/or competitive positions that rival firms occupy in a particular industry. Figure 4 and Figure 5 below represent the strategic group map of the household and personal care industry with three main competitors. Figure 4 10/18/2009 Procter & Gamble Page 28 of 87
  • 29.
    Household and PersonalCare Industry Strategic Group Map High Johnson & Johnson Procter & Net Income Gamble Kimberly -Clark Low Number of Operations in Different Countries Low High Figure 5 Household and Personal Care Industry Strategic Group Map High Procter & Gamble Market Share Kimberly -Clark Johnson & Johnson Low Advertising Expenditure Low High 10/18/2009 Procter & Gamble Page 29 of 87
  • 30.
    1.5.3 Competitor’s Strategies JNJ diverse revenue base has helped insulate it from the highs and lows that affect its competitors from time to time. As a result of this and its acquisition strategy, JNJ has reported more than 70 years of sales growth and produce impressive free cash flow, which is its operating cash flow less capital expenditures, reaching almost 20% of sales. This excellent cash generation has enabled JNJ to grow its dividend for the last 44 years, a trend that is expected to continue in the next couple of years. KMB has been expanding its portfolio of services by entering into strategic agreements, and acquiring alliances in order to strengthen its position in the industry. In March of last year, KMB decided to purchase the remaining shares of its South African subsidiary, Kimberly-Clark of South Africa (K-CSA) from the Lion Match Company. K- CSA is a leading manufacturer and marketer of tissue, personal care and business-to- business products and also markets Kimberly-Clark's line of health care products. KMB increased ownership in K-CSA will allow it to expend its international reach and gain market share in the African region. 1.5.4 Strength and Weaknesses of competitors Johnson & Johnson (JNJ), the world’s leading consumer health company, is engaged in the R&D, manufacture and sale of household and personal care products, pharmaceuticals and medical devices and diagnostics. JNJ has a number of strengths and weaknesses which are depicted in the table below. Table 4 Strengths Weakness ▪ Strong Brand Image ▪ Over Dependence on Pharmaceutical Sales ▪ R&D ▪ Lack of size in therms of revenue ▪ Interaction with Customers ▪ ▪ 10/18/2009 Procter & Gamble Page 30 of 87
  • 31.
    J&J attaches greatimportance to developing an understanding about its products among consumers, doctors and medical professionals. There is also a constant focus on educating customers. This constant interaction with customers has afforded JNJ the ability to grow its brand image that is almost unparallel to anyone else. JNJ’s R&D team of scientists works in partnership with the marketing department and product supply teams to improve products, packaging and supporting advertising claims. Several new products have been developed and launched successfully by understanding the consumer’s wants, needs, and requirements. Despite its remarkable strengths, JNJ has a number of weaknesses. More than 40% of J&J’s revenue currently comes from its pharmaceutical group, with seven drugs each bringing in more than $1 billion in sales. Even with a strong brand portfolio and geographically diversified operations, JNJ lacks the size, in terms of revenue, to compete with companies like Procter & Gamble, whose revenues for the fiscal year ended June 2008 were $83,503 million, where as JNJ were $63,747 million. Kimberly-Clark Corporation (KMB) is a global health and hygiene company offering household and personal care and consumer tissue products. KMB has a number of strengths and weaknesses which are represented in the table below. Table 5 Strengths Weakness ▪ Strong Brand Image ▪ Lack of Scale ▪ Strong Customer Loyalty ▪ High Dependence on Wal-Mart ▪ Broad Portfolio of Products ▪ Lack of International Revenue ▪ Diversified business structure Kimberly-Clark's product portfolio includes some of the most popular brands of the world such as GoodNites, Cottonelle, Kleenex, Scott, Andrex, Hakle, Huggies, Pull- 10/18/2009 Procter & Gamble Page 31 of 87
  • 32.
    Ups, Kotex, Poise,Kimberly-Clark, Fiesta, Little Swimmers, Andrex, Ballard, Kimwipes, Lightdays, Page and Depend. KMB has some of the most recognizable products in the industry that have allowed it to achieve consumer loyalty and over time have ensured a lofty market share. KMB has a diversified business structure that has been organized into four reportable global business segments: Personal Care; Consumer Tissue; K-C Professional & Other; and Health Care. Wal-Mart is KMB largest customers and accounted for approximately 14 percent in 2008 and 2007, and approximately 13 percent in 2006 of its net sales and revenue. KMB had approximately $10,461 million, which was 52.1% of the total revenue coming from the North American region; out of which $10,143 was from the U.S. alone. 1.5.5 Competitor’s next moves In an effort to keep pace with a more competitive and ever changing market Johnson & Johnson has decided to focus on redefining the image of certain products through marketing drives that are closely integrated with packaging and product design. The success of many of Johnson & Johnson’s packaging redesign projects is based partly on the creative imagination of the designers. Within this new structure today, JNJ also believes that another key focus is on relationship management. JNJ wants to ensure that all divisions, from R&D to sales, communicate effectively and collaborate around shared goals. Within a collaborative environment that functions well, the product is linked to the process of packaging design at a much earlier stage than ever before. JNJ believes that this bond between product design and packaging design is crucially important to the future success of any advertising and/or marketing campaign, because all internal stakeholders have an input on the final product and the strategy to place it in the market. 10/18/2009 Procter & Gamble Page 32 of 87
  • 33.
    KMB main focusis on its growth through acquisitions. KMB in October 2008, purchased the remaining shares of Colombina Kimberly Colpapel (CKC) from Compañía Colombiana de Inversiones. This acquisition will enhance KMB’s growth potential in the rapidly developing markets of Bolivia, Colombia, Ecuador, Peru and Venezuela. Earlier this year, KMB acquired Jackson Products, a privately held safety products company. Jackson Products was one of the leading providers of welding safety products, personal protective equipment and work zone safety products. The acquisition is expected to bring a wealth of strengths to Kimberly-Clark's professional business, including a strong product portfolio with an experienced sales force. Kimberly-Clark will also focus its growth through product innovation. The company will spend approximately 1.5% of its annual revenue on R&D in an effort to drive innovative new products to the market. KMB will work more closely with customers in order to increase shopper loyalty. Finally, in order to further build brand equity and market share, KMB has decided to increase its marketing spending by $200 million over the last four years and plans to continue increasing its marketing investments for the foreseeable future. 1.5.6 Competitive advantage of company in relation to the rivals Procter and Gamble is one of the most admired and industry dominating companies in the world today. P&G takes great pride in the products they produce and work hard to ensure that their products are of the highest quality. They strongly believe in the importance of advertising and research and development. They research intensely to determine their target markets and what types of products would best fit their needs. In fact P&G currently spends almost twice as much on R&D spending nearly $2.2 billion in 2008 as its closest competitor. P&G’s advertising and R&D are spread over 44 brands 10/18/2009 Procter & Gamble Page 33 of 87
  • 34.
    that account for90% of the company’s profits. P&G’s research and development is enhanced by a global relationship with nearly two million researchers in technology areas connected with P&G businesses. P&G promotes its products to those who most fit their target market by appealing to the lifestyles that the consumer lives and understanding what the consumer’s values and morals are. P&G has a long standing reputation of having a family of products that are of excellent quality and continues to be a leader in household goods. 1.5.7 Summary of competitor analysis The household and personal care products industry is a highly competitive, mature, and stable industry for the market. More times than not, it has not experienced the major downfalls because of the economy. From the information provided by most analysts a general conclusion can normally be made about the nature of this industry. According to most analysts most slips in sales or volume are resulting from current economical standings; however, these drops are not normally significant enough to affect an industry that provides products people rely on for everyday living. Generally, when the market falters it is because of a decrease in the consumers’ purchase of luxury items. The household and personal care industry offer both types, necessity products which are normally considered recession proof products and those of luxury. In order for P&G to maintain its current market position, they must continue to scan the environment for possible threats. Whether through acquisitions or Greenfield investments, P&G must start to focus on developing and emerging markets. Rising gas prices and new regulations will not only impact P&G but its competitors also. Therefore P&G must work non-stop to ensure that they can continue to put forth a superior quality 10/18/2009 Procter & Gamble Page 34 of 87
  • 35.
    of product. P&Ghas many loyal customers and has to continue to meet their needs while attracting new customers in order to remain on top of their industry. 2.0.0 Internal Analysis and SWOT Analysis 2.1.0 Financial Analysis Financial analysis is the use of financial statements to analyze a company’s financial position and performance, and to assess future financial performance. It reduces the reliance on hunches, guesses, and intuition for business decisions. Procter and Gamble and it competitors’ financial statements were obtained from Yahoo Finance, AOL Money & Finance, and the Securities and Exchange Commission (SEC). The most recent annual 10-K report from each of the companies was evaluated in order to insure the accuracy of the information provided. 2.4.1 Valuation Analysis Financial minds are constantly trying to measure the value of securities (or businesses). Valuation ratios are mathematical calculations that help individuals assess and determine the cost of a security (or business) to the benefits of owning it. These ratios are typically calculated by dividing a measure of price by a measure of value or vice-versa. For purposes of my analysis, I am applying the following ratios: Price/earnings ratio, Price to earnings growth ratio, Price/Cash flow ratio, Price/Book ratio and Dividend yield. Table 6 10/18/2009 Procter & Gamble Page 35 of 87
  • 36.
    Valuation Ratios PG JNJ KMB Industry Market Cap 168.28 Billion 167.94 Billion 24.48 Billion 260 Billion P/E Ratio 16.71 14.14 14.44 16.90 P/E Growth Ratio 1.46 1.65 1.50 N/A Price/Cash Flow Ratio 11.70 10.70 10.30 12.90 Price/BookRatio 2.69 3.62 5.41 5.82 Dividend Yield 2.51 3.00 4.40 2.9 Source: MSN Money ▪ Price/earnings ratio (P/E): This formula is calculated by dividing the price of the stock per share by the earnings per share. Although this calculation is simple, the information is readily available and the ratio is a good valuation method to use versus peers and for historical purposes. ▪ PEG ratio (Price to earnings growth ratio): This ratio is closely related to the first ratio, but it is slightly more dynamic and incorporates the estimated growth of a company. In the PEG ratio the formula uses the price/earnings ratio and then divides that number by the expected annual earnings per share growth rate. This is a great valuation method to use when considering whether a stock that is growing quickly is still a good value or not, but the method is also subject to objective guesses as to the growth rate. ▪ Price/cash flow ratio: This method measures the ability of a company to provide cash flow on a per share basis. The ratio is calculated by taking the stock price per share and dividing that by the operating cash flow per share. A top reason to use this method is that it typically excludes possible accounting distortions that other investment ratios might not be able to exclude. 10/18/2009 Procter & Gamble Page 36 of 87
  • 37.
    ▪ Price/book valueratio: The book value of a company is a nice conservative valuation method that value investors and more traditional investors love to use. The price book value ratio is found by taking the stock price per share and dividing it by the shareholder’s equity per share. Over the years the book value has lost importance in many circles due to its undervaluing of modern asset types. ▪ Dividend Yield: While not every stock has a dividend, understanding that a dividend yield is essential in valuing a company is important. An investor can find the dividend yield of a stock by taking the annual dividend amount per share and dividing that by the stock price per share. A Dividend yielding stocks are typically more mature and more value related, as opposed to growth stocks which often yield nothing or almost nothing. Valuation Conclusion: Although the P/E ratio is slightly higher than the peer comparison, the P/E ratio is in line with the industry. Plus, based on the more favorable P/E growth ratio, cash flow and book ratio, it appears P&G is a more valuable option than JNJ and KMB; therefore, investors are willing to spend more for an ownership interest in P&G. 2.4.2 Growth Analysis Growth ratios or growth rates tell us just how fast a company is growing. The most important of these growth ratios include: ▪ Sales %: Sales growth is normally stated in terms of a percentage growth from the prior year. Sales is the term used for operating revenues so it is important to see the sales growth rate as high as possible. 10/18/2009 Procter & Gamble Page 37 of 87
  • 38.
    Figure 6 Sales % 200 6 Kim be rly- Cla rk 200 7 Joh nso n & Joh nso n Pr octer & G amb le 200 8 0.0% 5.0% 1 0.0% 1 5.0 % 2 0.0 % 2 5.0 % 2008 2007 2006 Procter & Gamble 9.2% 12.1% 20.2% Johnson & Johnson 4.3% 14.6% 5.6% Kimberly-Clark 6.3% 9.1% 5.3% Source: Data and Chart constructed from each company’s 10-K Annual Report ▪ Net Income: Growth in net income is even more important that sales because net income tells you how much money is left over after all of the operating costs are subtracted from sales. Figure 7 Net Income % 2 5.00 % 2 2.40 % 2 1 .6 0% 19 .10 % 1 9.6 0% 2 0.00 % 16 .80 % 1 5.00 % 9.9 0% 1 0.00 % P ro cter & Ga mb le Jo hn so n & Jo hn son 5.00 % K imb e rly-Cl ar k 0.00 % 2 0 08 2 00 7 2 00 6 -5.00 % - 4.30 % -4 .40 % - 7.30 % -1 0.00 % 2008 2007 2006 Procter & Gamble 16.80% 19.10% 19.60% Johnson & Johnson 22.40% -4.30% 9.90% Kimberly-Clark -7.30% 21.60% -4.40% Source: Data and Chart constructed from each company’s 10-K Annual Report 10/18/2009 Procter & Gamble Page 38 of 87
  • 39.
    ▪ Dividends: Dividendgrowth is a good indicator of the financial health of a company. Some companies do not pay stock dividends at all; rather they use these excess profits to reinvest money back into the company to hopefully accelerate growth. One thing we like to see in Dividends (%) is that it does not go negative. That is, once a dividend rate is established, a company needs to have a very good reason to decrease the dividend payout. Figure 8 Dividend Yield % 20 06 Ki mbe rl y-Cla rk 20 07 Joh nso n & Joh nso n Pr octe r & G am ble 20 08 0.0 0% 0 .0 1% 0 .01 % 0.02 % 0.0 2% 2008 2007 2006 Procter & Gamble 0.01% 0.01% 0.01% Johnson & Johnson 0.01% 0.01% 0.01% Kimberly-Clark 0.01% 0.01% 0.01% Source: Data and Chart constructed from each company’s 10-K Annual Report Growth Analysis Conclusion: P&G has demonstrated a stronger ability to grow than JNJ ad KMB. P&G’s sales growth has outpaced their peers and has resulted in strong net income growth. P&G has been able to grow sales and net income year over year unlike its peers. 2.4.3 Profitability Analysis 10/18/2009 Procter & Gamble Page 39 of 87
  • 40.
    Profitability ratios orprofitability margins are a good indicator of how efficient a company is operating. This is a measure were you would normally compare a company to its industry as a benchmark rather than the overall stock market since the profitability of companies can vary greatly by industry. ▪ Gross Margin (%): Sales Revenue less COGS divided by net sales revenue Figure 9 Gross Profit Margin % 30% 2006 72% 51% 31% K imberly-Clark 2007 71 % Johnson & Johnson 52% P rocter & G amble 30 % 2008 71% 51% 0% 10% 20% 30% 40% 50% 6 0% 70% 80% 2008 2007 2006 Procter & Gamble 51% 52% 51% Johnson & Johnson 71% 71% 72% Kimberly-Clark 30% 31% 30% Source: Data and Chart constructed from each company’s 10-K Annual Report ▪ Earnings per Share trending Figure 10 10/18/2009 Procter & Gamble Page 40 of 87
  • 41.
    Earning per Share $5.00 $4.55 $4.25 $4.50 $4.14 $4.15 $3.76 $3.90 $4.00 $3.64 $3.50 $3.04 $3.00 $2.64 Procter & Gamble $2.50 Johnson & Johnson $2.00 Kimberly-Clark $1.50 $1.00 $0.50 $0.00 2008 2007 2006 2008 2007 2006 Procter & Gamble $3.64 $3.04 $2.64 Johnson & Johnson $4.55 $4.15 $3.76 Kimberly-Clark $4.14 $4.25 $3.90 Source: Data and Chart constructed from each company’s 10-K Annual Report ▪ Net Profit Margin (%): Gross sales revenue less all (not just COGS) expenses divided by gross revenue. The net profit margin is the ratio of net profits to sales. This is the best indicator of the company's efficiency in that net profit takes into consideration all expenses of the company. You want the net profit margin to be as high as possible. Figure 11 10/18/2009 Procter & Gamble Page 41 of 87
  • 42.
    Net Profit Margin% 25% 21% 20% 20% 17% 14% 14% 13% Procter & Gam ble 15% 10% Johnson & Jo hnson 10% 9% 9% Kimberly-Cla rk 5% 0% 2008 2007 2006 2008 2007 2006 Procter & Gamble 14% 14% 13% Johnson & Johnson 20% 17% 21% Kimberly-Clark 9% 10% 9% Source: Data and Chart constructed from each company’s 10-K Annual Report Profitability Conclusion: Although P&G shows solid profitability performance, JNJ appears to be the benchmark for our comparison. P&G demonstrates a strong gross margin and healthy net margin. However, both peer comparisons demonstrate stronger per share performance. 2.1.4 Financial Strength Analysis ▪ Current Ratio: current assets/current liabilities Figure 12 10/18/2009 Procter & Gamble Page 42 of 87
  • 43.
    Current Ratio 1.8 1.65 1.51 1.6 1.4 1.22 1.24 1.22 1.20 1.2 1.05 Procter & Gamble 1 0.79 0.78 Johnson & Johnson 0.8 Kimberly-Clark 0.6 0.4 0.2 0 2008 2007 2006 2008 2007 2006 Procter & Gamble 0.79 0.78 1.22 Johnson & Johnson 1.65 1.51 1.20 Kimberly-Clark 1.22 1.24 1.05 Source: Data and Chart constructed from each company’s 10-K Annual Report ▪ Quick Ratio: cash + net receivables + marketable securities/ current liabilities Figure 13 Quick Ratio 1.6 1.41 1.4 1.25 1.2 0.90 0.94 1 Procter & Gamble 0.70 0.74 0.8 J ohnson & Johnson 0.56 0.65 0.52 Kimberly-Clark 0.6 0.4 0.2 0 2008 2007 2006 2008 2007 2006 Procter & Gamble 0.52 0.56 0.90 Johnson & Johnson 1.41 1.25 0.94 Kimberly-Clark 0.70 0.74 0.65 Source: Data and Chart constructed from each company’s 10-K Annual Report ▪ Working capital: Current assets less current liabilities 10/18/2009 Procter & Gamble Page 43 of 87
  • 44.
    Figure 14 Working Capital $15,000,000 $10,000,000 $5,000,000 Procter & Gamble Johnson & Johnson $0 Kimberly-Clark 2008 2007 2006 ($5,000,000) ($10,000,000) 2008 2007 2006 Procter & Gamble ($6,443,000) ($6,686,000) $4,344,000 Johnson & Johnson $13,525,000 $10,108,000 $3,814,000 Kimberly-Clark $1,061,000 $1,168,000 $253,000 Source: Data and Chart constructed from each company’s 10-K Annual Report ▪ Times interest earned: Net income + interest exp + income tax expense divided by interest expense Figure 15 Times -Interes t-Earned 200 175.44 180 160 140 120 Procter & Gamble 100 95.73 J ohnson & Johnson 80 Kimberly-Clark 60 29.77 40 8. 23 5.59 7.93 6.88 7.75 6.81 20 0 2008 2007 2006 2008 2007 2006 Procter & Gamble 8.23 7.93 7.75 Johnson & Johnson 29.77 95.73 175.44 Kimberly-Clark 5.59 6.88 6.81 Source: Data and Chart constructed from each company’s 10-K Annual Report 10/18/2009 Procter & Gamble Page 44 of 87
  • 45.
    ▪ Debt-equity ratio:Total liabilities/ total shareholders equity Figure 16 Debt-to-Equity Ratio 2 00 6 ` K imb er ly-Cla rk 2 00 7 Jo hn son & Joh n son P rocte r & G am bl e 2 00 8 0 0 .5 1 1.5 2 2 .5 3 3 .5 2008 2007 2006 Procter & Gamble 1.07 1.07 1.16 Johnson & Johnson 1.00 0.87 0.79 Kimberly-Clark 3.40 2.34 1.80 Source: Data and Chart constructed from each company’s 10-K Annual Report ▪ Debt-to-Assets Ratio: total liabilities/total assets Figure 17 Debt-to-Assets Ratio 0.8 0.73 0.66 0.7 0.64 0.6 0.54 0.52 0.50 0.52 0.5 0.46 0.44 Procter & Gamble 0.4 Johnson & Johnson 0.3 Kimberly-Clark 0.2 0.1 0 2008 2007 2006 2008 2007 2006 Procter & Gamble 0.52 0.52 0.54 Johnson & Johnson 0.50 0.46 0.44 Kimberly-Clark 0.73 0.66 0.64 Source: Data and Chart constructed from each company’s 10-K Annual Report 10/18/2009 Procter & Gamble Page 45 of 87
  • 46.
    Financial Strength Conclusion:As an investor, I would like to see P&G work to become more liquid and slightly more conservative in their use of debt to finance the organization. JNJ again is the benchmark to compare against. JNJ has a more liquid balance sheet and has no concern in covering interest owed. Although, P&G is not as strong as JNJ, P&G is not leveraged as much as KMB. 2.1.5 Dividend Analysis Figure 18 10/18/2009 Procter & Gamble Page 46 of 87
  • 47.
    Dividend Rate andYield Ratio 5.00% 4.08% 4.00% 3.28% 2.73% Procter & Gamble 3.00% 2.40% 1.76% 1.96% Johnson & Johnson 2.00% Kimberly-Clark 1.00% 0.00% Div idend Rate Dividend Yield Dividend Payout Ratio 70.00% 60. 56 % 60.00% 46 .41 % 50.00% 4 1.7 6% Proc ter & Gamble 40.00% Johnson & Johnson 30.00% Kimberly-Clark 20.00% 10.00% 0.00% D ividend Payout Ratio Dividend Dividend Payout Dividend Rate Yield Ratio Procter & Gamble 1.76% 2.73% 46.41% Johnson & Johnson 1.96% 3.28% 41.76% Kimberly-Clark 2.40% 4.08% 60.56% Source: Data and Chart constructed from Key Financials MSN Money and Finance AOL Dividend Analysis Conclusion: All three companies pay a reasonable dividend yield. One can assume that since P&G’s yield is lower and growth rate higher than peers (as identified above) that P&G is investing its earnings back into the organization. KMB 10/18/2009 Procter & Gamble Page 47 of 87
  • 48.
    which has ahigh Debt to Asset ratio is choosing to pay its shareholders rather than fund its operation. JNJ appears to be a healthy blend between the two. 2.1.6 Management Efficiency Analysis Figure 19 Management Efficiency 120 100 80 Pro cter & G amble 60 Johnson & Johnson 40 Kim berly-Clark 20 0 Days in Inventory Avg. Return on Return on Return on In ventory Turnover Collection Equit y (pe r As se ts I nvested Period share) Ca pital Return on Avg. Equity Return Return on Days in Inventory Collection (per on Invested Inventory Turnover Period share) Assets Capital Procter & Gamble 75.48 4.84 38.35 17.62 10.24 13.85 Johnson & Johnson 99.62 3.66 75.29 30.22 15.98 24.68 Kimberly-Clark 67.12 5.44 49.31 37.35 9.82 16.09 Source: Data and Chart constructed from Finance AOL and each company’s 10-K annual report Management Efficiency Conclusion: Although P&G is not the lagging in all measurements, they are behind in return on equity. JNJ has a strong return due to the strength of their operation. KMB has chosen to limit the shares outstanding and finance a large percentage of the organization; as a result their return on equity is high. P&G is a solid performer in the middle of the pack and could use its peers to benchmark against. 2.1.7 Stock Price Analysis According to MorningStar.com Procter & Gamble stock opened at $57.37 on October 13, 2009. Procter & Gamble’s stock price closed at $57.26. By the end of the 10/18/2009 Procter & Gamble Page 48 of 87
  • 49.
    trading day P&Ghad a volume of 11.28 million shares and a 52wk range is $43.93 to $66.82 as per figure below. Figure 20 Source: http://www.wikinvest.com/stock/Procter_%26_Gamble_Company_(PG)/WikiChart MorningStar.com also reported that Kimberly-Clark’s stock opened at $59.38 on October 13, 2009. KMB’s stock price closed at $59.01. By the end of the trading day KMB had a volume of 1.81 million shares and a 52wk range is $43.05 to $62.05 as per figure below. Figure 21 Source: http://www.wikinvest.com/stock/Kimberly-Clark_(KMB)/WikiChart?ref=topnav Johnson & Johnson’s stock price opened at $60.92, on October 13, 2009. JNJ’s stock price closed at $61.01. By the end of the trading day JNJ had a volume of 23.50 million shares and a 52wk range is $46.25 to $63.01 as per figure below. Figure 22 10/18/2009 Procter & Gamble Page 49 of 87
  • 50.
    Source: http://www.wikinvest.com/stock/JOHNSON_%26_JOHNSON_(JNJ)/WikiChart Stock PriceAnalysis: JNJ has the largest market capitalization of the three and appears to be a more liquid asset (since the trading volume is significantly more). Based on the analysis performed above, one would expect JNJ to demand a higher stock price and the other two close behind. Also, based on KMB highly leveraged position, one would expect its stock price to be more volatile than PG, and based on this one day snap shot, this hypothesis holds true. 2.1.8 Summary of Financial Analysis P&G’s stock price in relation to its peers sums up all the financial ratios in comparison to KMB and JNJ. While PG has certain strong ratios, PG is not an industry leader. JNJ is the most financially sound of the three companies and KMB has a higher Owner’s equity return (but are more risky due to leveraging). PG is a solid blend that is demonstrating strong growth compared to its peers, and appears to be a solid value play for investors. 2.2.0 Strategic Analysis Strategic analysis consists of measuring the strengths and weaknesses of a company's position. There are a number of tools or methods used as the foundation for strategic analysis of a business. Understanding and analyzing all these factors is crucial to developing current strengths into competitive advantages over competition and improving certain weaknesses that hinder a company's efficiency and growth. An organization's core competencies should be focused on satisfying customer needs or 10/18/2009 Procter & Gamble Page 50 of 87
  • 51.
    preferences in orderto achieve above average returns. This is done through Business- level strategies. Business level strategy is an integrated and coordinated set of commitments and actions a firm uses to gain a competitive advantage by utilizing its core competencies in specific product markets. 2.2.1 Current Business Level Strategy P&G is a global manufacturer and marketer of consumer products. The company markets more than 300 brands in over 180 countries spanning Americas, Europe, the Middle East and Africa, and Asian region. The company is currently organized into three separate Global Business Units (GBUs. The three GBUs are: Beauty, Health and Well- Being, and Household care. Figure 23 10/18/2009 Procter & Gamble Page 51 of 87
  • 52.
    Procter & Gamble Health and Household Beauty GBU W ell-B eing Care GBU GB U Sn acks, Coffee, Fabric Care and Baby Care and Beau ty Groo ming H ealth Care and Pet Care H ome Care Family Care A riel H ead & Braun Acto nel Dawn Bo un ty Shou ld ers Fusion Always Iams Down y Charmin Olay Gillette Crest Prin gles D uracell Pampers Pan tene Wella M ach 3 O ral-B Gain T id e Source: Organizational Chart constructed from P&G’s 10-K annual report 2.2.2 Elements of Company’s Strategy P&G new CEO Bob McDonald, who assumed office in July, has laid out P&G new company strategy which will be centered on company values and a sense of purpose. McDonald said that P&G will “focus on touching and improving more consumers' lives in more parts of the world... more completely." McDonald calls P&G's purpose the most consistent factor in a 171-year history of the company. He said P&G will continue to provide branded products of superior quality 10/18/2009 Procter & Gamble Page 52 of 87
  • 53.
    and value thatimprove the lives of the world's consumers, now and for generations to come. He believes that as a result of P&G’s new company strategy will cause consumers to reward P&G with leadership sales, profit and value creations, and “allowing our people, our shareholders, and the communities in which we live and work to prosper." (Kanter, 2009) 2.2.3 Components of Company’s Business Level Strategy Efforts to build competitive advantage In an effort to continue its global leadership position and create an additional competitive advantage, P&G has partnered with Cisco System to help develop its next phase in supply chain management “Smart Packaging”. “Smart Packaging,” is a highly innovative system that will enable the company to look at its supply chain from a consumer’s perspective. Smart Packaging will embed a chip into every item in the store, providing more information than today's standard barcodes. By creating an easy way to track products through the factory, on delivery trucks, and in the stores, this innovation will dramatically increase supply chain efficiency. Smart-chip technology will result in fewer out-of-stocks, greater on-time delivery, better products, and an enhanced user experience for consumers (Procter & Gamble, 2002). Collaborative partnerships and strategic alliance P&G will outsource its worldwide print operations to Xerox. This collaborative partnership with Xerox will allow P&G to reduce operational costs by an estimated 20-25 percent. The five-year services contract calls for Xerox to manage P&G's print shops, offices and home-based work settings. Working with Xerox, P&G has the opportunity to deliver substantial sustainability benefits in addition to cost savings and increased user 10/18/2009 Procter & Gamble Page 53 of 87
  • 54.
    satisfaction and reliability.P&G predicts it will reduce print-related power usage by 30 percent and paper consumption by 20-30 percent annually. (Xerox.com) Distribution P&G is currently working with i2 Technologies to support the physical distribution of its North American operations. Utilizing the i2 Freight Matrix transportation solution, P&G is working to drive efficiency across its finished product logistics through improved carrier selection, event management and dashboard reporting. Human Resource Strategy Procter and Gamble view their more than 138,000 employees as the most important asset of the company and encourage them to have the same values and principles as the company. All employees of Procter and Gamble are considered leaders and encouraged to take responsibility to do the best that they can while meeting business needs, bettering the system and helping those around them (PG.com). According to P&G’s 2009 Annual Report, its human resource strategy is built of five core values: I. Hire the Best P&G claim that almost 500,000 people apply for P&G jobs every year and that they normally only hire less than 1% of those applicants. P&G believes that it attracts top talent because of its reputation as a great company for current and future leaders II. Challenge P&G People from Day One P&G has learned that “there’s no substitute for hands-on experience when it comes to leadership development.” To help develop this leadership P&G has created consequential responsibilities for every employee. Its assignments typically demand collaboration inside and outside the Company, disciplined project management and the need to be in touch with consumers, retail customers and other external stakeholders. III. Business and Functional Leaders Actively Recruit, Teach and Coach At P&G, leadership by example starts from the top. P&G’s Chairman of the Board and former CEO A.G. Lafley, Corporate Officers, Presidents and Functional Officers recruit on college campuses and teach in their executive education programs. These 10/18/2009 Procter & Gamble Page 54 of 87
  • 55.
    senior executives alsoact as mentors and coaches for younger managers, helping them develop the skills necessary to lead large businesses and organizations. IV. Plan Careers P&G believes in creating career opportunities and not just jobs. P&G has been very successful in managing its talent globally and enable career development and growth across businesses and geographies. P&G tries to identify talent early on and groom people through a series of varied and enriching assignments that will prepare them for future roles. V. Never Stop Learning P&G provides a plethora opportunities to develop technical, functional and leadership skills training. These programs are offered at different level of development or new assignments. This process not only helps P&G people develop business skills but also deepens their commitment to touching and improving P&G’s consumers’ lives. R&D, Technology, engineering strategy As part of its ongoing initiative to be a supply chain leader and optimize trading partner relationships, P&G uses Axway’s business-to-business (B2B) solution for their external managed file transfers. The solution delivers secure file transfer with real-time visibility and control, improving communication within and outside P&G. It also offers the agility P&G needs to respond quickly to changes in its supply chain. Currently, orders, invoices, shipment notifications and other message files flow through the Axway gateway daily at P&G, for a total of more than one million files per month, all of which must be processed automatically and on time for business to flow. Transmission failures and system downtime would interrupt P&G’s entire supply chain, negatively impacting production and revenue (Procter & Gamble to Deploy I.D., 2009). Sales, Marketing & Promotion P&G is reinventing marketing in a digital world, by using innovative Web-based techniques to improve its already considerable consumer listening capabilities. P&G is now conducting online consumer research and concept studies that dramatically reduce 10/18/2009 Procter & Gamble Page 55 of 87
  • 56.
    the time requiredto gather and analyze consumer opinions. Best of all, online consumer research reduces costs yet delivers highly reliable results that enable P&G to get to market faster with new products that customers will buy, all critical success factors in its business-to-consumer strategy. Current Chairman of the Board, A.G. Lafley, stated that “A year or two ago, we would do thousands of concept tests and consumer panels worldwide, which would take six to eight weeks. Today we do the majority of our concept tests in 48 to 72 hours online at a fraction of the cost and with equal or higher reliability. That's the kind of power the Internet can bring” (Procter & Gamble, 2002). Moves to respond and react to changing conditions With an eye toward expanding retail coverage and providing better service at lower cost, P&G implemented an online system called “Web Order Management” that enables retail customers to connect directly to P&G anytime, from anywhere. This online business-to-business (B2B) network gives retailers full access to P&G promotions, inventory, and scheduling information. It also allows retailers to easily place and manage orders on the Web. 2.2.4 How well the Company’s Strategy is working P&G has leading market positions across most of its businesses. It competes primarily in 22 global product categories and is a market leader in over two-thirds of these categories. P&G is the global market leader in beauty segment with leading market shares of over 20% and 33% in the hair care and feminine care categories respectively, owing to its brands Always, Head & Shoulders, Olay, Pantene and Wella. The company also holds a leading position in oral care. In pharmaceuticals and personal health, P&G has approximately 33% of the global bisphosphonates market for the treatment of 10/18/2009 Procter & Gamble Page 56 of 87
  • 57.
    osteoporosis under theActonel brand. The company is also a global leader in nonprescription heartburn medications and in respiratory treatments. Actonel, Crest, and Oral-B are well known brands in the company's health care segment. The company is also the market leader in fabric care with global market share of approximately 33%, with key brands such as Ariel and Tide. In baby care, the company has a global market share of over 32%, competing through the strong Pampers brand. The acquisition of Gillette has enabled P&G to hold leading market share in manual blades and razors segment with a global market share of approximately 70%. Leading market position provides it with significant competitive advantage as well as stabilizes the company's financial growth. 2.2.5 Summary of Strategic Analysis New President and C.E.O. of Procter & Gamble, Bob McDonald, has laid out the strategic focus of P&G for the next decade. McDonald says that P&G will refocus its energy on bettering its relationships with retailers, suppliers, and innovation partners while continuing to provide innovative products to customers worldwide. McDonald says that P&G is positioned to “grow by touching and improving the lives of more consumers in more parts of the world…more completely.” In order to fulfill this new promise P&G will have to focus on building its market share with its core brands, expand its product portfolios, and increase market share in emerging markets. P&G will also have to better control its pricing and reduce outside vendors like Wal-Mart’s ability to dictate its product’s pricing. They will also want to leverage their competitive strengths and economies of scale by using new technological advancement to improve their supply chain efficiency. Finally, P&G will want to continue its strong support and funding of its world class research and development in order to continue to provide innovative products to touch the lives of customers worldwide. 10/18/2009 Procter & Gamble Page 57 of 87
  • 58.
    2.3.0 Value ChainAnalysis The Value Chain Analysis has been utilized in both organizational and business studies for many decades. This fundamental approach allows a company such as P&G to obtain a competitive advantage over the other competitors in the industry. Specifically, the value chain analysis is a process that starts from the acquisition of the raw materials to the actual physical products sold by the company. The figure below illustrates the current household and personal care industry supply chain. In the context of a diversified business, the context of the value chain and the individual activities involved in the process are imperative in determining strategic benefits. Value Chain activities include: inbound logistics, technology, operations, sales and marketing, distribution, and service. Figure 24 Source: Chart constructed from An International Journal 2.3.1 Analysis of Primary Activities 10/18/2009 Procter & Gamble Page 58 of 87
  • 59.
    P & Gdeveloped extensive economies from its scale of operations in finance, logistics, marketing, research, new product development, innovation, technology and other functions. It is the global leader in all its four core categories - fabric and home care, beauty care, baby and family care, health care. Its products are sold in over 160 countries worldwide with manufacturing capabilities in over 42 countries. The company manufactures and markets close to 300 products. P & G also significant buying power from commodities to media and is being gradually leveraged through global procurement and services. A large scale gives P&G important competitive advantages against the smaller, capital restricted players in both the local and global markets. Supply Chain Management Procter & Gamble, a world leader in consumer packaged goods, sells nearly 300 brands in more than 160 countries. It has sales of $40 billion a year and 130 manufacturing sites around the world. P&G measures consumer satisfaction at two levels, which it calls the two “moments of truth.” The first moment of truth occurs when the consumer reaches the shelf and finds that the desired product is, or is not, available. This is a critical moment, because if the product is not immediately available, the consumer usually moves on to buy a rival product. The second moment of truth depends on the buyer’s satisfaction when consuming the product. Optimizing supply chain performance demands a drastic new look at the way the partners in the supply network collaborate, involving retailers, manufacturers and service providers. P &G’s goal has been to create adaptive, reactive supply networks that will link together sales and supply processes, inside and outside the organization, to improve product availability. If successful, this would allow P & G to develop demand chain management capabilities, especially for promotions. Promotional items are the highest 10/18/2009 Procter & Gamble Page 59 of 87
  • 60.
    priority for P& G, because of the large sum of money involved in its marketing programs. If manufacturers cannot deliver the product on time all of the time, they lose all the growth that should be generated by their marketing promotions. Operations P&G is a global manufacturer and marketer of consumer products. The company markets more than 300 brands in over 180 countries spanning Americas, Europe, the Middle East and Africa (EMEA), and Asian region. The company is organized into three Global Business Units (GBUs) and a Global Operations group. The three GBUs are beauty, health and well-being, and household care. The Global Operations group consists of the Market Development Organization (MDO) and Global Business Services (GBS). Distribution Links between supply chain planning and supply chain execution processes are critical for P & G continued success. P&G expects major changes in the transportation area, including improved partnership with logistics outsourcers and more use of techniques such as cross-docking. This system, under which inbound trucks are unloaded and the goods are sorted and loaded straight onto outbound vehicles, without ever being put into store, will be used to drastically cut inventory and handling costs, as well as delivery times. Daily planning will be phased out for a more efficient continuous plan- make-ship process, which will demand improved loading techniques to make efficient use of vehicles as shipment sizes become smaller. Sales and Marketing Currently, P&G sales and markets over 300 brands in over 180 countries to over 4 billion customers. Twenty-three of these brands are categorized by P&G as “Billion- Dollar Brands.” To be categorized at a “Billion-Dollar-Brand” a product must generate 10/18/2009 Procter & Gamble Page 60 of 87
  • 61.
    more than onebillion dollars in sales each year. The chart below represents the dollar amount and percentage of net sales for the three GBUs. Figure 25 Net Sales GBU Reportable Segment Billion-Dollar Brands (in bi llio ns) Head & Shoulders, Olay, Beauty Beauty Pantene, Wella $26.3 Braun, Fusion, Gillette, Grooming Mach3 Actonel, Always, Crest, Health and Well-Being Health Care Oral-B $16.7 Snacks and Pet Care Iams, Pringles Fabric Care and Home Ariel, Dawn, Downy, Household Care Cared Duracell, Gain, Tide $37.3 Bab y Care and Fa mily Bounty, Charmin, Care Pampers Source: PG.com Figure 26 2009 GBU Net Sales 33% Beauty 46% Health and Well-Being Household Care 21% Source PG.com Jake Barr who is in charge of supply chain innovation at P&G says that some 60% of P&G’s sales come from what he calls "events." Barr says that these are promotions that the supermarket, convenience store or other retailer executes with price cuts or other incentives; or they take the form of discount coupons and price promotions mailed out or distributed in a store by P&G itself. 10/18/2009 Procter & Gamble Page 61 of 87
  • 62.
    In the past,P&G would use what Barr called a "push" system for moving products out the store door. Independent of what retailers were doing, P&G typically forecast sales for its major product. Then P&G would tweak sales throughout the year by offering and distributing coupons and other incentives designed to entice enough customers to buy, moving products off store shelves. But with the majority of sales now coming from promotional events, Barr and his Global Product Supply team studied the pull systems of efficient distributors of consumer and industrial products. When Barr's team started to tackle the problem of shifting from a push system to a pull system, their main focus was to take the disorder and confusion out of the delivery system by bringing retailers and suppliers into the planning and delivery process. With everyone on the same page, Barr said that the "signals" of consumer demand would come from the stores; "responses" would come from P&G manufacturing managers, supply chain managers and suppliers, who would key production of new products to sales reports coming from the stores. With the new system in place Barr says that “The fact that our sales of P&G products are up 15% in the past year tells you how effective this system is." Service P&G places emphasis on its principal business goal of providing its customers with the right products at the right price all the time. The company spends over $80 million dollars a year on advertising its products. The company has 5,000 key retailers and more than 30,000 key suppliers to help make sure that its products are always in stock and ready for purchase. 2.3.2 Analysis of Support Activities Product R&D 10/18/2009 Procter & Gamble Page 62 of 87
  • 63.
    Product R&D hasbeen the most important factor in Procter and Gamble’s legendary 172 year history. P&G believes that outstanding products are created by outstanding people. Within R&D, P&G has a strong commitment to find the best researchers, and retain them with a culture designed to reward success, stimulate learning, challenge complacency and nurture innovation. P&G currently holds more than 25,000 active patents worldwide and it draws upon the talent of its 7,500 Ph.D.s with researchers in over 71 countries. On average P&G invests up to 4% of worldwide sales to the R&D department every year. Human Resource Management P&G has a long history of human resource practices that have supported high effectiveness in R&D. No factor has played a more important role in the success of R&D at P&G than its record of hiring and retaining some of the most talented people in the industry. P&G employees and R&D staff members are rewarded and acknowledged for their contributions through financial compensation, promotions, freedom to influence project selection and financial support for their projects. P&G offers extensive training programs to assist its employees to achieve both personal and professional goals. These programs include self-directed training for high- potential junior staff; global training programs on how to manage the innovation process; internal technical symposiums to share knowledge and keep personnel at the forefront of technical disciplines; a worldwide electronic system of communications for sharing knowledge; and a liberal policy for attending outside professional society and other technical meetings (PG.com). General Administration 10/18/2009 Procter & Gamble Page 63 of 87
  • 64.
    P&G uses I.D.Systems, Inc.’s Vehicle Management Systems (VMS) to help improve workplace safety and security by restricting vehicle access to trained, authorized operators, providing electronic vehicle inspection checklists, and sensing vehicle impacts. VMS helps P&G reduce fleet maintenance costs by automatically uploading vehicle data, reporting vehicle problems electronically, scheduling maintenance according to actual vehicle usage rather than by calendar or manual data entry, and helping determine the optimal economic time to replace equipment. In addition, VMS helps improve P&G supply chain productivity by establishing accountability for the use of equipment, ensuring equipment is in the proper place at the right time, streamlining material handling work flow, and providing unique metrics on equipment utilization. (Procter and Gamble to Deploy I.D., 2009) 2.3.3 Analysis of Company’s Cost Competitiveness in relation to Rivals The consumer household and personal care product industry is a highly competitive industry. The global household and personal products industry consists of the global household products and global personal product markets. Players are manufacturers of fragrances, hair care, make-up, oral hygiene, personal hygiene and skincare, air fresheners, bleach, dishwashing products, furniture polish, general purpose cleaners, insecticides, scouring products, textile washing products and toilet care products. Perhaps the three most significant competitors are Procter and Gamble (P&G), Johnson & Johnson (JNJ) and Kimberly-Clark (KMB). Procter and Gamble because of its sheer economies of scale, number of products, research and development expenditures, and sheer size has allowed it to become the global market leader in this industry. In fact, P&G is sometimes characterized as a category killer in its particular industry segment. P&G dominates the consumer product 10/18/2009 Procter & Gamble Page 64 of 87
  • 65.
    goods industry with$83,503 million in revenues reported for its most recent SEC filing (Procter, 2008) P&G owns and operates 39 manufacturing facilities in the US located in 23 different states. Furthermore, the company owns and operates a total of 103 manufacturing facilities in 42 countries and employs over 138,000 employees. P&G manufactures beauty products (42 locations), grooming products (13); fabric care and home care products (49); baby care and family care products (29); pet care, snacks and coffee products (15); and health care products (37). P&G sells its products through mass merchandisers, grocery stores, membership club stores, drug stores and in high-frequency stores. Johnson & Johnson (J&J) is a global manufacturer of health care products as well as a provider of related services. JNJ has more than 250 operating companies in 57 countries employing 117,000 people. The company operates predominantly through three divisions: consumer, pharmaceuticals and medical devices and diagnostics. Johnson & Johnson Consumer specializes in producing and marketing well known brands of personal care, baby care, wound care, skin care, oral care, wound care, women's health care, nutritional and over-the-counter pharmaceutical products. These products are distributed either through wholesalers or directly to independent and chain retail outlets. Johnson & Johnson was second in the industry with a reported $63,747 million in revenues. Johnson & Johnson also sells its products through grocery stores, membership clubs, drug stores, and mass merchandisers. Kimberly-Clark is also one of the leading consumer product companies in the world. It has operations in 38 countries and sells its products in more than 150 countries and employing 53,000 people. The company's business is divided into four segments: personal care, consumer tissue, K-C professional (Kimberly-Clark professional) and 10/18/2009 Procter & Gamble Page 65 of 87
  • 66.
    other, and healthcare. It currently holds the first or the second position globally in terms of market share in more than 80 countries. KMB recorded revenues of $19,415 million during the 2008 financial year that ended in December. The company sells its products directly, and through wholesalers, to supermarkets, mass merchandisers, drugstores, warehouse clubs, variety and department stores and other retail outlets. Procter and Gamble will continue to rely on its economies of scale and market specialization to help achieve cost competitiveness in relation to its rivals. 2.3.4 Summary of Value Chain Analysis Excellence in supply chain management is an important component of corporate strategy at Procter & Gamble. The company has been in the forefront of implementing superior supply chain practices in concert with its suppliers and customers, with practices that have led to savings across the entire supply chain spectrum for the benefit of the end consumer. Procter & Gamble continuous market dominance will be largely dependent on its ability to use technological advancement to create more adaptive, reactive supply networks that will link together sales and supply processes, inside and outside the organization, to improve product availability. In order to achieve this goal P&G will have to work with outside vendors and consultants to establish best in market practices to create strategic competitive advantages that will be hard for its competitors to duplicate. In addition to outside assistance, P&G will have to make sure information flows freely between front line employees, top management, and the R&D department in order to provide the best products available to customers worldwide. 2.4.0 SWOT Analysis SWOT Analysis, is a strategic planning tool used to evaluate the Strengths, Weaknesses, Opportunities, and Threats of an organization. It involves specifying the 10/18/2009 Procter & Gamble Page 66 of 87
  • 67.
    objective of thebusiness venture or project and identifying the internal and external factors that are favorable and unfavorable to achieving that objective. The aim of any SWOT analysis is to identify the key internal and external factors that are important to achieving the objective. SWOT analysis groups key pieces of information into two main categories: Internal and External factors. The internal factors may be viewed as strengths or weaknesses depending upon their impact on the organizations objectives. What may represent strengths with respect to one objective may be weaknesses for another objective. The external factors may include macroeconomic matters, technological change, legislation, and socio-cultural changes, as well as changes in the marketplace or competitive position. 2.4.1 Strengths ▪ Strong Brand Name P&G is the world's largest consumer goods company that markets more than 300 brands in over 180 countries. Some of P&G most successful and famous brands include: Pampers, Tide, Ariel, Always, Whisper, Pantene, Bounty, Pringles, Folgers, Charmin, Downy, Lenor, Iams, Crest, Clairol Nice ’n Easy, Actonel, Dawn and Olay. According to P&G’s strong brand leadership enables brand building innovations with retail and media partners giving a distinct competitive advantage (Bannister 2006). ▪ Research and Development P&G has strong research and development capacity with nearly 7,500 PhD’s and researchers in over 71 different countries. P&G has over 20 technical centers on four continents and more than 25,000 active patents for its products. In 2005, P&G invested $1.8 billion dollars, which was 3.5% of Net Outside Sales in research and development. 10/18/2009 Procter & Gamble Page 67 of 87
  • 68.
    Over the pasteight years, P&G has introduced the number one or number two new non- food products every year (Buckley 2006). ▪ Global Operations P&G has global operations and is able to derive substantial economies in finance, logistics, marketing, research, new product development, innovation, technology and other functions. The company’s huge buying power (from commodities to media) also enables it to leverage through global procurement and gives significant competitive advantage against the smaller, unorganized players in different markets. ▪ Strong Distribution Infrastructure The company has a very strong distribution infrastructure consisting of exclusive distributors worldwide selling only P&G products enabling the company to market faster and more efficiently, without multiple wholesaler markups that typically occur under the wholesaler system. ▪ Strong performance in core businesses On a worldwide basis, fabric & home care, beauty care, and baby & family care products are P&G’s largest businesses, contributing a total of roughly 80% of company sales (Roberts, 2006). Strong performance by its core business groups has contributed to the company’s above industry average revenue growth rates. 2.4.2 Weakness ▪ Lack of diversified customer portfolio P&G’s top 10 customers account for 35% of its sales. Thus, the company’s revenues are concentrated among a few top customers, which could be a weakness for the company in the case that any of these top customers experiences any financial difficulties in the future. Wal-Mart is P&G’s largest customer and accounted for over 15% of P&G total revenue in 2009, 2008, and 2007 (Procter & Gamble, 2009). 10/18/2009 Procter & Gamble Page 68 of 87
  • 69.
    ▪ Overdependence onmature markets P&G has been focusing quite a lot on mature markets like USA and Western Europe with 26% and 22% of company’s sales respectively (Bannister 2006). On the other hand, the sales in the emerging markets is 35% of sales only and the weakness of P&G is that not much effort has been put in growing in the these emerging markets, which could hamper the growth of the company in the future. ▪ Quality Control Procter and Gamble has quality control problems with some of their products. They have placed recalls on certain products such as Swiffer Vacuum Cleaner and pet food for dogs and cats. If they have continual recalls, it could tarnish their brand image leading to lower customer loyalty (PG.com). 2.4.3 Opportunities ▪ Emerging, developing markets The emerging markets of Latin America, China, India, Middle East, Korea, and trading bloc of ASEAN present significant opportunities for P&G because of the growth in incomes, an emerging middle class, and household formulations. These factors will drive the emerging markets and will make them more attractive in the future especially for the consumer products manufacturing companies like P&G. The markets of Eastern Europe and the People's Republic of China are among those offering huge potential as their populations become more affluent. Figure 27 10/18/2009 Procter & Gamble Page 69 of 87
  • 70.
    2009 Net Salesby Geographic Region North America 32% Western Europe 43% Japan 4% Emerging/Developing Markets 21% Source: P&G Annual 10-K Report ▪ Acquisitions and resultant value generation P&G has grown through acquisitions in the past and further acquisition opportunities will be available for the company. However, a more important factor is the set of opportunities these acquisitions provide for P&G. The recent acquisition of Gillette provided P&G with other brand named products like Duracell batteries and Braun shavers and razors. P&G will benefit the latter from synergies in emerging markets according to Jones (2006), cross-leveraging shaving and skin care market segment and add value to P&G. ▪ Sell or Spinoff of Assets The sell of some assets such as Duracell batteries, Braun, Folgers coffee, Pringles chips, and pet food business including Iams and Eukanuba could allow P&G to streamline its portfolio and return cash to shareholders or increase its financial bottom line. According to Lauren Lieberman, an analyst at Lehman Brothers, a recent article in the New York Times, “P&G could pull in after-tax proceeds of $4.1 billion for Duracell, $1.5 billion for Braun, $4.1 billion for coffee and snacks and more than $2 billion for the pet-food business.” P&G could also decide to leverage a spinoff of these companies 10/18/2009 Procter & Gamble Page 70 of 87
  • 71.
    instead of sellingthe outright. Lieberman says that “a reverse leveraged spinoff, which often includes an investment from a private equity firm, or as a “supercharged I.P.O.,” which is how General Electric split off its Genworth Financial subsidiary” (Should Procter, 2007). 2.4.1 Threats ▪ Intense competition The markets in which P&G operates are very competitive with players like Johnson & Johnson, Unilever and Kimberly-Clark (Bartlett, 2005). This could be a competitive threat for P&G as these competitors continually innovate and price their products competitively. An increase in competitive onslaught by a majority of these competitors is expected to be a further threat to P&G’s growth. ▪ Increase in Cost of Raw materials P&G depends heavily on a wide basket of global commodities for manufacturing its goods, the prices for which have risen nearly 50% since 2002. Nearly half of the company's cost of goods is directly related to commodity goods. The company has increased prices due to higher costs of oil and other raw materials. During one of its most recent conference call with analyst, P&G stated that it expected raw material costs to increase $3 billion in 2009. ▪ Current Credit Crisis P&G currently generates significant operating cash flows, which combined with access to the credit markets provides them with significant discretionary funding capacity. However, current uncertainty in global economic conditions, resulting from disruptions in credit markets, poses a risk to the overall economy that could impact consumer and customer demand for P&G’s products, as well as its ability to manage 10/18/2009 Procter & Gamble Page 71 of 87
  • 72.
    normal commercial relationshipswith its customers, suppliers and creditors, including financial institutions. If the current situation deteriorates significantly, P&G business could be negatively impacted, including such areas as reduced demand for the company’s products from a slow-down in the general economy, supplier or customer disruptions resulting from tighter credit markets and/or temporary interruptions in its ability to conduct day-to- day transactions through their financial intermediaries involving the payment to or collection of funds from its customers, vendors and suppliers. If the current credit crisis were to continue to worsen such that the company were unable to access the credit market, it could impair its ability to fund discretionary spending. ▪ Technology Infrastructure P&G rely extensively on information technology systems in relation to their current computer network. Some of these systems are managed and controlled by third- party service providers (3PSP). These systems are critically important as they allow P&G to communicate and interact with both internal and external stakeholders. These interactions include, but are not limited to, ordering and managing materials from suppliers, converting materials to finished products, shipping product to customers, processing transactions, summarizing and reporting results of operations, complying with regulatory, legal or tax requirements, and other processes necessary to manage the business. P&G insists that if their systems are damaged or cease to function properly due to any number of causes including power outages and security breaches, they may suffer interruptions in their ability to effectively manage operations which may negatively impact their operations and/or financial condition. ▪ Government Regulation Changes 10/18/2009 Procter & Gamble Page 72 of 87
  • 73.
    Since P&G isa U.S. based multinational company, it is subjected to changes in laws and regulations in both U.S. and other foreign governments. P&G states that such changes can significantly alter the environment in which it operates. Failure to successfully manage these changes can result substantial fines and penalties that will affect their financial results. 2.4.5 Summary of SWOT Analysis SWOT analysis is a general technique for assessing any public or private organization and its environment. It belongs to the “Analysis” part of a strategic planning process and helps decision-makers to focus on key issues. Performing a SWOT analysis involves the generation and recording of the strengths, weaknesses, opportunities and threats concerning the organization. The decline of the US dollar to foreign currencies makes international trading promising due to the changeover of exchange rates. P&G must continue to scan the environment for new trends, technological advancements, political threats, and combat counterfeit products. In Summary, Procter and Gamble has an enormous opportunity for continued growth and market dominance. To keep its current percentages of market share, P&G needs to place high priority on research and product development and new product innovation activities. Marketing strategies and brand name awareness will continue to set P&G apart from its competitors. An important growth factor is the implementation of their products to internationally emerging markets such as Latin America, India and China. These emerging markets have projected higher population rates and a growing middle class society. Growth in foreign markets will provide P&G with strong future 10/18/2009 Procter & Gamble Page 73 of 87
  • 74.
    revenue, along withits “recession-proof” products available to consumers worldwide. Table 5 blow is a summary of P&G SWOT Analysis. Table 7 Strengths Opportunities ▪ Strong Brand ▪ Emerging Developing Markets ▪ Research & Development ▪ Acquisitions ▪ Global Operations ▪ Sell or Spinoff of Assets ▪ Strong Market Infrastructure ▪ Strong Performance in Core Business Weakness Threats ▪ Lack of Diversified Customer Portfolio ▪ Intense Competition ▪ Overdependence on Mature Markets ▪ Increase in Cost of Raw Materials ▪ Quality Control ▪ Credit Crisis ▪ Technology Infrastructure ▪ Government Regulation Changes 10/18/2009 Procter & Gamble Page 74 of 87
  • 75.
    3.0 References America.gov (2009).Retrieved October 5, 2009, from http://www.america.gov Bannister, L (2006) P&G creates branded content, Harvard Business Review, 33 (2), pp. 2-5. Bartlett, C., Ghoshal, S. (2005) Managing across Borders: the Transnational Solution, Journal of Marketing, 45(2), Boston: Harvard Business School Press. Buckley, N. (2005) ‘Reconditioned P&G is continuing to shine’, Financial Times, pp. 30- 31 Buckley, N., (2006) ‘Change of focus boosts P&G’, Financial Times, pp. 45-46 Company Spotlight: Procter & Gamble. (2007). Datamonitor. pp.20-26 Grant, J. (2006) ‘We can build a juggernaut – P&G and Gillette lead the way through a new retail landscape’, Financial Times. Household & Personal Products Industry Profile: Global. (2008). Datamonitor, April, p.1-28. Household & Personal Products Industry Profile: Global. (2008). Datamonitor, Jan, p.1- 27. IMF says U.S. recession will slow global growth. (2008) Associated Press. Retrieved October 2, 2009 from http://www.msnbc.msn.com/id/24032732// Jones, A. (2005) ‘Consumed by the consumer’, Financial Times, pp.23-25 Johnson & Johnson (2009). 2008 Annual Report. Retrieved September 28, 2009, from www.sec.gov Johnson, G., Scholes, K. (2006) Exploring Corporate Strategy, 8th ed, London: Pearson. Kahl, K. & Berquist, P. (2000). A Primer on the Internet Supply Chain. Supply Chain Management Review. Retrieved October 2, 2009 from http://www.scmr.com/article/CA629930.html Kanter, R.M. (2009). Inside Procter & Gamble’s New Values-Based Strategy. Harvard 10/18/2009 Procter & Gamble Page 75 of 87
  • 76.
    Business Publishing. RetrievedOctober 14, 2009, from http://blogs.harvardbusiness.org/kanter/2009/09/fall-like-a-lehman-rise-like- a.html Kellerhals, Jr., M.D. (2009) U.S. Economy Should Improve in Late 2009, Fed Chair Bernanke Says. American.gov. Retrieved October 1st, 2009, from http://www.america.gov/st/business- english/2009/May/20090505115000dmslahrellek0.4212152.html Kimberly-Clark Corporation (2009). 2008 Annual Report. Retrieved September 28, 2009, from www.sec.gov Kumar, S., & Bennett, K. (2003). Global Operations and Logistics Trends in the Household and Personal Care Products Market. An International Journal, 4, pp.10-20. Market Watch (2006), P&G: brewing battle, 3 (4), pp. 9-21. McGowan, E (2006) Corporate Profile :Procter and Gamble, Academy of Management Journal,12 (8), pp. 20-28. Miller, R. (2008, January 28). Global Recession Risk Grows as U.S. Damage Spreads. Bloomberg, Retrieved from http://www.bloomberg.com/apps/news? pid=20601087&sid=arlKrFbn3pfY&refer=home Monks, R. and Minow, N. (2005) Corporate Governance, Oxford: Blackwell. Packaging with a punch. (2009) Packaging & Converting Intelligence. Retrieved October 18, 2009, from http://www.pci- mag.com/editorial/023_spring08/023_packaging.pdf Procter & Gamble. (2002), Cisco success stories customer profile. Retrieved October 5, 2009 from http://www.cisco.com/warp/public/779/ibs/solutions/supply/pgcasestudy1.pdf Procter & Gamble (2009). 2009 Annual Report. Retrieved September 28, 2009, from www.sec.gov. Procter & Gamble at the 5th World Congress on Alternatives and Animal Use in the Life Sciences. (2005) Procter & Gamble Science (online). Retrieved September 30, 2009, from http://www.pg.com./science/Brochure_print.pdf Procter & Gamble Company, The. (2009). Datamonitor, May, p. 1-10. Procter & Gamble Company, The. (2008). Datamonitor, Sep, p.1-11. 10/18/2009 Procter & Gamble Page 76 of 87
  • 77.
    Procter & GambleEmploys Axway Solution to Ensure Supply Chain Efficiencies and Cost Management. (2009). Tumbleweed. Retrieved October 6, 2009, from: http:// www.tumbleweed.com/news/press_releases/2009/2009-06-09.html Procter & Gamble to Deploy I.D. Systems' Wireless Vehicle Management System. (2009). i2 Technologies. Retrieved October 2, 2009, from http://finance.yahoo.com/news/Procter-Gamble-to-Deploy-ID- pz-2245208884.html?x=0 Procter & Gamble Implements i2 Solutions to Drive Transportation and Distribution Efficiency Globally. (2009). Reuters. Retrieved October 7, 2009, from: http://www.reuters.com/article/pressRelease/idUS152716+21- Jan-2009+BW20090121 P&G Pet Care Announces Voluntary Participation in Menu Foods' Nationwide U.S. and Canadian Recall of Specific Canned and Small Foil Pouch 'Wet' Cat and Dog Foods. (2007). Procter & Gamble (online). Retrieved October 5, 2009, from http://www.pg.com/homepage_announcements.shtml? document=/consumer/consumer_homepage_iams_euk_recall.xml Porter, M. E. . (1985). Competitive Advantage. New York, NY: The Free Press. Q4: The Long Term Case for Procter & Gamble. (2009). Seeking Alpha. Retrieved October 8, 2009 from http://seekingalpha.com/article/154907-q4-results-the-long- term-case-for-procter-gamble Quinn, J., Mintzberg, H., James, R., Lampel, J. and Ghoshal, S. (eds) (2003) The Strategy Process, London: Prentice Hall. Roberts, D., Grant, J. (2006) ‘P&G looks to gain strength through unity’, Financial Times. Should Procter & Gamble Clean House? (2007) New York Times. Retrieved October 4, 2009, from http://dealbook.blogs.nytimes.com/2007/07/24/should-procter- gamble-clean-house/ United Nations (2005). World Population Prospects: The 2004 Revision, vol. I: Comprehensive Tables (United Nations publication, ST/ESA/SER.A/244); vol. II: Sex and Age Distribution of Populations (United Nations publication, ST/ESA/SER.A/245) Wheelen, T., Hunger, J. (2002) Strategic Management and Business Policy, 8th ed. Upper Saddle River, NJ: Addison Wesley Wolf, C. (2008). Procter & Gamble Profit Beats Estimate as Price Rise. Bloomberg Retrieved October 5, 2009 from http://www.bloomberg.com/apps/news? pid=20601087&refer=home&sid=ased_GT5nTVk 10/18/2009 Procter & Gamble Page 77 of 87
  • 78.
    4.0 APPENDICES APPENDIX 1 10/18/2009 Procter & Gamble Page 78 of 87
  • 79.
    Procter & GambleBalance Sheet (Year ended J une 30) 2008 2007 2006 Average (In thous ands) Cash and cash equivalents $3,313,000 $5,354,000 $6,693,000 $5,120,000 Short-term investments $228,000 $202,000 $1,133,000 $521,000 Accounts Recievable $8,773,000 $8,356,000 $5,725,000 $7,618,000 Inventories $8,416,000 $6,819,000 $6,291,000 $7,175,333 Pre-paid expense and other current assets $3,785,000 $3,300,000 $4,487,000 $3,857,333 Total Current Assets $24,515,000 $24,031,000 $24,329,000 $24,291,667 Long-term Investments Other Assets $4,837,000 $4,265,000 $3,569,000 $4,223,667 Property, plant, and equipment, net $20,640,000 $19,540,000 $18,700,000 $19,626,667 Trademarks & Goodwill $59,767,000 $56,552,000 $55,306,000 $57,208,333 Other intangible assets $34,233,000 $33,626,000 $33,721,000 $33,860,000 Deferred Long-Term Asset Charges Total Other Assets $119,477,000 $113,983,000 $111,296,000 $114,918,667 Total Assets $143,992,000 $138,014,000 $135,625,000 $139,210,333 Accounts payable and accrued expenses $7,977,000 $13,628,000 $14,497,000 $12,034,000 Short-Term Debt (Loans and notes payable, current maturities on long term debt) $13,084,000 $12,039,000 $198,000 $8,440,333 Other Current Liabilities $9,897,000 $5,050,000 $5,290,000 $6,745,667 Total Current Liabilities $30,958,000 $30,717,000 $19,985,000 $27,220,000 Long-term debt $23,581,000 $23,375,000 $35,976,000 $27,644,000 Other Liabilities $8,154,000 $5,147,000 $4,472,000 $5,924,333 Deferred Long Term Liability Charges $11,805,000 $12,015,000 $12,354,000 $12,058,000 Total Other Liabilities $43,540,000 $40,537,000 $52,802,000 $45,626,333 Total Liabilities $74,498,000 $71,254,000 $72,787,000 $72,846,333 Preferred Stock $1,366,000 $1,406,000 $1,451,000 $1,407,667 Common Stock $4,002,000 $3,990,000 $3,976,000 $3,989,333 Captial surplus $60,307,000 $59,030,000 $57,856,000 $59,064,333 Retained Earnings $48,986,000 $41,797,000 $35,666,000 $42,149,667 Accumulated other comprehensive income $2,421,000 ($691,000) ($1,806,000) ($25,333) Treasury stock ($47,588,000) ($38,772,000) ($34,235,000) ($40,198,333) Total Stockholder's Equity $69,494,000 $66,760,000 $62,908,000 $66,387,333 Total liabilities and Equity $143,992,000 $138,014,000 $135,695,000 $139,233,667 Common Shares Outstanding 3.03 B 3.13 B 3.17B APPENDIX 2 10/18/2009 Procter & Gamble Page 79 of 87
  • 80.
    Johnson & JohnsonBalance Sheet (Year ended December 31) 2008 2007 2006 Average (In thous ands) Cash and cash equivalents $10,768,000 $7,770,000 $4,083,000 $7,540,333 Short-term investments $2,041,000 $1,545,000 $1,000 $1,195,667 Accounts Recievable $13,149,000 $12,053,000 $10,806,000 $12,002,667 Inventories $5,052,000 $5,110,000 $4,889,000 $5,017,000 Pre-paid expense and other current assets $3,367,000 $3,467,000 $3,196,000 $3,343,333 Total Current Assets $34,377,000 $29,945,000 $22,975,000 $29,099,000 Long-term Investments $4,000 $2,000 $16,000 $7,333 Other Assets $2,630,000 $3,170,000 $2,623,000 $2,807,667 Property, plant, and equipment, net $14,365,000 $14,185,000 $13,044,000 $13,864,667 Trademarks & Goodwill $13,719,000 $14,123,000 $13,340,000 $13,727,333 Other intangible assets $13,976,000 $14,640,000 $15,348,000 $14,654,667 Deferred Long-Term Asset Charges $5,841,000 $4,889,000 $3,210,000 $4,646,667 Total Other Assets $50,535,000 $51,009,000 $47,581,000 $49,708,333 Total Assets $84,912,000 $80,954,000 $70,556,000 $78,807,333 Accounts payable and accrued expenses $17,120,000 $17,374,000 $14,582,000 $16,358,667 Short-Term Debt (Loans and notes payable, current maturities on long term debt) $3,732,000 $2,463,000 $4,579,000 $3,591,333 Other Current Liabilities Total Current Liabilities $20,852,000 $19,837,000 $19,161,000 $19,950,000 Long-term debt $8,120,000 $7,074,000 $2,014,000 $5,736,000 Other Liabilities $11,997,000 $9,231,000 $8,744,000 $9,990,667 Deferred Long Term Liability Charges $1,432,000 $1,493,000 $1,319,000 $1,414,667 Total Other Liabilities $21,549,000 $17,798,000 $12,077,000 $17,141,333 Total Liabilities $42,401,000 $37,635,000 $31,238,000 $37,091,333 Preferred Stock Common Stock 3,120,000 3,120,000 3,120,000 3120000 Captial surplus Retained Earnings $63,379,000 $55,280,000 $49,290,000 55983000 Accumulated other comprehensive income ($4,955,000) ($693,000) ($2,118,000) ($2,588,667) Treasury stock ($19,033,000) ($14,388,000) ($10,974,000) ($14,798,333) Total Stockholder's Equity $42,511,000 $43,319,000 $39,318,000 $41,716,00 0 Total liabilities and Equity $84,912,000 $80,954,000 $70,556,000 $78,807,333 Common Shares Outstanding 2.77 B 2.84 B 2.89 B APPENDIX 3 10/18/2009 Procter & Gamble Page 80 of 87
  • 81.
    Kimberly-Clark Corporation (Year endedDecember 31) 2008 2007 2006 Average (In thous ands) Cash and cash equivalents $505,000 $472,700 $625,300 $534,333 Short-term investments $271,000 $90,333 Accounts Recievable $2,623,000 $2,778,000 $2,555,900 $2,652,300 Inventories $2,493,000 $2,443,800 $2,004,500 $2,313,767 Pre-paid expense and other current assets $192,000 $131,100 $84,000 $135,700 Total Current Assets $5,813,000 $6,096,600 $5,269,700 $5,726,433 Long-term Investments $927,000 $390,000 $392,900 Other Assets $939,000 $785,000 $726,300 $816,767 Property, plant, and equipment, net $7,667,000 $8,094,000 $7,684,800 $7,815,267 Trademarks & Goodwill $2,743,000 $2,942,000 $2,860,500 $2,848,500 Other intangible assets $131,700 $132,800 $88,167 Deferred Long-Term Asset Charges Total Other Assets $12,276,000 $12,342,700 $11,797,300 $12,138,667 Total Assets $18 ,089,000 $18,439 ,300 $17,06 7,000 $17,86 5,100 Accounts payable and accrued expenses $3,669,000 $3,830,700 $3,689,400 $3,729,700 Short-Term Debt (Loans and notes payable, current maturities on long term debt) $1,083,000 $1,097,900 $1,326,400 $1,169,100 Other Current Liabilities $0 Total Current Liabilities $4,752,000 $4,928,600 $5,015,800 $4,898,800 Long-term debt $4,882,000 $4,393,900 $2,276,000 $3,850,633 Other Liabilities $2,969,000 $2,035,100 $2,070,700 $2,358,267 Deferred Long Term Liability Charges $193,000 $369,700 $391,100 $317,933 Minority Interest $404,000 $484,100 $1,216,000 $701,367 Total Other Liabilities $8,448,000 $7,282,800 $5,953,800 $7,228,200 Total Liabilities $13,200,000 $12,211,400 $10,969,600 $12,127,000 Preferred Stock $0 Common Stock $598,000 $598,300 $598,300 $598,200 Captial surplus (PIC) $486,000 $482,400 $427,600 $465,333 Retained Earnings $9,465,000 $8,747,800 $7,895,600 $8,702,800 Treasury stock ($4,285,000) ($3,813,600) ($1,391,900) ($3,163,500) Other Equity, Total ($2,386,000) ($791,200) ($1,432,200) ($1,536,467) Total Stockholder's Equity $3,878,000 $5,223,700 $6,097,400 $5,066,367 Redeemable Preferred Stock $1,011,000 $1,004,600 Total liabilities and Equity $18,089,000 $18,439,700 $17,067,000 $17,193,367 Common Shares Outstanding 413.60 M 420.90 M APPENDIX 4 10/18/2009 Procter & Gamble Page 81 of 87
  • 82.
    Procter & GambleIncome Statement (Year ended J une 30) 2008 2007 2006 Average (In th ous and s) Net Sales $83,503,000 $76,476,000 $68,222,000 $76,067,000 Cost Of Goods Sold $40,695,000 $36,686,000 $33,125,000 $36,835,333 Gross Margin $42,808,000 $39,790,000 $35,097,000 $39,231,667 Selling, General & Administrative $25,725,000 $24,340,000 $21,280,000 $23,781,667 Non Recurring Research & Development Other Operating Charges Total Operating Expense $25,725,000 $24,340,000 $21,280,000 $23,781,667 Income from Operations $17,083,000 $15,450,000 $13,817,000 $15,450,000 Earnings Before Interest and Taxes (EBIT) $17,545,000 $16,014,000 $13,530,000 $15,696,333 Interest Expense $1,467,000 $1,304,000 $1,120,000 $1,297,000 Other Income and Expense Income Before Taxes $16,078,000 $14,710,000 $12,410,000 $14,399,333 Income Tax Expense $4,003,000 $4,370,000 $3,730,000 $4,034,333 Net Income from Operations $12,075,000 $10,340,000 $8,680,000 $10,365,000 Discontinued Operations Net Income $12,075,000 $10,340,000 $8,680,000 $10,365,000 APPENDIX 5 10/18/2009 Procter & Gamble Page 82 of 87
  • 83.
    Johnson & JohnsonIncome Statement (Year ended December 31) 2008 2007 2006 Average (In th ous and s) Net Sales $63,747,000 $61,095,000 $53,324,000 $59,388,667 Cost Of Goods Sold $18,511,000 $17,751,000 $15,057,000 $17,106,333 Gross Margin $45,236,000 $43,344,000 $38,267,000 $42,282,333 Selling, General & Administrative $21,490,000 $20,451,000 $17,433,000 $19,791,333 Non Recurring $181,000 $1,552,000 $559,000 $764,000 Research & Development $7,577,000 $7,680,000 $7,125,000 $7,460,667 Other Operating Charges Total Operating Expense $29,248,000 $29,683,000 $25,117,000 $28,016,000 Income from Operations $15,988,000 $13,661,000 $13,150,000 $14,266,333 Earnings Before Interest and Taxes (EBIT) $17,364,000 $13,579,000 $14,650,000 $15,197,667 Interest Expense $435,000 $296,000 $63,000 $264,667 Other Income and Expense Income Before Taxes $16,929,000 $13,283,000 $14,587,000 $14,933,000 Income Tax Expense $3,980,000 $2,707,000 $3,534,000 $3,407,000 Net Income from Operations $12,949,000 $10,576,000 $11,053,000 $11,526,000 Discontinued Operations Net Income $12,949,000 $10,576,000 $11,053,000 $11,526,000 APPENDIX 6 10/18/2009 Procter & Gamble Page 83 of 87
  • 84.
    Kimberly-Clark Corporation IncomeStatement (Year en ded December 3 1) 2008 2007 2006 Average (In th ousand s) Net Sales $19,415,000 $18,266,000 $16,746,900 $18,142,633 Cost Of Goods Sold $13,557,000 $12,562,100 $11,664,800 $12,594,633 Gross Margin $5,858,000 $5,703,900 $5,082,100 $5,548,000 Selling, General & Administrative $3,291,000 $3,105,900 $2,948,300 $3,115,067 Non Recurring Research & Development Other Operating Charges $20,000 Total Operating Expense $3,311,000 $3,105,900 $2,948,300 $3,115,067 Income from Operations $2,547,000 $2,598,000 $2,133,800 $2,432,933 Earnings Before Interest and Taxes (EBIT) $2,593,000 $2,582,300 $2,065,200 $2,413,500 Interest Expense $304,000 $264,800 $220,300 $263,033 Other Income and Expense $46,000 ($15,700) ($68,600) Income Before Taxes $2,289,000 $2,317,500 $1,844,900 $2,150,467 Income Tax Expense $618,000 $536,500 $469,200 $541,233 Equity in Affiliates $166,000 $170,000 $218,600 Minority Interest ($139,000) ($128,100) ($94,800) Net Income from Operations $1,698,000 $1,822,900 $1,499,500 $1,609,233 Discontinued Operations Exraordinary Items -$8,000 Net Income $1,690,000 $1,822,900 $1,499,500 $1,609,233 APPENDIX 7 10/18/2009 Procter & Gamble Page 84 of 87
  • 85.
    Financial Statement Ratiosfor Proctor & Gamble 2008 2007 2006 Profitability Ratios Gross Profit Margin 0.51 0.52 0.51 Operating Profit Margin 0.69 0.68 0.69 Net Profit Margin 0.14 0.14 0.13 Return on Total Assets 0.08 0.07 0.06 Return on Stockholder's Equity 0.17 0.15 0.14 Earnings per share $3.64 $3.04 $2.64 Liquidity Ratios Current Ratio 0.79 0.78 1.22 Quick Ratio 0.52 0.56 0.90 Working Capital ($6,443,000) ($6,686,000) $4,344,000 Leverage Ratios Debt-to-Assets Ratio 0.52 0.52 0.54 Long-Term Debt-to-Capital Ratio 0.25 0.26 0.36 Debt-to-Equity Ratio 1.07 1.07 1.16 Long-Term Equity Ratio 0.34 0.35 0.57 Times-Interest-Earned Ratio 8.23 7.93 7.75 Activity Ratios Days in Inventory 75.48 67.84 69.32 Inventory Turnover 4.84 5.38 5.27 Average Collection Period 38.35 39.88 30.63 Other Important Financial Measures Dividend yield on common stock 2.51 1.85 1.88 Price/Earnings (P/E) Ratio 16.71 20.13 21.06 Dividend Payout Ratio $0.11 $0.12 $0.12 Internal Cash Flow $15,241,000 $13,470,000 $11,310,000 price per share $60.81 $61.19 $55.60 Closed Stock Market Price = As of June 30 APPENDIX 8 10/18/2009 Procter & Gamble Page 85 of 87
  • 86.
    Financial Statement Ratiosfor Johnson & Johnson 2008 2007 2006 Profitability Ratios Gross Profit Margin 0.71 0.71 0.72 Operating Profit Margin 0.54 0.51 0.53 Net Profit Margin 0.20 0.17 0.21 Return on Total Assets 0.15 0.13 0.16 Return on Stockholder's Equity 0.30 0.24 0.28 Earnings per share $4.55 $4.15 $3.76 Liquidity Ratios Current Ratio 1.65 1.51 1.20 Quick Ratio 1.41 1.25 0.94 Working Capital $13,525,000 $10,108,000 $3,814,000 Leverage Ratios Debt-to-Assets Ratio 0.50 0.46 0.44 Long-Term Debt-to-Capital Ratio 0.16 0.14 0.05 Debt-to-Equity Ratio 1.00 0.87 0.79 Long-Term Equity Ratio 0.19 0.16 0.05 Times-Interest-Earned Ratio 29.77 35.73 175.44 Activity Ratios Days in Inventory 99.62 105.07 118.52 Inventory Turnover 3.66 3.47 3.08 Average Collection Period 75.29 72.01 73.97 Other Important Financial Measures Dividend yield on common stock 3.00 2.43 2.20 Price/Earnings (P/E) Ratio 14.14 14.85 15.94 Dividend Payout Ratio $0.10 $0.10 $0.10 Internal Cash Flow $15,781,000 $13,353,000 $13,230,000 price per share $64.34 $61.62 $59.92 Closed Stock Market Price = As of June 30 APPENDIX 9 10/18/2009 Procter & Gamble Page 86 of 87
  • 87.
    Financial Statement Ratiosfor Kimberly-Clark 2008 2007 2006 Profitability Ratios Gross Profit Margin 0.30 0.31 0.30 Operating Profit Margin 0.83 0.83 0.82 Net Profit Margin 0.09 0.10 0.09 Return on Total Assets 0.09 0.10 0.09 Return on Stockholder's Equity 0.44 0.35 0.25 Earnings per share $4.14 $4.25 $3.90 Liquidity Ratios Current Ratio 1.22 1.24 1.05 Quick Ratio 0.70 0.74 0.65 Working Capital $1,061,000 $1,168,000 $253,900 Leverage Ratios Debt-to-Assets Ratio 0.73 0.66 0.64 Long-Term Debt-to-Capital Ratio 0.56 0.46 0.27 Debt-to-Equity Ratio 3.40 2.34 1.80 Long-Term Equity Ratio 1.26 0.84 0.37 Times-Interest-Earned Ratio 5.59 6.88 6.81 Activity Ratios Days in Inventory 67.12 71.01 62.72 Inventory Turnover 5.44 5.14 5.82 Average Collection Period 49.31 55.51 55.71 Other Important Financial Measures Dividend yield on common stock 4.40 3.06 3.02 Price/Earnings (P/E) Ratio 14.44 15.74 15.82 Dividend Payout Ratio $0.14 $0.12 $0.13 Internal Cash Flow $2,473,000 $2,629,400 $2,432,300 price per share $59.78 $66.89 $61.70 Closed Stock Market Price = As of June 30 10/18/2009 Procter & Gamble Page 87 of 87