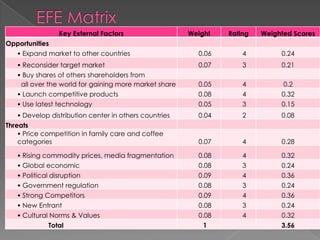
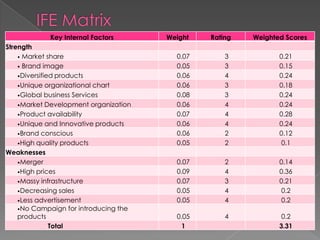
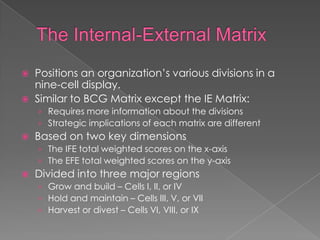
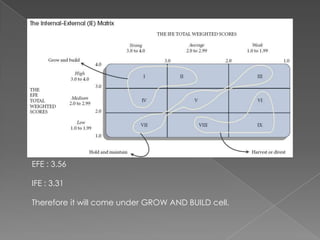
By
Ranjit
Procter & Gamble (P&G) is a Fortune 500 American
multinational corporation headquartered in downtown
Cincinnati, Ohio and manufactures a wide range of
consumer goods.

   Founded               1837
   Headquarters          Cincinnati, Ohio, U.S.
   Area served           Worldwide
   Key people            Bob McDonald (Chairman,
    President and CEO)
   Revenue               US$ 82.56 billion (FY 2011)
   Operating income      US$ 15.818 billion (FY 2011)
   Net income            US$ 11.797 billion (FY 2011)
   Employees             127,000 (2010)
   William Procter, a candlemaker, and James Gamble, a
    soapmaker, immigrated from England and Ireland
    respectively.
   Sold in 160 countries
   Manufacturing in 130 conutries
   About 300 products
   spends nearly $2 billion annually on R&D
   In January 2005 P&G announced an acquisition of Gillette,
    forming the largest consumer goods company and
    placing Unilever into second place.
   Competitors : JNJ, KMB, ITC, HUL
   Global Business Units
    ›   Beauty segment
    ›   Grooming segment
    ›   Health Care segment
    ›   Snacks & Pet Care segment
    ›   Fabric Care & Home Care segment
    ›   Baby Care & Family Home Care segment
 Value Chain Analysis is a process that
  starts from the acquisition of raw
  materials to actual physical products
  sold by the company
 Increase Competitive Advantage
 Determines strategic benefits
   Inbound Logistics / SCM
    › Moments of truth
       1. consumer comes to buy
       2. satisfaction after consuming
   Operations
    › MDO – Market Dev Org & GBS – Global Bus Serv
   Outbound Logistics / Distribution
   Cross decking, efficient planning
   Marketing & Sales
    › 23 brands more than $ 1 billion
    › Signals and Responses
   Service
    › More than $100 million in ADs
    › 5000 key retailers & 30000 key suppliers
   Firm Infrastructure
    › R&D
    › 25000 patents, more 7500 Ph.Ds in 71
      countries
    › Approx 4% of sales
   Human Resource Management
    › I.D.Systems - Vehicle Mgmt Systems
 Technology
 Procurement
   Life Cycle Assessment (LCA) is a tool used to
    evaluate the potential environmental impact
    of a product, process or activity throughout its
    entire life cycle by quantifying the use of
    resources ("inputs" such as energy, raw
    materials, water) and environmental emissions
    ("outputs" to air, water and soil) associated with
    the system that is being evaluated.
   Two types of systems of particular interest to
    P&G are
    › the life cycle of a product (such as a detergent) or
    › an activity (such as washing clothes).
 Procter & Gamble complies with ISO 14040
 Procter & Gamble has used Life Cycle Assessment to
  guide decision making since the late 1980s. In the last
  decade, Procter & Gamble has adopted ISO 14040
  standards for LCA.
 Managers at P&G routinely use LCA approaches to:
    › Analyse products from a system-wide, functional unit point of
        view in a consistent, transparent and reproducible manner in
        order to: guide choices of raw materials, guide product
        innovation and design packaging with lower impact,
    ›   Analyse the energy and resource use in the detergent system,
    ›   Analyse various emissions, wastes, and resources using
        environmental themes,
    ›   Identify what parameters are most likely to be significant to
        monitor and control,
    ›   Identify opportunities for improving overall system performance,
        and
    ›   Benchmark the product over time and report progress.
 By
Sachin
   Low because of:
 Enormous amount of product (14 Categories)
   Extensive Distribution Channel
   Huge capital Investment
   Economies of Scale
   Brand Power
   Low switching cost


Note: Niche marketing firm can be a threat.
   Moderate because of:
 High brand value
 Less threat of backward integration
 Less threat of forward integration
 Less switching cost
   Limited because of:
 Codependent relationship
 P & G as a Key customer
 Market share & growth rate ( more than 20
  % overall growth for 2010)
   High because:
 Low involvement products
 Competitor’s offerings with almost same
  price & quality
 Low switching cost
  Eg. – Surf Excel & Ariel
   High because:
 Presence of strong competitors like HUL, ITC
  & Colgate – Palmolive, J & J in different
  markets
 Low switching cost
  By
Mitali
SWOT Analysis
             Strength                                  Threats
» Market share                     » Price competition in family care and
» Brand image                        coffee categories
» Diversified products             » Rising commodity prices, media
» Unique organizational chart        fragmentation
» Global business Services         » Global economic
» Market Development               » Political disruption
organization                       » Government regulation
» Product availability             » Strong Competitors
» Unique and Innovative            » New Entrant
products                           » Cultural Norms & Values
» Brand conscious
» High quality products
           Weaknesses                              Opportunities
»   Merger                         »   Expand market to other countries
»   High prices                    »   Reconsider target market
»   Massy infrastructure           »   Buy shares to increase assets
»   Decreasing sales               »   Launch competitive products
»   Less advertisement             »   Use latest technology
»   No Campaign for introducing    »   Develop distribution center in others
    the products                       countries
Strengths                  Weakness
                            1. Market share            1. No Campaign for
                            2. Market Development         introducing the
                               organization               products
                            3. Brand image             2. High prices
                            4. Unique and Innovative   3. Decreasing sales
                               products
     Opportunities        1. To enhance the            1. Enhance campaign
1. Use latest technology     products                     through technologies
2. Expand market to other 2. Expanding into new        2. Seek more business by
   countries                 market as being the          lower prizes
3. Develop distribution      market development        3. By increasing
   center in others          organization                 distribution centre they
   countries              3. Stepping into market         can increase there sells
                             development by using
                             brand name as a tool
         Threats            1. Using brand name to     1. Lower prices to
1. Price competition in        overcome pricing           overcome political
   family care and coffee      competition                instability
   categories               2. Use uniqueness as a
2. Global economic             tool to protect the
3. Political disruption        economic environment
ITC                Dabur               P&G
                                    Weighted          Weighted
CSF's                Weight Rating score     Rating   score      Rating   Weighted score

Market share          0.15     3      0.45      2          0.3       4          0.6

Consumer loyalty       0.1     3       0.3      4          0.4       4          0.4

Sales Distribution    0.08     3      0.24      4         0.32       3          0.24

Financial Position    0.09     4      0.36      3         0.27       3          0.27

Advertising           0.08     4      0.32      3         0.24       3          0.24

Product Quality       0.15     3      0.45      2          0.3       4          0.6

Management            0.06     4      0.24      3         0.18       3          0.18
Price
Competitiveness       0.15     3      0.45      2          0.3       3          0.45

Global Expansion      0.06     3      0.18      3         0.18       4          0.24

Org. Structure        0.08     4      0.32      2         0.16       4          0.32
                        1             3.31                2.65                  3.54
Total
 By
Neeta
Key External Factors                   Weight   Rating   Weighted Scores
Opportunities
  • Expand market to other countries                     0.06       4         0.24
   • Reconsider target market                            0.07       3         0.21
   • Buy shares of others shareholders from
    all over the world for gaining more market share     0.05       4          0.2
   • Launch competitive products                         0.08       4         0.32
   • Use latest technology                               0.05       3         0.15
   • Develop distribution center in others countries     0.04       2         0.08
Threats
    • Price competition in family care and coffee
    categories                                           0.07       4         0.28

   • Rising commodity prices, media fragmentation        0.08       4         0.32
   • Global economic                                     0.08       3         0.24
   • Political disruption                                0.09       4         0.36
   • Government regulation                               0.08       3         0.24
   • Strong Competitors                                  0.09       4         0.36
   • New Entrant                                         0.08       3         0.24
   • Cultural Norms & Values                             0.08       4         0.32
             Total                                        1                   3.56
Key Internal Factors       Weight   Rating   Weighted Scores
Strength
    • Market share                       0.07       3           0.21
    • Brand image                        0.05       3           0.15
    •Diversified products                0.06       4           0.24
    •Unique organizational chart         0.06       3           0.18
    •Global business Services            0.08       3           0.24
    •Market Development organization     0.06       4           0.24
    •Product availability                0.07       4           0.28
    •Unique and Innovative products      0.06       4           0.24
    •Brand conscious                     0.06       2           0.12
    •High quality products               0.05       2            0.1
Weaknesses
    •Merger                              0.07       2           0.14
    •High prices                         0.09       4           0.36
    •Massy infrastructure                0.07       3           0.21
    •Decreasing sales                    0.05       4            0.2
    •Less advertisement                  0.05       4            0.2
    •No Campaign for introducing the
    products                             0.05       4            0.2
               Total                      1                     3.31
 By
Alekhya
FS    Rank     CA      Rank        ES       Rank        IS      Rank

ROI         1      Market    -2     Tech.         -4     Growth       5
                   Share            Changes              Potential
Leverage    4      Product   -1     Rate of       -3     Profit       4
                   Quality          Inflation            Potential
Liquidity   5      PLC       -3     Demand        -5     Financial    3
                                    Variability          Stability
WC          3      Custom    -4     Barriers to   -2     Technologi   1
                   er               Entry                cal Know-
                   Loyalty                               how
Cash        2      Control   -5     Competiti     -1     Ease of      2
Flow               over             ve                   entry into
                   suppliers        Pressure             market
                   and
                   distribut
                   ors
Average     3                -3                   -3                  3
 ROI = (11797-71166)/71166= -0.83
 Liquidity = CA/CL = 21970/27293 = 0.804
 Leverage = D/E = (9981+22033)/68001 = 0.47
 Cash Flows


Source: P&G Annual Report
 CA+IS = -3+3 =0
 FS+ES = 3-3 =0
   Positions an organization’s various divisions in a
    nine-cell display.
   Similar to BCG Matrix except the IE Matrix:
    › Requires more information about the divisions
    › Strategic implications of each matrix are different
   Based on two key dimensions
    › The IFE total weighted scores on the x-axis
    › The EFE total weighted scores on the y-axis
   Divided into three major regions
    › Grow and build – Cells I, II, or IV
    › Hold and maintain – Cells III, V, or VII
    › Harvest or divest – Cells VI, VIII, or IX
EFE : 3.56

IFE : 3.31

Therefore it will come under GROW AND BUILD cell.
P & G company analysis

P & G company analysis

  • 2.
  • 3.
    Procter & Gamble(P&G) is a Fortune 500 American multinational corporation headquartered in downtown Cincinnati, Ohio and manufactures a wide range of consumer goods.  Founded 1837  Headquarters Cincinnati, Ohio, U.S.  Area served Worldwide  Key people Bob McDonald (Chairman, President and CEO)  Revenue US$ 82.56 billion (FY 2011)  Operating income US$ 15.818 billion (FY 2011)  Net income US$ 11.797 billion (FY 2011)  Employees 127,000 (2010)
  • 4.
    William Procter, a candlemaker, and James Gamble, a soapmaker, immigrated from England and Ireland respectively.  Sold in 160 countries  Manufacturing in 130 conutries  About 300 products  spends nearly $2 billion annually on R&D  In January 2005 P&G announced an acquisition of Gillette, forming the largest consumer goods company and placing Unilever into second place.  Competitors : JNJ, KMB, ITC, HUL  Global Business Units › Beauty segment › Grooming segment › Health Care segment › Snacks & Pet Care segment › Fabric Care & Home Care segment › Baby Care & Family Home Care segment
  • 7.
     Value ChainAnalysis is a process that starts from the acquisition of raw materials to actual physical products sold by the company  Increase Competitive Advantage  Determines strategic benefits
  • 8.
    Inbound Logistics / SCM › Moments of truth  1. consumer comes to buy  2. satisfaction after consuming  Operations › MDO – Market Dev Org & GBS – Global Bus Serv  Outbound Logistics / Distribution  Cross decking, efficient planning  Marketing & Sales › 23 brands more than $ 1 billion › Signals and Responses  Service › More than $100 million in ADs › 5000 key retailers & 30000 key suppliers
  • 9.
    Firm Infrastructure › R&D › 25000 patents, more 7500 Ph.Ds in 71 countries › Approx 4% of sales  Human Resource Management › I.D.Systems - Vehicle Mgmt Systems  Technology  Procurement
  • 11.
    Life Cycle Assessment (LCA) is a tool used to evaluate the potential environmental impact of a product, process or activity throughout its entire life cycle by quantifying the use of resources ("inputs" such as energy, raw materials, water) and environmental emissions ("outputs" to air, water and soil) associated with the system that is being evaluated.  Two types of systems of particular interest to P&G are › the life cycle of a product (such as a detergent) or › an activity (such as washing clothes).
  • 12.
     Procter &Gamble complies with ISO 14040  Procter & Gamble has used Life Cycle Assessment to guide decision making since the late 1980s. In the last decade, Procter & Gamble has adopted ISO 14040 standards for LCA.  Managers at P&G routinely use LCA approaches to: › Analyse products from a system-wide, functional unit point of view in a consistent, transparent and reproducible manner in order to: guide choices of raw materials, guide product innovation and design packaging with lower impact, › Analyse the energy and resource use in the detergent system, › Analyse various emissions, wastes, and resources using environmental themes, › Identify what parameters are most likely to be significant to monitor and control, › Identify opportunities for improving overall system performance, and › Benchmark the product over time and report progress.
  • 13.
  • 15.
    Low because of:  Enormous amount of product (14 Categories)  Extensive Distribution Channel  Huge capital Investment  Economies of Scale  Brand Power  Low switching cost Note: Niche marketing firm can be a threat.
  • 16.
    Moderate because of:  High brand value  Less threat of backward integration  Less threat of forward integration  Less switching cost
  • 17.
    Limited because of:  Codependent relationship  P & G as a Key customer  Market share & growth rate ( more than 20 % overall growth for 2010)
  • 18.
    High because:  Low involvement products  Competitor’s offerings with almost same price & quality  Low switching cost Eg. – Surf Excel & Ariel
  • 19.
    High because:  Presence of strong competitors like HUL, ITC & Colgate – Palmolive, J & J in different markets  Low switching cost
  • 20.
  • 21.
    SWOT Analysis Strength Threats » Market share » Price competition in family care and » Brand image coffee categories » Diversified products » Rising commodity prices, media » Unique organizational chart fragmentation » Global business Services » Global economic » Market Development » Political disruption organization » Government regulation » Product availability » Strong Competitors » Unique and Innovative » New Entrant products » Cultural Norms & Values » Brand conscious » High quality products Weaknesses Opportunities » Merger » Expand market to other countries » High prices » Reconsider target market » Massy infrastructure » Buy shares to increase assets » Decreasing sales » Launch competitive products » Less advertisement » Use latest technology » No Campaign for introducing » Develop distribution center in others the products countries
  • 22.
    Strengths Weakness 1. Market share 1. No Campaign for 2. Market Development introducing the organization products 3. Brand image 2. High prices 4. Unique and Innovative 3. Decreasing sales products Opportunities 1. To enhance the 1. Enhance campaign 1. Use latest technology products through technologies 2. Expand market to other 2. Expanding into new 2. Seek more business by countries market as being the lower prizes 3. Develop distribution market development 3. By increasing center in others organization distribution centre they countries 3. Stepping into market can increase there sells development by using brand name as a tool Threats 1. Using brand name to 1. Lower prices to 1. Price competition in overcome pricing overcome political family care and coffee competition instability categories 2. Use uniqueness as a 2. Global economic tool to protect the 3. Political disruption economic environment
  • 23.
    ITC Dabur P&G Weighted Weighted CSF's Weight Rating score Rating score Rating Weighted score Market share 0.15 3 0.45 2 0.3 4 0.6 Consumer loyalty 0.1 3 0.3 4 0.4 4 0.4 Sales Distribution 0.08 3 0.24 4 0.32 3 0.24 Financial Position 0.09 4 0.36 3 0.27 3 0.27 Advertising 0.08 4 0.32 3 0.24 3 0.24 Product Quality 0.15 3 0.45 2 0.3 4 0.6 Management 0.06 4 0.24 3 0.18 3 0.18 Price Competitiveness 0.15 3 0.45 2 0.3 3 0.45 Global Expansion 0.06 3 0.18 3 0.18 4 0.24 Org. Structure 0.08 4 0.32 2 0.16 4 0.32 1 3.31 2.65 3.54 Total
  • 24.
  • 25.
    Key External Factors Weight Rating Weighted Scores Opportunities • Expand market to other countries 0.06 4 0.24 • Reconsider target market 0.07 3 0.21 • Buy shares of others shareholders from all over the world for gaining more market share 0.05 4 0.2 • Launch competitive products 0.08 4 0.32 • Use latest technology 0.05 3 0.15 • Develop distribution center in others countries 0.04 2 0.08 Threats • Price competition in family care and coffee categories 0.07 4 0.28 • Rising commodity prices, media fragmentation 0.08 4 0.32 • Global economic 0.08 3 0.24 • Political disruption 0.09 4 0.36 • Government regulation 0.08 3 0.24 • Strong Competitors 0.09 4 0.36 • New Entrant 0.08 3 0.24 • Cultural Norms & Values 0.08 4 0.32 Total 1 3.56
  • 26.
    Key Internal Factors Weight Rating Weighted Scores Strength • Market share 0.07 3 0.21 • Brand image 0.05 3 0.15 •Diversified products 0.06 4 0.24 •Unique organizational chart 0.06 3 0.18 •Global business Services 0.08 3 0.24 •Market Development organization 0.06 4 0.24 •Product availability 0.07 4 0.28 •Unique and Innovative products 0.06 4 0.24 •Brand conscious 0.06 2 0.12 •High quality products 0.05 2 0.1 Weaknesses •Merger 0.07 2 0.14 •High prices 0.09 4 0.36 •Massy infrastructure 0.07 3 0.21 •Decreasing sales 0.05 4 0.2 •Less advertisement 0.05 4 0.2 •No Campaign for introducing the products 0.05 4 0.2 Total 1 3.31
  • 27.
  • 28.
    FS Rank CA Rank ES Rank IS Rank ROI 1 Market -2 Tech. -4 Growth 5 Share Changes Potential Leverage 4 Product -1 Rate of -3 Profit 4 Quality Inflation Potential Liquidity 5 PLC -3 Demand -5 Financial 3 Variability Stability WC 3 Custom -4 Barriers to -2 Technologi 1 er Entry cal Know- Loyalty how Cash 2 Control -5 Competiti -1 Ease of 2 Flow over ve entry into suppliers Pressure market and distribut ors Average 3 -3 -3 3
  • 29.
     ROI =(11797-71166)/71166= -0.83  Liquidity = CA/CL = 21970/27293 = 0.804  Leverage = D/E = (9981+22033)/68001 = 0.47  Cash Flows Source: P&G Annual Report
  • 30.
     CA+IS =-3+3 =0  FS+ES = 3-3 =0
  • 31.
    Positions an organization’s various divisions in a nine-cell display.  Similar to BCG Matrix except the IE Matrix: › Requires more information about the divisions › Strategic implications of each matrix are different  Based on two key dimensions › The IFE total weighted scores on the x-axis › The EFE total weighted scores on the y-axis  Divided into three major regions › Grow and build – Cells I, II, or IV › Hold and maintain – Cells III, V, or VII › Harvest or divest – Cells VI, VIII, or IX
  • 32.
    EFE : 3.56 IFE: 3.31 Therefore it will come under GROW AND BUILD cell.