This document is a seminar report on energy harvesting through piezoelectricity. It provides an introduction to energy harvesting, which involves capturing ambient energy sources like vibration, converting it to electrical energy, and storing it. Piezoelectricity is introduced as a method for energy harvesting, where applying mechanical stress to certain materials generates an electric charge. The report discusses piezoelectric materials, generators, and human-powered piezoelectric generation. It also covers topics like poling, piezoelectric modes, and electrical power management related to piezoelectric energy harvesting.
![SEMINAR REPORT
ON
ENERGY HARVESTING BY
PIEZOELECTRICITY
Submitted For Partial Fulfillment of Award of
BACHELOR OF TECHNOLOGY
In
Electrical Engineering
Submitted By:-
MOGISH ANSARI
EE-52
1612220035
SHRI RAMSWAROOP MEMORIAL GROUP OF
PROFESSIONAL COLLEGE, LUCKNOW
Affiliated to
DR. A.P.J. ABDUL KALAM TECHNICAL UNIVERSITY,
LUCKNOW
[2018-19]](https://image.slidesharecdn.com/final9-200412064156/75/Final-9-09-18-piezo-1-1-2048.jpg)


![SEMINAR REPORT ENERGY HARVESTINGBY PIEZOELECTRICITY
EE, SRMGPC 2
vibration-powered energy harvesting technology, including the Control and Power
Group and Optical and Semiconductor Devices Group atImperial College London, IMEC and the
partnering Holst Centre [1], AdaptivEnergy, LLC, ARVENI, MIT Boston, Georgia Tech, UC
Berkeley, Southampton University, University of Bristol (UK) [2], PMG Perpetuum, Vestfold
University College, National University of Singapore [3], NiPS Laboratory at the University of
Perugia[4], Columbia University [5] and Universidad Autónoma de Barcelona.
Typical power densities available from energy harvesting devices are highly dependent upon the
specific application (affecting the generator's size) and the design itself of the harvesting
generator. In general, for motion powered devices, typical values are a few µW/cm³ for human
body powered applications and hundreds of µW/cm³ for generators powered from machinery.[6]
In practice, for energy scavenging devices for wearable electronics, most devices generate just a
few milliwatts of power.[7][contradiction]
1.3 STORAGE OF POWER
In general, energy can be stored in a capacitor, super capacitor, or battery. Capacitors are used
when the application needs to provide huge energy spikes. Batteries leak less energy and are
therefore used when the device needs to provide a steady flow of energy.
1.4 USE OF THE POWER
In small applications (wearable electronics), the power follows the following circuit: after
being transformed (by e.g. AC/DC-to-DC/DC-inverter) and stored in an energy buffer (e.g., a
battery, condenser, capacitor, etc.), the power travels through a microprocessor (fitted with
optional sensors) and is transmitted (usually wirelessly).
The history of energy harvesting dates back to the windmill and the waterwheel. People have
searched for ways to store the energy from heat and vibrations for many decades. One driving
force behind the search for new energy harvesting devices is the desire to power sensor networks
and mobile devices without batteries. Energy harvesting is also motivated by a desire to address
the issue of climate change and global warming.
There are many small-scale energy sources that generally cannot be scaled up to industrial size:
Piezoelectric crystals or fibers generate a small voltage whenever they are mechanically
deformed. Vibration from engines can stimulate piezoelectric materials, as can the heel of a shoe.](https://image.slidesharecdn.com/final9-200412064156/75/Final-9-09-18-piezo-1-6-2048.jpg)
![SEMINAR REPORT ENERGY HARVESTINGBY PIEZOELECTRICITY
EE, SRMGPC 3
Some wristwatches are already powered by kinetic energy (called kinetic watches), in this case
movement of the arm. The arm movement causes the magnet in the electromagnetic generator to
move. The motion provides a rate of change of flux, which results in some induced emf on the
coils. The concept is simply related to Faraday's Law.
Thermoelectric generators (TEGs) consist of the junction of two dissimilar materials and the
presence of a thermal gradient. Large voltage outputs are possible by connecting many junctions
electrically in series and thermally in parallel. Typical performance is 100-200 uV/degreeC per
junction. These can be utilized to capture mW of energy from industrial equipment, structures,
and even the human body. They are typically coupled with heat sinks to improve temperature
gradient.
Micro wind turbine are used to harvest wind energy readily available in the environment in the
form of kinetic energy to power the low power electronic devices such as wireless sensor nodes.
When air flows across the blades of the turbine, a net pressure difference is developed between
the wind speeds above and below the blades. This will result in a lift force generated which in
turn rotate the blades. This is known as the aerodynamic effect.
Special antennae can collect energy from stray radio waves or theoretically even light (EM
radiation).[citation needed]
[edit]Ambient-radiation sources
A possible source of energy comes from ubiquitous radio transmitters. Historically, either a large
collection area or close proximity to the radiating wireless energy source is needed to get useful
power levels from this source. The nantenna is one proposed development which would
overcome this limitation by making use of the abundant natural radiation (such as solar
radiation).
One idea is to deliberately broadcast RF energy to power remote devices: This is now
commonplace in passive Radio Frequency Identification (RFID) systems, but the Safety and
US Federal Communications Commission (and equivalent bodies worldwide) limit the maximum
power that can be transmitted this way.
[edit]Biomechanical harvesting
Biomechanical energy harvesters are also being created. One current model is the biomechanical
energy harvester of Max Donelan which straps around the knee.[8] Devices as this allow the
generation of 2.5 watts of power per knee. This is enough to power some 5 cell phones.](https://image.slidesharecdn.com/final9-200412064156/75/Final-9-09-18-piezo-1-7-2048.jpg)

![SEMINAR REPORT ENERGY HARVESTINGBY PIEZOELECTRICITY
EE, SRMGPC 5
2.PIEZOELECTRICITY
Piezoelectricity occurs when an electric surface charge develops on a crystalline material
by mechanical stress. It was discovered by Jacques and Pierre Curie in 1880, and the inverse
phenomenon, named the converse piezoelectric effect, was discovered one year later [19]. These
charges, named by polarization (P), are proportional to the applied stress (σ) and are expressed
by equation 2.1 or equation 2.2 for the converse piezoelectric effect. The material constant for
piezoelectricity is called the piezoelectric strain constant (d) and units are defined as pC/N or
pm/V.
P = dσ
ε = dE
where ε is strain and E is electric field. If applying Hook’s law to equation 2.1
P = dcε = eε
σ = cε = eE
where c is the elastic modulus (Pa) and the piezoelectric stress constant (e) is dc with pC/m2
of
unit. The relationship between the mechanical variables and the electrical variables is shown in
Figure 2.1.
Figure 2.1 The piezoelectric effect and their variables](https://image.slidesharecdn.com/final9-200412064156/75/Final-9-09-18-piezo-1-9-2048.jpg)
![SEMINAR REPORT ENERGY HARVESTINGBY PIEZOELECTRICITY
EE, SRMGPC 6
An additional constant related to piezoelectricity is the electromechanical coupling coefficient
(k), which quantifies the fraction of the electrical energy converted from mechanical energy or
vice versa. It is defined by:
k 2 = mechanical energy converted from electrical
energy input electrical energy
k 2 = electrical energy converted from mechanical
energy input mechanical energy
By introducing Barium Titanate Oxide (BTO), piezoelectric ceramics were developed,
and their commercialized applications have expanded to include high voltage sources, wave
filters, delay line transducers, underwater sound and ultrasonic power, acoustic speakers, ink-jet
printer heads, and various types of sensors
Piezoelectric materials have several forms, including polycrystalline, single crystalline
ceramics, polymers, thin films, and composite films between polycrystalline and polymer. These
materials should be chosen considering the desired frequency and fabrication process. The single
crystalline ceramics include α-SiO2 (Quartz), LiTaO3, LiNbO, etc. and have high piezoelectric
properties, but their synthesis is limited by size and the cost of the substrate. The piezoelectric
polymer and composite polymers include the PVDF families, PZT-PVDF (d33=25 pC/N) [22],
PZT-epoxy (d33=80 pC/N) [23], etc. While they show high piezoelectric properties, the synthesis
of the materials is limited by size and cost. Now, most material studies for piezoelectric
applications are focused on polycrystalline ceramics such as ZnO, AlN, PZT, doped PZT, and
BaTiO3.
The piezoelectric effect originates from the symmetry of the crystal structure. Only non-
symmetric structures can make displacement of gravity in the negative or positive charge under
stress. The 32 crystallographic point groups have 11 centrosymmetric and 21 non-](https://image.slidesharecdn.com/final9-200412064156/75/Final-9-09-18-piezo-1-10-2048.jpg)


![SEMINAR REPORT ENERGY HARVESTINGBY PIEZOELECTRICITY
EE, SRMGPC 11
Table 3.1 Coupling coefficient values of typical piezoelectric materials
Materials Coupling coefficient (k)
Quartz 0.1
ZnO 0.33
BTO 0.4
PZT 0.5 ~ 0.7
The piezoelectric constant in thin film scale, however, has different values when
compared to bulk materials, since the film is clamped on the substrate. The effective e31 and d33
for the thin film can be estimated by equations 2.9 and 2.10 [2].
e =
d 31
= e −
cE
e
13
s E
+
s E cE
31 31 33
11 12 33
d
33
=
e3
3
= d33 −
2s E
d
31
13
c E
sE
+ sE
3
3 11 12
PZT films have been chosen as a transducer layer for energy harvesting devices due to
their excellent electromechanical properties with high piezoelectric constants and
electromechanical coupling coefficients. They have been compared with other materials such as
ZnO, AlN, and poly(vinylidene fluoride) (PVDF), as shown in Table 2.3 [24-29]. The
piezoelectric constants in Table 2.3 are typical values of films less than 1 µm. Under a given
force on a cantilever, the stress on the surface of the structure is different depending on the
Young’s modulus of the materials. For example, polymer PVDF has a low Young’s modus and
makes a larger displacement on structures as compared to others. In this study, a thick Si
membrane supports the piezoelectric film so that the stress is not changed much depending on](https://image.slidesharecdn.com/final9-200412064156/75/Final-9-09-18-piezo-1-15-2048.jpg)

![SEMINAR REPORT ENERGY HARVESTINGBY PIEZOELECTRICITY
EE, SRMGPC 13
temperature of the piezoelectric PZT material, and it ranges from 510 K to 800 K. The cubic
perovskite structure is distorted below the Curie temperature into a rhombohedral phase for Zr-
rich compositions or a tetragonal phase for Ti-rich compositions. The Curie temperature (Tc) is a
transition temperature of ferroelectricity and is defined as ε = C/(T-Tθ), where ε is the
permittivity, C is the Curie constant, and Tθ is the Curie-Wiess temperature. As the composition
of Zr or Ti, the PZT has a different phase between the rhombohedral and tetragonal ones. The
boundary of those two phases is called the morphotropic phase boundary (MPB) around the
Zr/Ti composition of 0.52/0.48. The tetragonal structure has six <100> polarization directions
and the rhombohedral structure has eight <111> polarization directions. The maximum
piezoelectric and dielectric constants are commonly observed at MPB due to high probability of
polarization, and they are more sensitive to the composition than to the temperature because the
MPB is very vertical.
Figure 3.3 Phase diagram of PZT [30]
3.5 Poling & depoling
When the material becomes ferroelectric with losing its symmetry, small-sized cations
(Ti4+
or Zr4+
) move to the stable sites, which are determined by the minimum free energy
through tdistortion of the structure. These movements enable charge separation and spontaneous
polarhe ization.](https://image.slidesharecdn.com/final9-200412064156/75/Final-9-09-18-piezo-1-17-2048.jpg)

![SEMINAR REPORT ENERGY HARVESTINGBY PIEZOELECTRICITY
EE, SRMGPC 15
the reduction of the elastic energies so that the piezoelectric properties are dominated by them
[31, 32]. This is called the extrinsic contribution. The intrinsic contribution is the lattice
contribution from the displacement of each ion.
Cubic
Phase transformation
Tetragonal Rhombohedral
Figure3.5 The shape change by the polarization as the crystallographic structures
Contrary to the poling of the materials, the dipoles rearrange to an equilibrium state as
time goes by without the electric fields or mechanical stress. This is called “depoling,” and the
piezoelectricity becomes degraded. The depoling of ferroelectric thin films is a factor to
determine their lifetime and functional degradation of piezoelectric applications. For example,
Kholkin et al. poled sol-gel deposited PZT film by UV. The piezoelectric constant and aging
(depoling) improve with poling time, temperature, and electric field [33]. They have
saturatedvalues when poled over 100 o
C and 600 seconds. The electric field should be high
enough to increase the active domains, but not breakdown the voltage because of the thickness of
the films.](https://image.slidesharecdn.com/final9-200412064156/75/Final-9-09-18-piezo-1-19-2048.jpg)
![SEMINAR REPORT ENERGY HARVESTINGBY PIEZOELECTRICITY
EE, SRMGPC 17
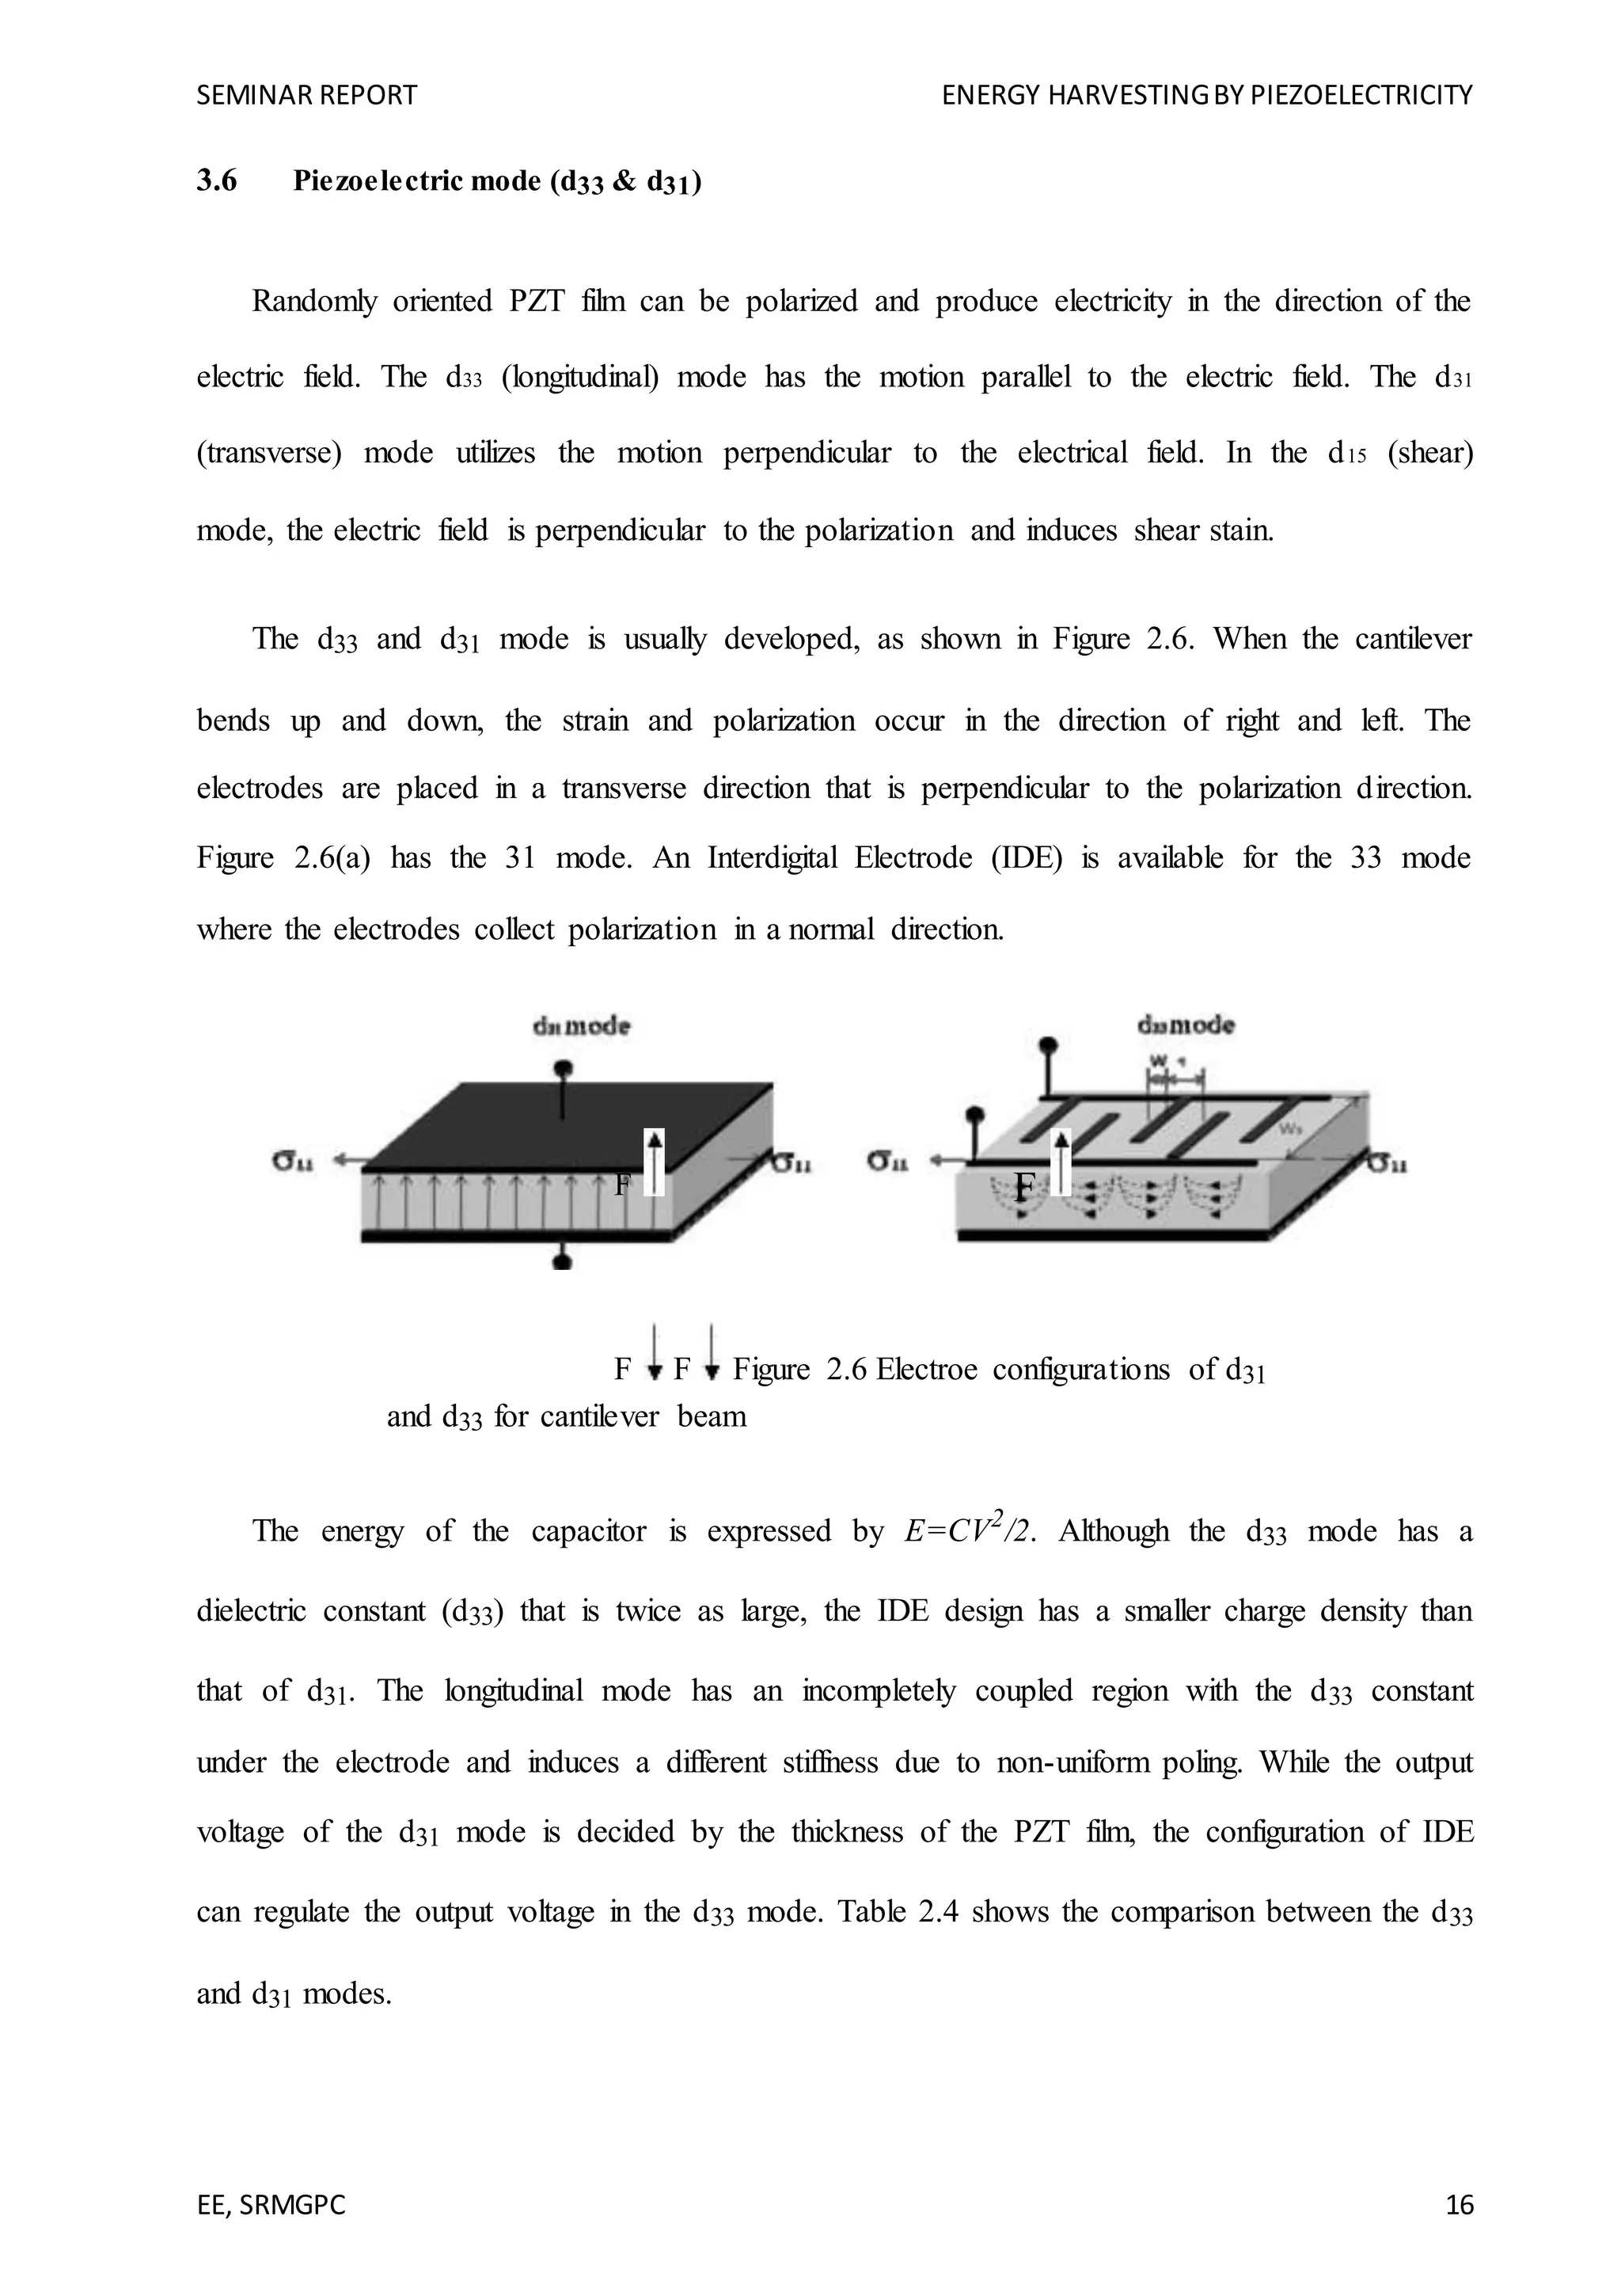
Table 3.4 Comparison between the d33 and d31 modes for energy harvesters
d33 d31
Pro
- High dielectric constant
- Large charge density
- Easy control of PZT microstructure o
- Easy output voltage regulation
n Pt electrode
- High % loss factor
Cont.
(wasted area under electrode)
- Low dielectric constant
- Requires optimization of IDE
- Complicated modeling due to IDE
The optimization of IDE should be executed considering the longitudinal poling to prevent
electrode loss. For example, it is intended that a narrow width of electrode is adequate due to the
small loss under the electrode area. The simulations for optimized IDE design were developed by
Finite Elements Analysis (FEA) [35, 36]. Knight simulated the maximum d33 polarization of
IDE, which is obtained when large spacing (s) between electrodes exists and when the
polarization is decreased by increasing the space between the finger electrodes/thickness of PZT
after a maximum value at 0.8. The width (Ws) between the electrode strips should be four
timeslonger than the spacing (s), and the polarization is dramatically decreased if spacing (s) is
less than 10 µm [36].](https://image.slidesharecdn.com/final9-200412064156/75/Final-9-09-18-piezo-1-21-2048.jpg)
![SEMINAR REPORT ENERGY HARVESTINGBY PIEZOELECTRICITY
EE, SRMGPC 19
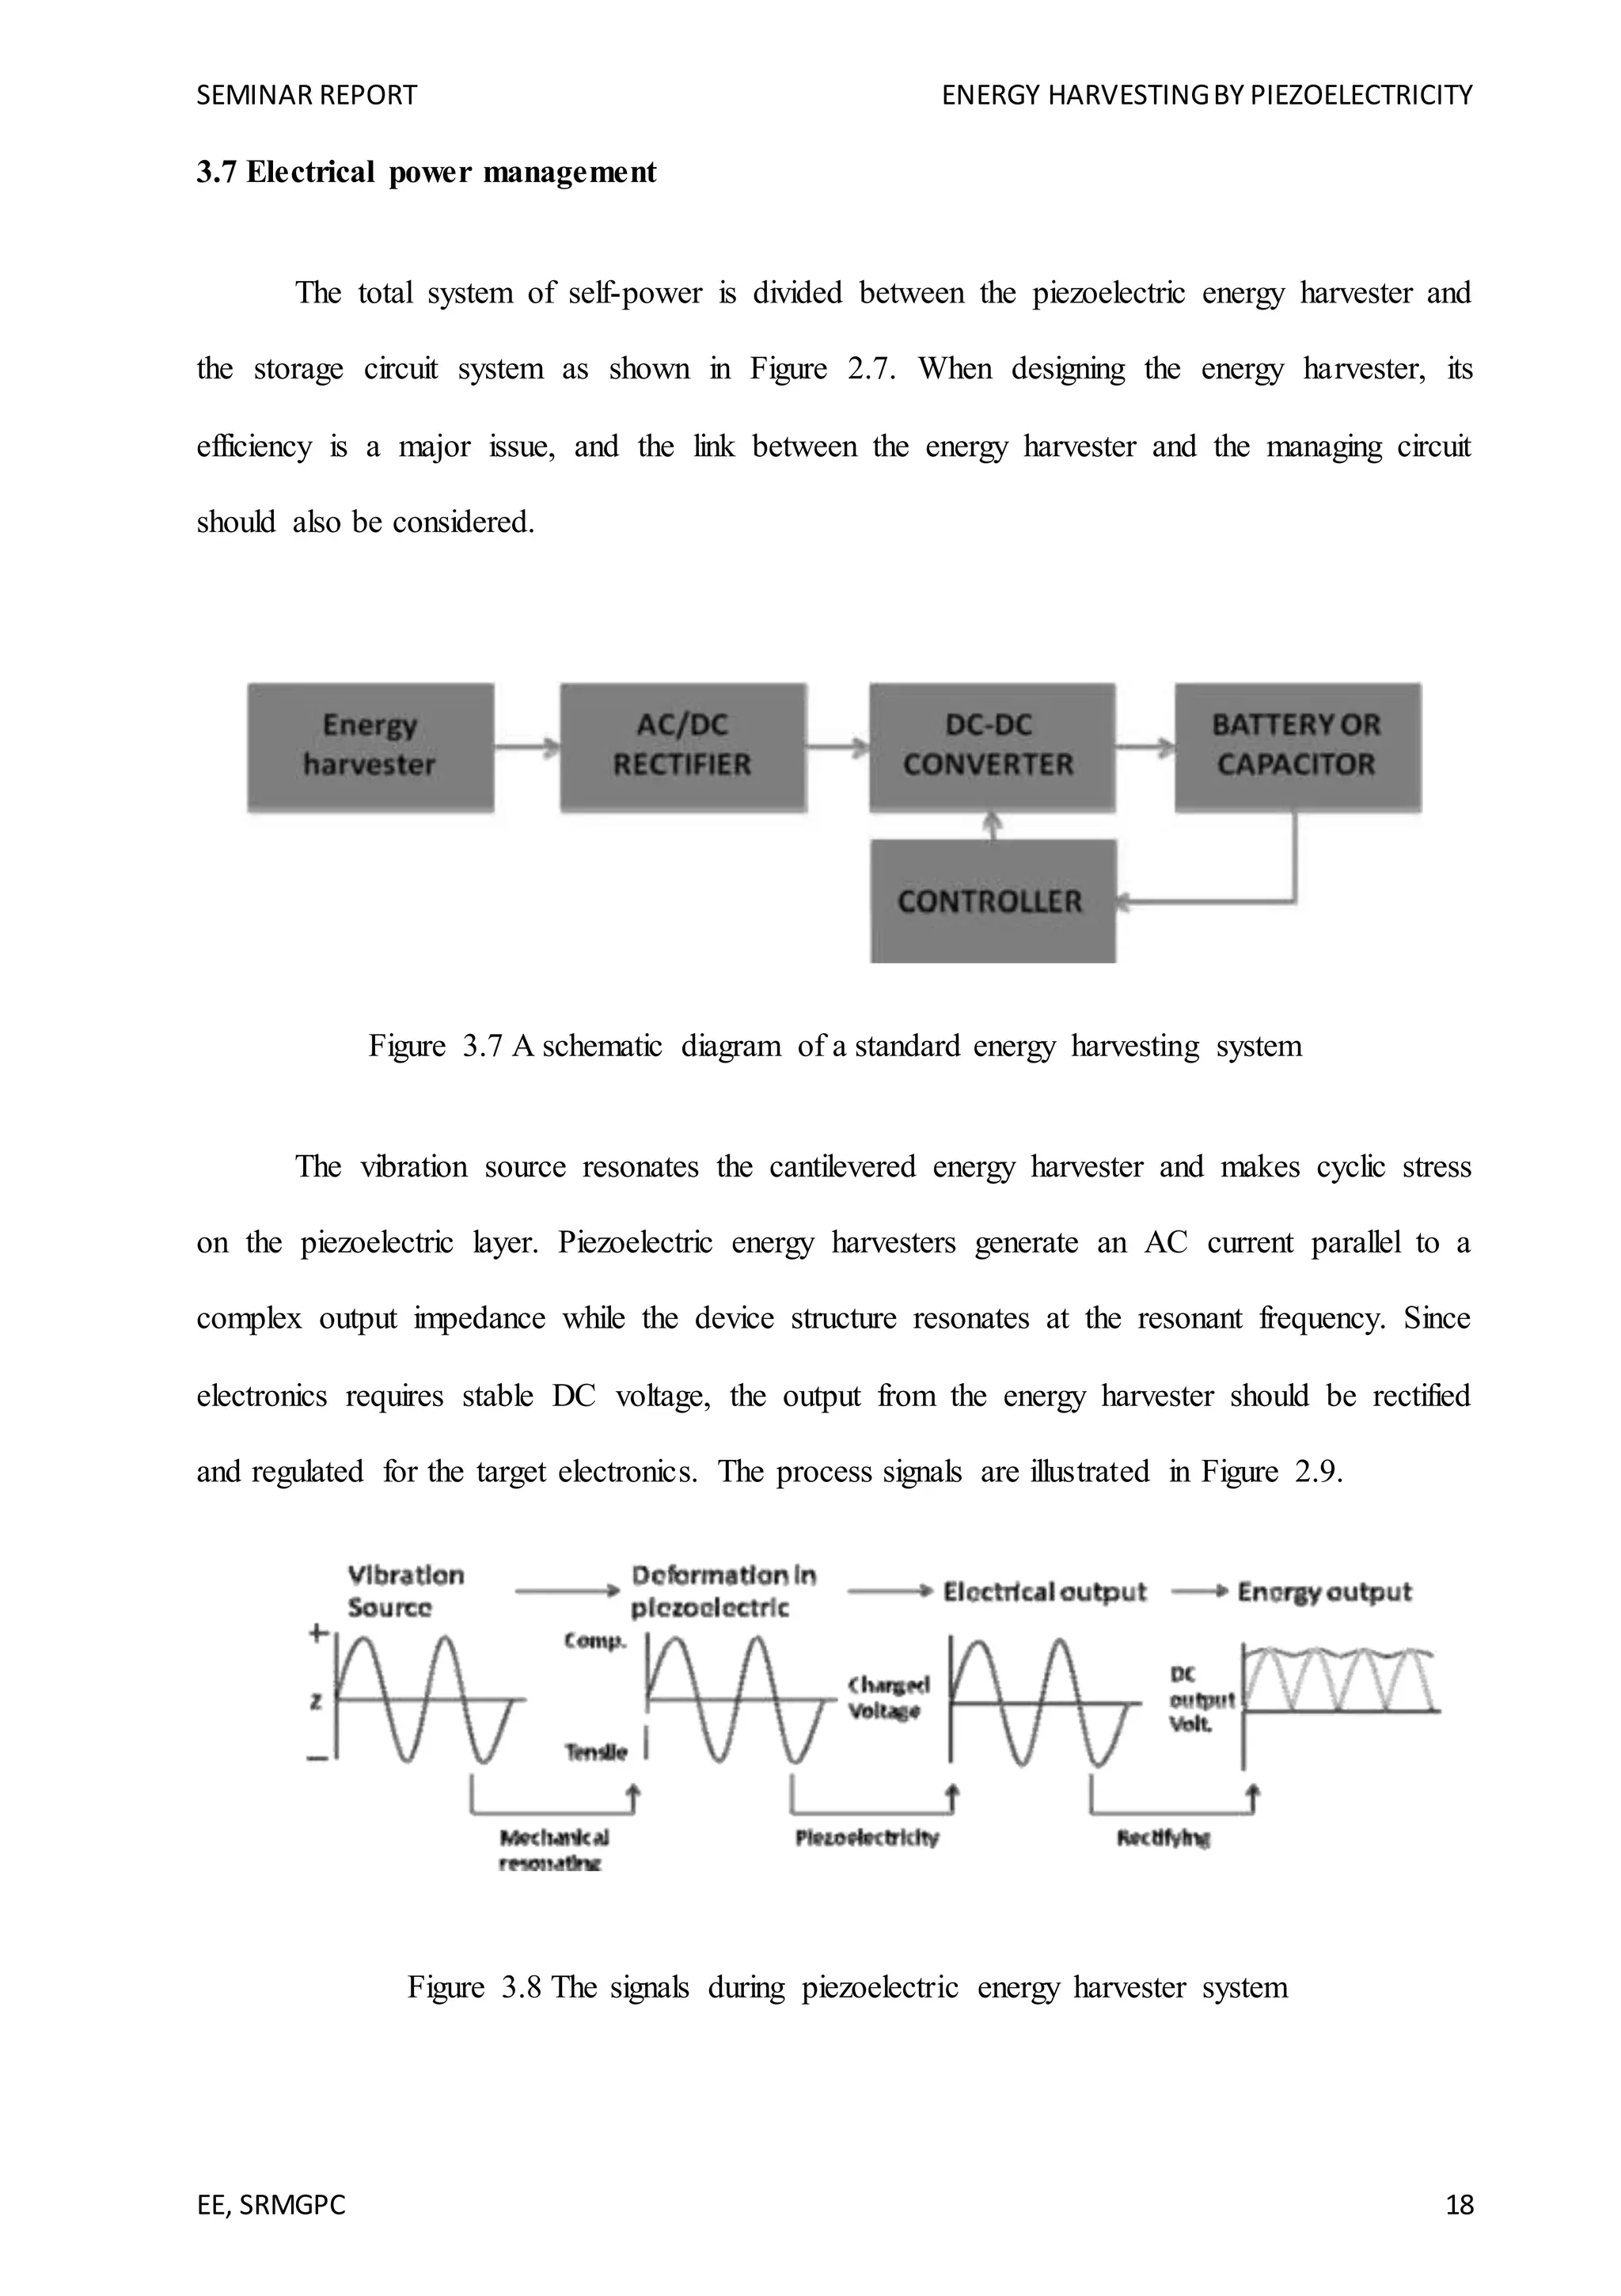
The standard energy harvesting circuit is shown in Figure 2.9. The AC signal is rectified
by full-wave by Wheatstone Bridge and the filtering capacitance is followed to smooth the DC
voltage. The resistive load regulates the voltage. Since the generated electric output is mostly
low and intermittent to be provided to the electronics directly, accumulation or storage of the
electrical energy is required.
Figure 3.9 A standard energy harvesting circuit
The output voltage (Vp) generated from the energy harvester (EH) should be high enough
not to be blocked on the rectifier. The diode rectifier has its own threshold voltage, and thepower
loss occurs through the diode proportional to its threshold voltage. The diode should be selected
considering power losses with low dissipation. The MOS transistor is a possible application with
the advantages of scaling down [37]. In the mean time, Vp should be high enough but not too
high to breakdown the circuits. The power losses occur through all circuit elements and are
constituted as a portion of Vp.
To maximize the power delivery, the impedance of the energy harvester should be
optimized to match that of circuits or vice versa. Piezoelectric energy harvesters produce low
current compared to the generated voltage. The matching impedance might reduce the power
losses on circuits. A higher current, moreover, will reduce the charging time on capacitors.](https://image.slidesharecdn.com/final9-200412064156/75/Final-9-09-18-piezo-1-23-2048.jpg)
![SEMINAR REPORT ENERGY HARVESTINGBY PIEZOELECTRICITY
EE, SRMGPC 20
The electric circuit for piezoelectric energy harvesters has been developed considering
the energy harvester [38-40]. The circuits study predicts the electrical behavior of the
piezoelectric energy harvesting system considering the electrical load, the resonant frequency,
the damping effect, and the electromechanical coupling coefficient. One of the electric circuits
for the piezoelectric energy harvesting system called “Synchronized Switch Harvesting on
Inductor” (SSHI) was proposed [41]. SSHI consists of a switch and an inductor in serial
connection. The switch has a closed state when the transducer makes the maximum
displacement, and the inductance and capacitance of the piezoelectric film produces an oscillator.
The SSHI increases the output power effectively, but the quality factor of this nonlinear
processing circuit is still an issue on efficiency.](https://image.slidesharecdn.com/final9-200412064156/75/Final-9-09-18-piezo-1-24-2048.jpg)
![SEMINAR REPORT ENERGY HARVESTINGBY PIEZOELECTRICITY
EE, SRMGPC 21
4. PIEZOELECTRIC ENERGY HARVESTING
The piezoelectric effect converts mechanical strain into electric current or voltage. This strain
can come from many different sources. Human motion, low-frequency seismic vibrations, and
acoustic noise are everyday examples. Except in rare instances the piezoelectric effect operates
in AC requiring time-varying inputs at mechanical resonance to be efficient.
Most piezoelectric electricity sources produce power on the order of milliwatts, too small for
system application, but enough for hand-held devices such as some commercially available self-
winding wristwatches. One proposal is that they are used for micro-scale devices, such as in a
device harvesting micro-hydraulic energy. In this device, the flow of pressurized hydraulic fluid
drives a reciprocating piston supported by three piezoelectric elements which convert the
pressure fluctuations into an alternating current.
As piezo energy harvesting has been investigated only since the late '90s, it remains an emerging
technology. Nevertheless some interesting improvements were made with the self-powered
electronic switch at INSA school of engineering, implemented by the spin-off Arveni. In 2006,
the proof of concept of a battery-less wireless doorbell push button was created, and recently, a
demonstrator showed that classical TV infra-red remote control can be powered by a piezo
harvester. Other industrial applications appeared between 2000 and 2005 [9], to harvest energy
from vibration and supply sensors for example, or to harvest energy from shock.
Piezoelectric systems can convert motion from the human body into electrical
power. DARPA has funded efforts to harness energy from leg and arm motion, shoe impacts,
and blood pressure for low level power to implantable or wearable sensors. The nanobrushes of
Dr. Zhong Lin Wang are another example of a piezoelectric energy harvester.[10] They can be
integrated into clothing. Careful design is needed to minimise user discomfort. These energy
harvesting sources by association have an impact on the body. The Vibration Energy Scavenging
Project[11] is another project that is set up to try to scavenge electrical energy from
environmental vibrations and movements.
The use of piezoelectric materials to harvest power has already become popular. Piezoelectric
materials have the ability to transform mechanical strain energy into electrical charge. Piezo
elements are being embedded in walkways [12][13][14] to recover the "people energy" of
footsteps. They can also be embedded in shoes [15] to recover "walking energy".
The pyroelectric effect converts a temperature change into electric current or voltage. It is
analogous to the piezoelectric effect, which is another type of ferroelectric behavior. Like](https://image.slidesharecdn.com/final9-200412064156/75/Final-9-09-18-piezo-1-25-2048.jpg)
![SEMINAR REPORT ENERGY HARVESTINGBY PIEZOELECTRICITY
EE, SRMGPC 22
piezoelectricity, pyroelectricity requires time-varying inputs and suffers from small power
outputs in energy harvesting applications. One key advantage of pyroelectrics
over thermoelectrics is that many pyroelectric materials are stable up to 1200 C or more,
enabling energy harvesting from high temperature sources and thus increasing thermodynamic
efficiency. There is a pyroelectric scavenging device that was recently introduced, which doesn't
require time-varying inputs. The energy-harvesting device uses the edge-depolarizing electric
field of a heated pyroelectric to convert heat energy into mechanical energy instead of drawing
electric current off two plates attached to the crystal-faces. Moreover, stages of the novel
pyroelectric heat engine can be cascaded in order to improve the Carnot efficiency.[16]
4.1 MATHEMATICAL MODELING OF PIEZOELECTRIC ENERGY
HARVESTING
The following section describes the development of the PZT models and the
analytical estimations of power generation. It is presented a model of a beam with a single
wafer mounted on its surface. The linear constitutive equations for a piezoelectric material
[13] have been employed in terms of the piezoelectric coefficient e31, the dielectric constant
ε33 and the electric field applied across the thickness of the layer Ez.
The stress σ in z-direction is assumed zero. This occurs when piezoelectric layer thickness in
comparison to the length of the beam can be considered very thin.
4.2 The Cantilever Beam Model
Figure 4.1 shows the setup for the cantilever beam model. The PZT patch is attached to the
beam near the clamped edge for maximum strain. For the estimated power that a PZT can
produce from beam vibrations to be calculated, the moment that the PZT experiences must
first be determined.](https://image.slidesharecdn.com/final9-200412064156/75/Final-9-09-18-piezo-1-26-2048.jpg)
![SEMINAR REPORT ENERGY HARVESTINGBY PIEZOELECTRICITY
EE, SRMGPC 23
4.3 Electrical Modeling of Piezoelectric Materials
From the IEEE Standards on Piezoelectricity [36], the direct and converse
piezoelectric effects, respectively, are
{D}= [e]T {S}+ [α S ]{E}
3.1.1
{T }= [cE ]{S}− [e]{E}
where
{D} = Electric Displacement vector
{T} = Stress vector
[e] = Dielectric permittivity matrix
[cE
] = Matrix of elastic coefficients at constant electric field
strength {S} = Strain vector
[αS
] = Dielectric matrix at constant mechanical
strain {E} = Electric Field vector
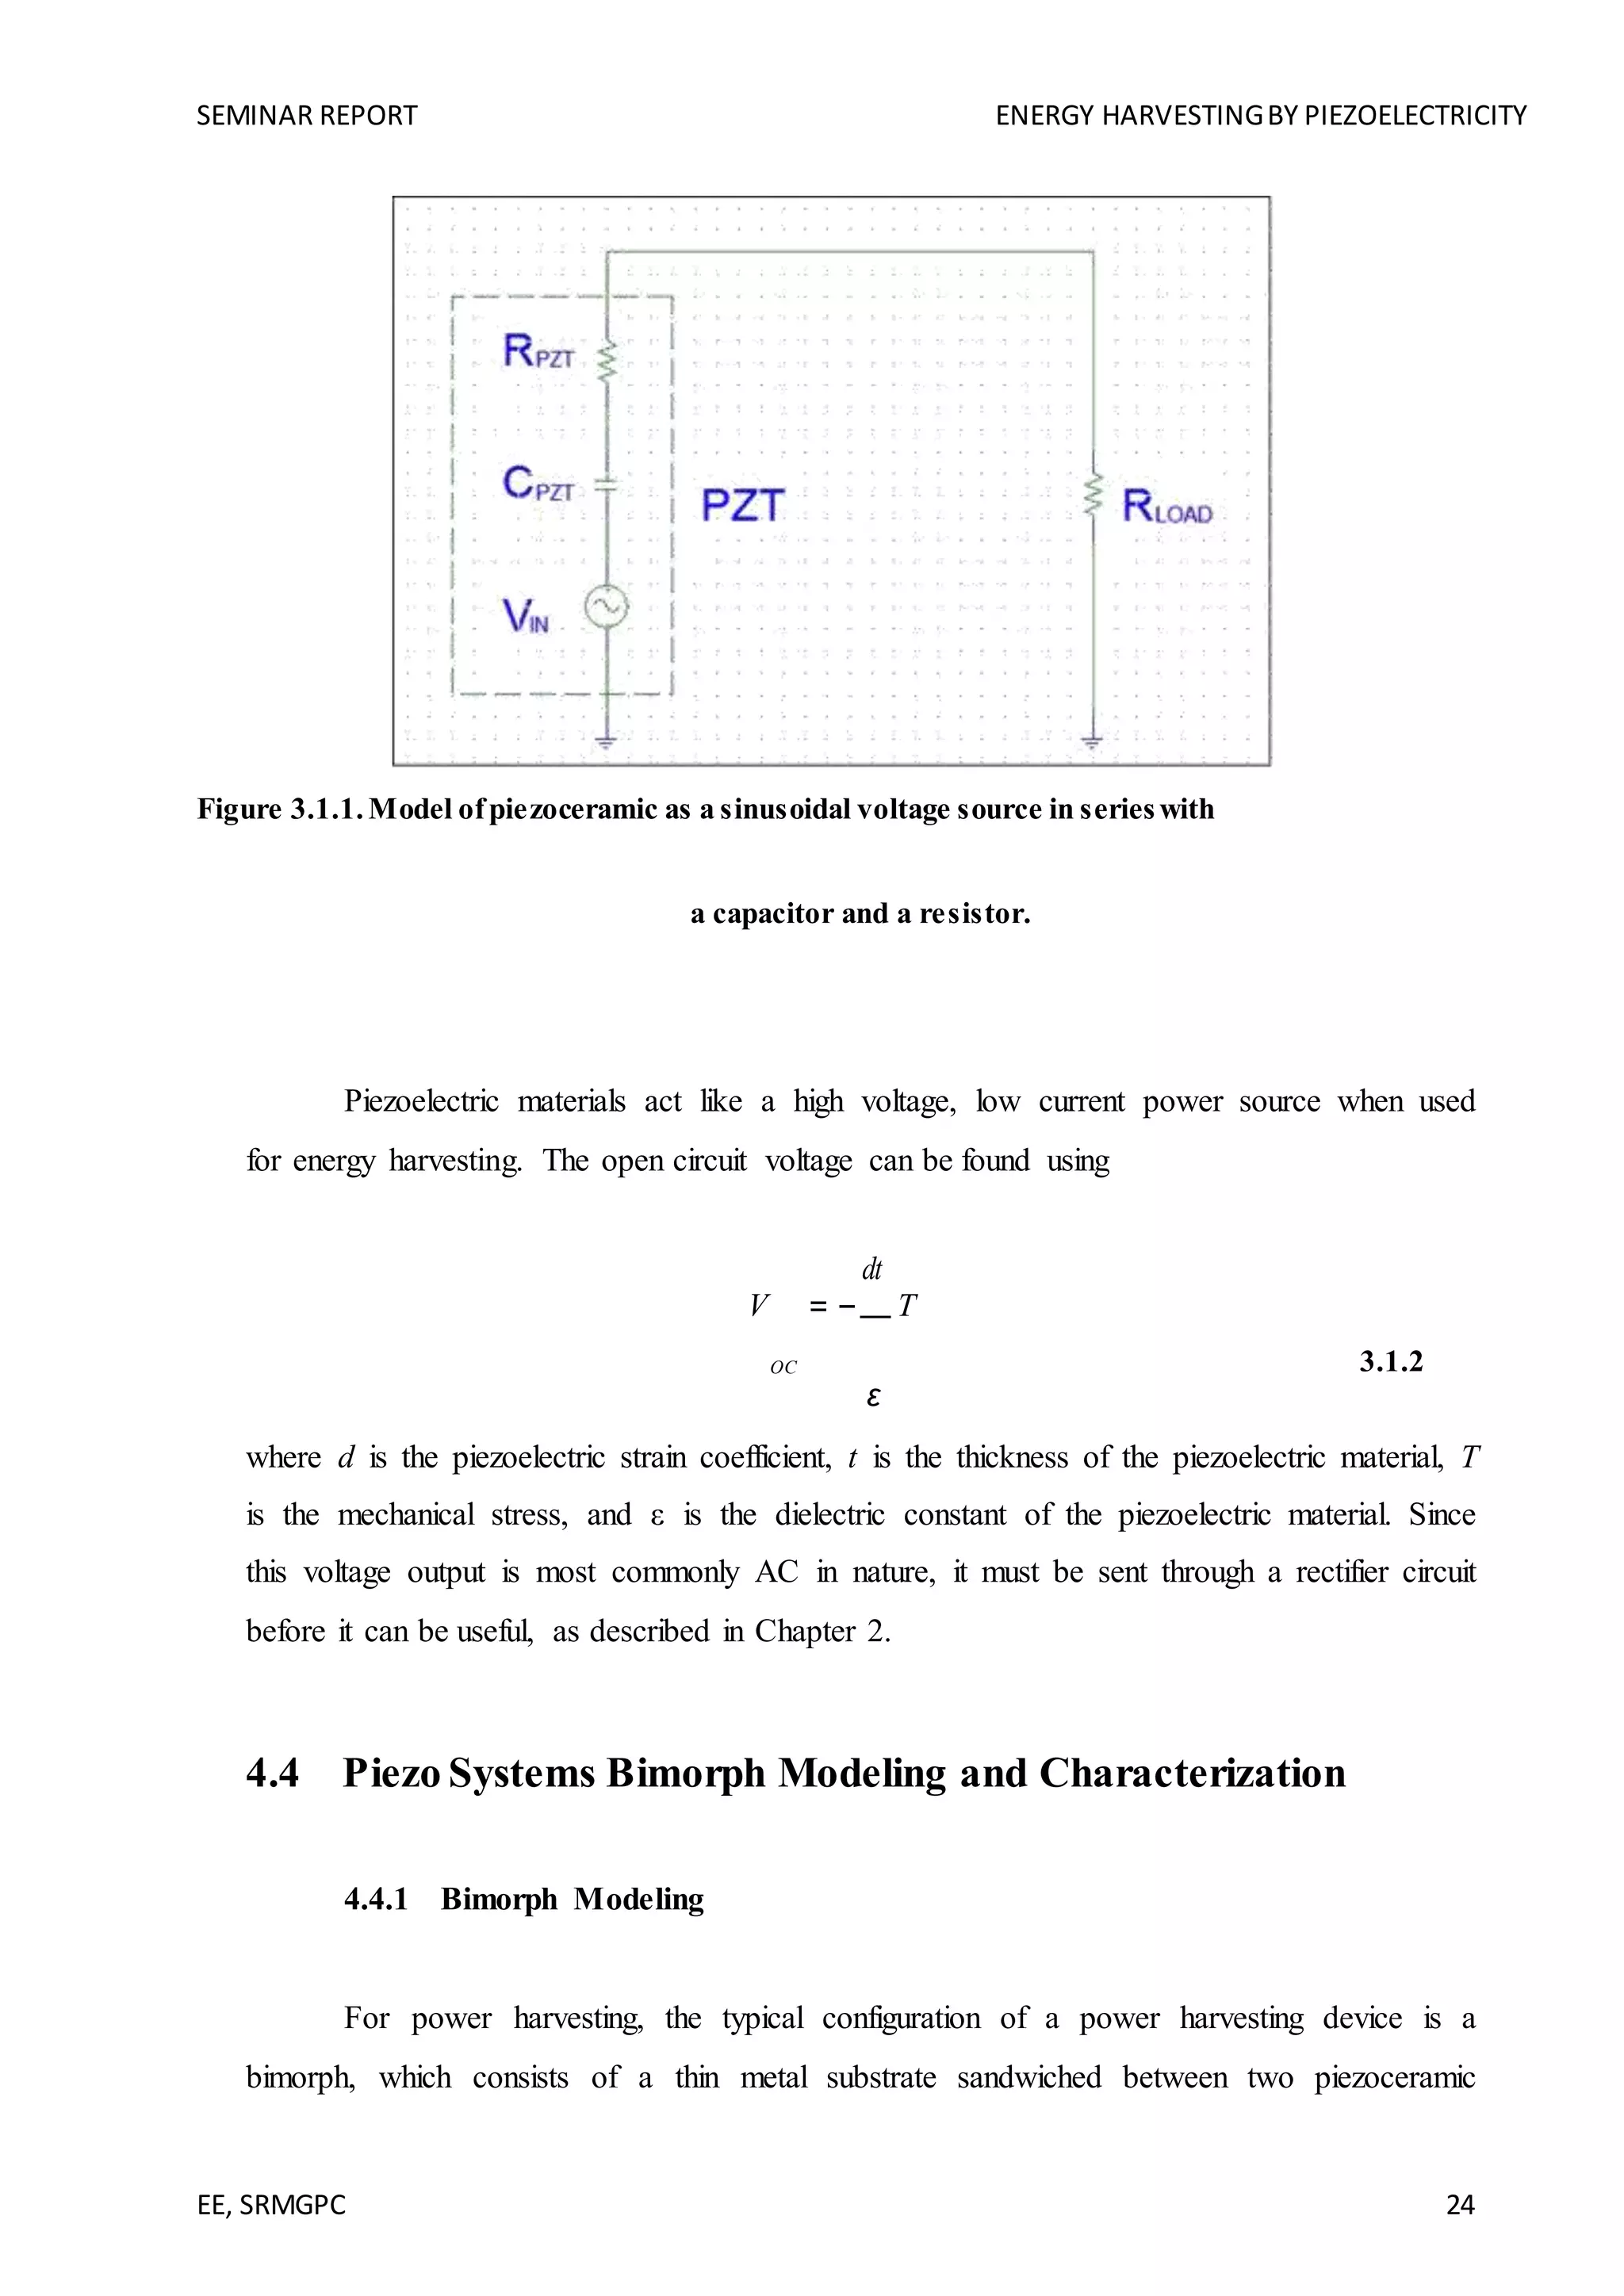
For energy harvesting purposes, the direct piezoelectric effect is utilized. Unlike a
typical electrical power source, a vibrating piezoelectric device differs in that its internal
impedance is capacitive rather than inductive [46]. A piezoceramic patch is most often
modeled as an AC voltage source in series with a capacitor and a resistor, as shown in
Figure 3.1.1. For even simpler models where the device is not being operated near
resonance, the resistance is typically neglected.](https://image.slidesharecdn.com/final9-200412064156/75/Final-9-09-18-piezo-1-27-2048.jpg)
![SEMINAR REPORT ENERGY HARVESTINGBY PIEZOELECTRICITY
EE, SRMGPC 25
patches. Most often, the bimorph is mounted in a cantilever configuration with a tip mass
added to increase strain and to lower the natural frequency of the vibrating beam. The exact
size of the mass attached to the tip can also be specified so that the bimorph
operates within the range of an ambient driving frequency base excitation. Figure 3.2.1 is a
graphical representation of the simplest model for such a device. The first natural frequency
of a slender cantilever beam with a concentrated end mass as given by Blevins is [12]
ωn = 3EI
3.2.1
( M b + 0.24M )L3
where E is the modulus of elasticity, I is the moment of inertia, L is the length of the beam, M
is the mass of the beam, and Mb is the concentrated bulk end mass. In reality, when an
electromagnetic shaker is used to simulate the excitation and for many of the harvesting
applications, the left end of the beam cannot be modeled as fixed but rather as another very
large vibrating mass. Improved models are being developed by Erturk and Inman [30] to
better modeled the left side of the beam. However, to simplify the equations in this section,
the left end is assumed to have a fixed boundary condition.
E, I, M Mb x(0)
L x(t)](https://image.slidesharecdn.com/final9-200412064156/75/Final-9-09-18-piezo-1-29-2048.jpg)
![SEMINAR REPORT ENERGY HARVESTINGBY PIEZOELECTRICITY
EE, SRMGPC 26
Figure 4.2.1. Cantilever beam with added tip mass.
A piezoelectric bimorph is more complicated than this simple cantilever beam model in that it
consists of a metal shim layer sandwiched between two piezoceramic layers. Therefore, an
equivalent Young’s modulus and moment of inertia must be calculated in order to determine
the first natural frequency. For the purposes of these calculations, the thickness of the
bonding layers is neglected. Figure 3.2.2 is a cross section of such a bimorph device.
tc
b
tsh
tc
w = width of the beam
tc = thickness of an individual piezoelectric ceramic layer
b = distance from the center of the shim to the center of the piezo layers tsh
= thickness of the center shim,
Figure 4.2.2. Layers representing a piezoelectric bimorph.
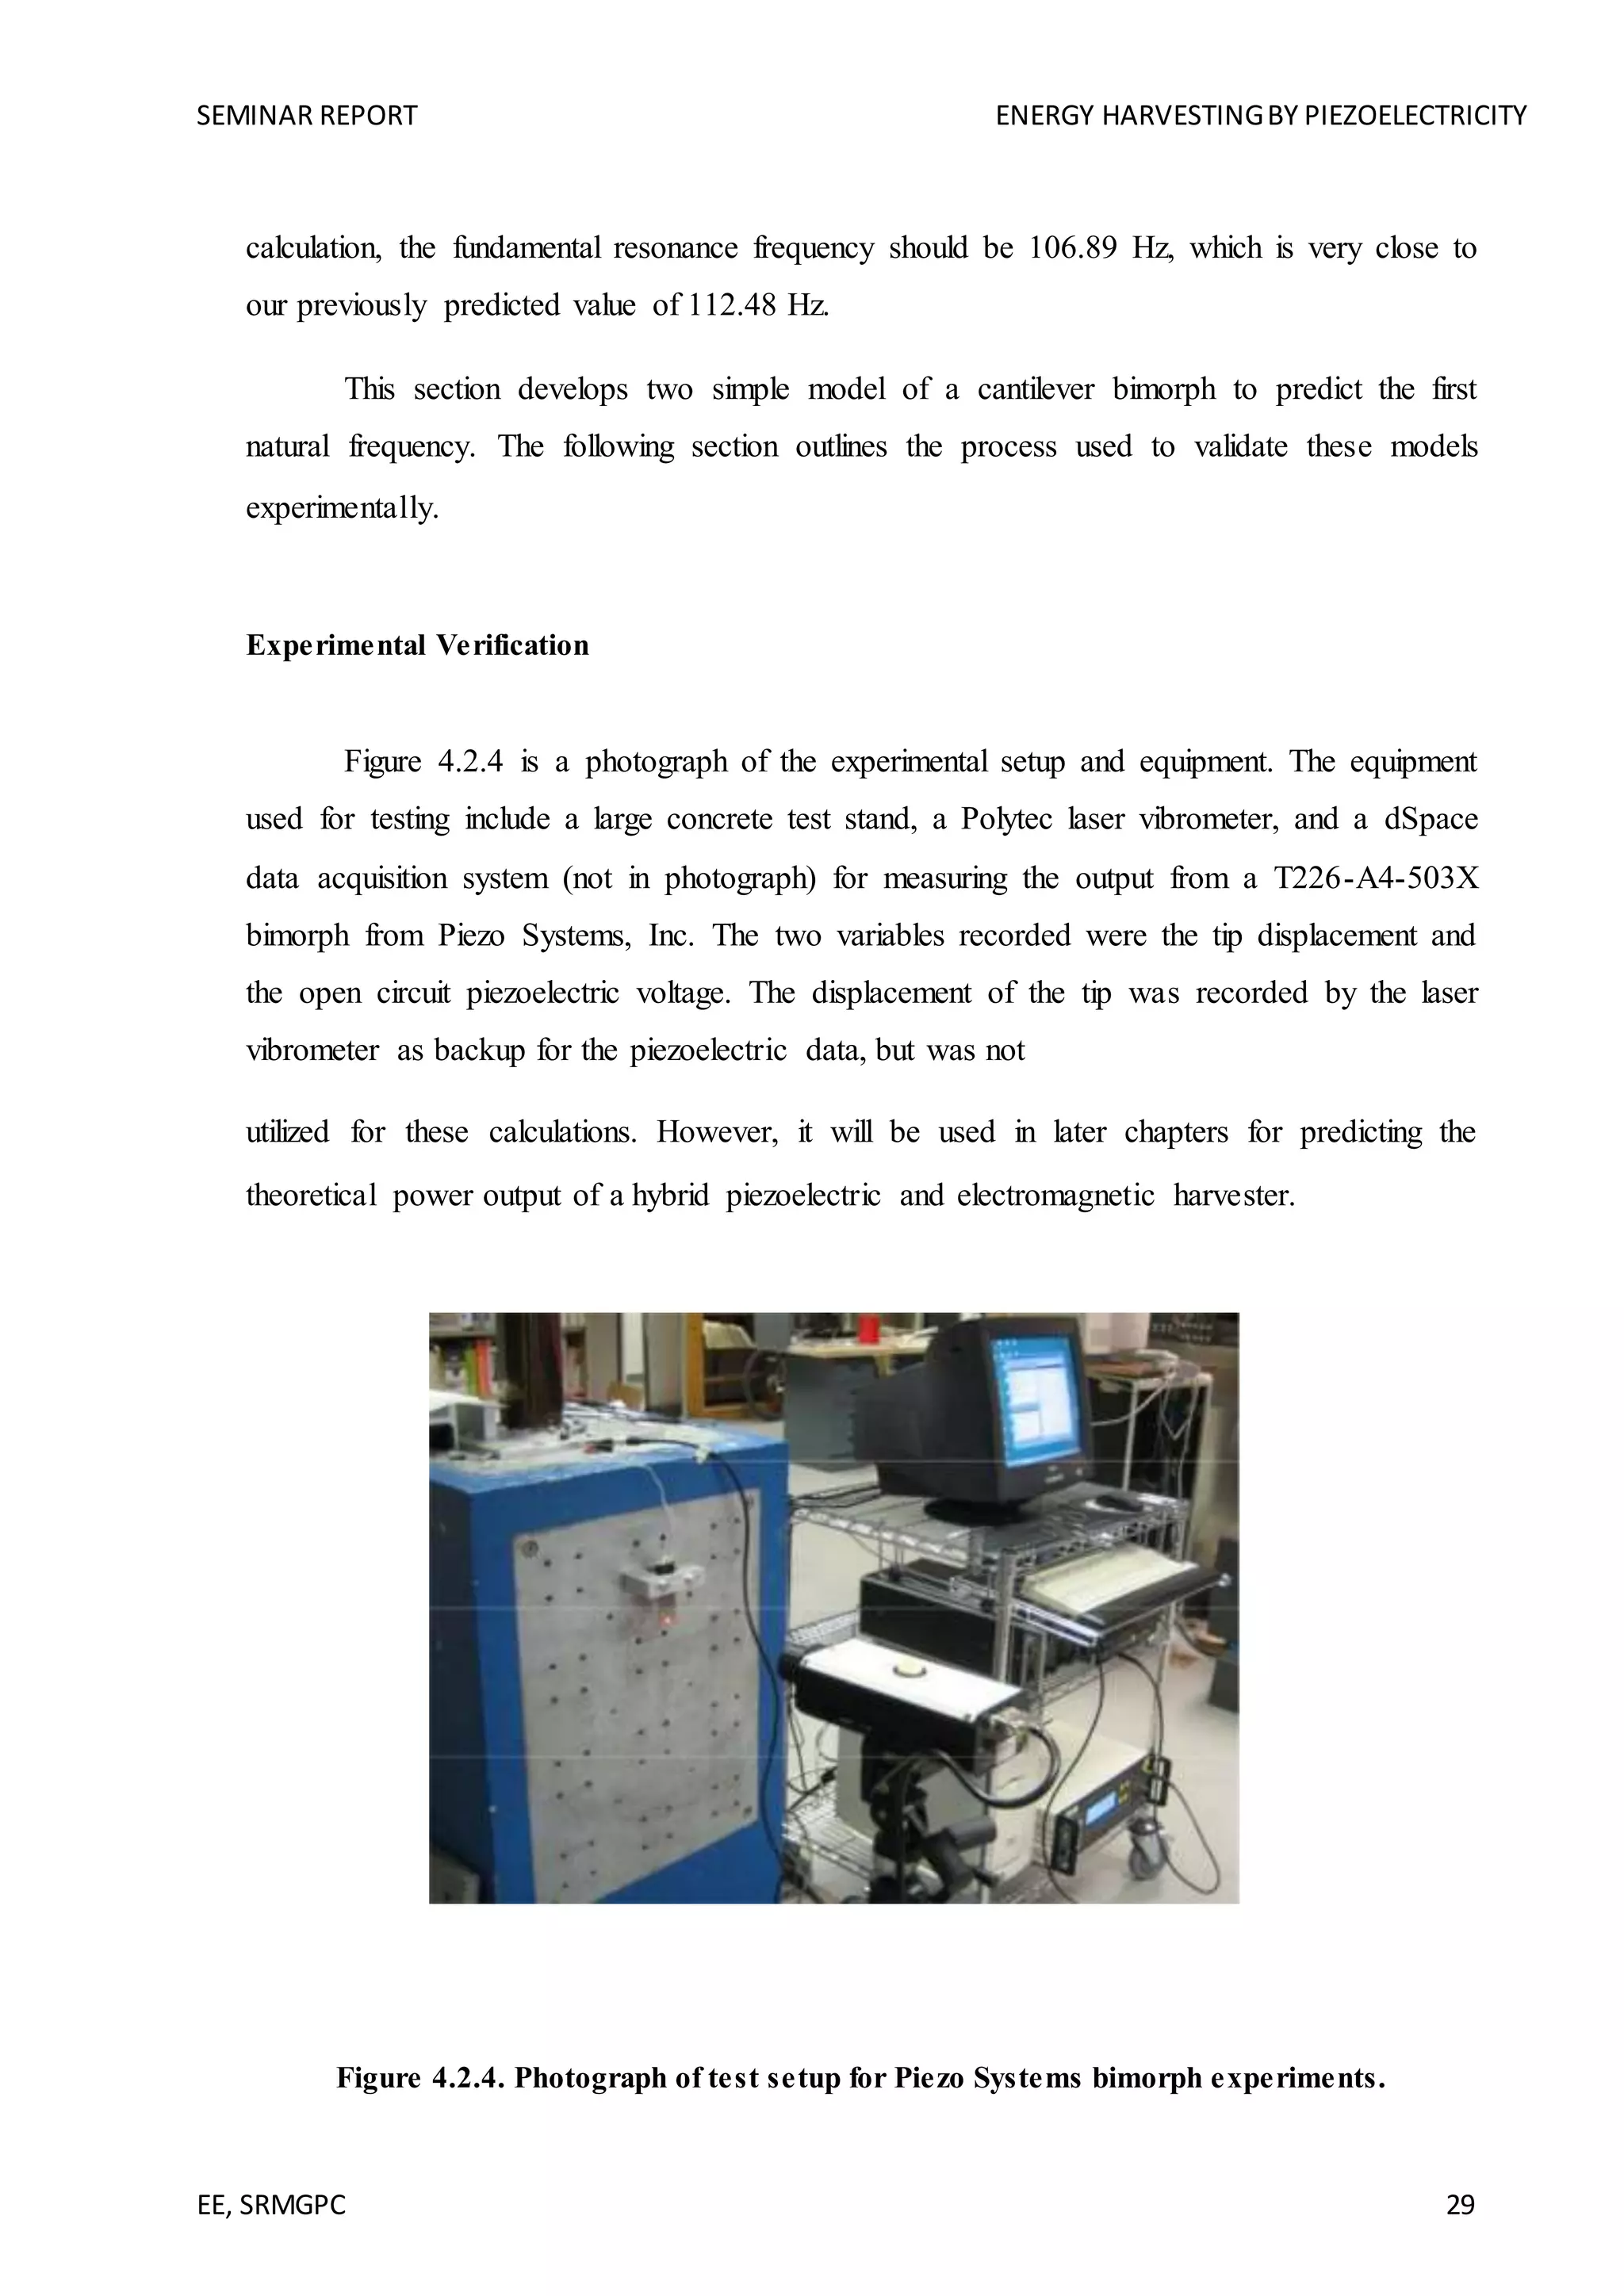
The ultimate goal is to use a device such as the Piezo Systems, Inc. T226-A4-503X
bimorph in a cantilever configuration with a tip mass to tune the first natural frequency to a
desired value. Previous experimentation has been performed by duToit et al [26], but further
investigation was performed in the lab to validate the proposed model. Some of the values](https://image.slidesharecdn.com/final9-200412064156/75/Final-9-09-18-piezo-1-30-2048.jpg)
![SEMINAR REPORT ENERGY HARVESTINGBY PIEZOELECTRICITY
EE, SRMGPC 27
obtained by duToit et al [26] are used for calculations here. According to the equations
provided by Roundy, the effective moment of inertia is [63]
3 3
I = 2
wtc
+ wtcb2
+
ηs wtsh
12 12 3.2.2
where ηs = ratio of Young’s modulus for piezo to Young’s modulus for shim. The
values required to calculate the effective moment of inertia are provided in Table 3.2.1,
leading to an effective moment of inertia I of 8.29e-13
m4
. The equivalent Young’s modulus
can be calculated using [63]
E
equiv
= 2tc Ec + tsh Esh
= 73 GPa
2tc + tsh 3.2.3
Table 4.2.1. Properties of Piezo Systems, Inc. T226-A4-503X bimorph.
Beam width, w 31.75 mm
Beam length, L 55.0 mm
Piezo layer thickness, tc 270 µm
Shim layer thickness, tsh 140 µm
Distance from shim layer center to 205 µm
piezo layer center, b
Young’s modulus for piezo layer, Ec 66 GPa
Young’s modulus for shim layer, Esh 100 GPa
Ratio of Young’s modulus for piezo to 0.66
Young’s modulus for shim, ηs
Piezoceramic density, ρ p 7800 kg/m3
Shim layer density, ρs 7165 kg/m3](https://image.slidesharecdn.com/final9-200412064156/75/Final-9-09-18-piezo-1-31-2048.jpg)
![SEMINAR REPORT ENERGY HARVESTINGBY PIEZOELECTRICITY
EE, SRMGPC 28
The only remaining undefined variable is the bulk tip mass, Mb. Performing a
parametric study, we can predict how the natural frequency should change as a function of
the tip mass. Figure 3.2.3 plots the predicted first natural frequency as a function of the
normalized tip mass, and Table 3.2.2 shows the predicted first natural frequency for several
normalized tip mass values. With no tip mass added, the model predicts a first natural
frequency of 112.49 Hz. The graph shows that the ratio of the tip mass to the device mass can
greatly influence the first natural frequency when the tip mass to beam mass ratio is less than
2.
Table 4.2.2. First resonant frequency for normalized tip mass values.
Normalized tip First Natural
mass Frequency (Hz)
0 112.49
1 49.50
2 36.83
3 30.62
4 26.76
5 24.07
6 22.06
To validate the simple model used for these predictions, a second model from another
literature source is used for verification. Adapted from Wang and Cross [85], the first natural
frequency of a cantilever bimorph with no tip mass is
fr =
3.52t E
c
1 + 3(1 + 2B)2 + 4AB3
1/ 2
2 2
+ 1) 3.2.44πL
3ρ
c 4(1 + B) ( BC
Where A = Esh / Ec, B = tsh / 2tc, t = tsh + 2tc, and C = ρsh / ρc . Based upon this](https://image.slidesharecdn.com/final9-200412064156/75/Final-9-09-18-piezo-1-32-2048.jpg)
![SEMINAR REPORT ENERGY HARVESTINGBY PIEZOELECTRICITY
EE, SRMGPC 30
It was initially proposed to use a Kistler impulse hammer to provide an initial
disturbance to the bimorph. However, due to space issues, the impact hammer was unable to
be used during testing. Therefore, the tip of a mechanical pencil was used to “flick” the tip of
the cantilevered bimorph in the center to provide the initial disturbance.
Figure 3.2.5 is the open circuit voltage output of the piezoelectric bimorph after the
initial disturbance for a case of no tip mass and a small 4.8 gram metal tip mass which was
attached to the end of the bimorph using cyanoacrylate. Figure 3.2.6 is a plot of the tip
displacement measured simultaneously by the laser vibrometer. A small piece of reflective
tape of negligible mass was attached to the tip of the bimorph to reflect the laser beam.
In order to determine the mechanical damping ratio, the logarithmic decrement
method is used. As defined by Inman [37], logarithmic decrement, denoted by δ , can be
calculated from the experimental data using
δ =
1
ln
x(t)
3.2.5
x(t + nT )n
where n is any integer number of successive positive peaks. Table 3.2.3 is a summary of the
positive voltage peaks and the corresponding time for no added tip mass and a 4.8 gram tip
mass. With these voltage values, the logarithmic decrement can be calculated from peak to
peak. Averaging the δ values obtained, the damping ratio can be determined using
ζ =
δ
3.2.6
4π 2 + δ 2
Next, to determine the undamped natural frequency of the device, we can relate it to the
damped natural frequency, ωd , of the device using the relationship](https://image.slidesharecdn.com/final9-200412064156/75/Final-9-09-18-piezo-1-34-2048.jpg)
![SEMINAR REPORT ENERGY HARVESTINGBY PIEZOELECTRICITY
EE, SRMGPC 31
ωn =
ωd
3.2.7
1− ζ 2
4.4.2 Power Generation Setup and Bimorph Characterization
The setup consisted of a Hewlett Packard 3314A function generator, two Ling
Dynamic Systems shakers, two Piezo Systems, Inc. bimorphs, and a dSpace unit used for
recording voltages. Because the direct output of the function generator sufficiently generated
the desired acceleration vibrations, no amplifier was used. Special care was taken to construct
two nearly identical shaker mounts for the bimorph devices, and to ensure that the clamped
length of each bimorph was 55.0 mm, similar to the boundary conditions described by du
Toit et al [26]. The wires attached to the bimorph are all the same length, and the BNC cables
leading to the dSpace computer are very close to the same length. A special box, seen in the
bottom right corner of Figure 3.2.7, was
constructed using two six-position switches that allowed for the switching between thirty six
possible resistor combinations very rapidly to reduce the overall testing time.
The original intent of constructing two identical shaker mounts and bimorphs was to
ultimately test the effects of unequal and out of phase vibrations when the two bimorphs were
wired together. Some preliminary results were obtained, but are not presented.](https://image.slidesharecdn.com/final9-200412064156/75/Final-9-09-18-piezo-1-35-2048.jpg)
![SEMINAR REPORT ENERGY HARVESTINGBY PIEZOELECTRICITY
EE, SRMGPC 32
Figure 4.2.7. Photograph of multiple bimorph testing setup and equipment.
Based upon previous results, the function generator was set to output a sine wave of a
particular voltage at 99.8 Hertz, corresponding to the experimental first natural frequency of
the bimorph device. Some errors may arise due to the fact that the mass at the shaker end has
not been properly modeled and the bimorph cannot truly be considered a cantilevered beam
with a fixed base in this configuration.
To first study the device, a characterization of the open circuit voltage as a function of
the input acceleration was performed. Figure 3.2.8 is a photograph of the experimental setup
with a Kistler teardrop accelerometer affixed to the top of the shaker to measure the input
acceleration of the first bimorph. The voltage on the function
generator was increased from 1 to 10 volts in one volt increments, and the corresponding
piezoelectric open circuit voltage and the peak to peak acceleration values were recorded.
The process was again repeated on the second bimorph, and the results were recorded and
plotted alongside the first test results in Figure 3.2.9.
Figure 4.2.8.Photograph oftest setup with Kistler teardrop accelerometer secured to the base.
Comparing these results to duToit et al [26], both bimorphs used in this experiment appear to have a
higher open circuit voltage than the ones tested in their seminar. One possible explanation is that the
clamping condition of the bolts used to secure the device to the base was not controlled as they were](https://image.slidesharecdn.com/final9-200412064156/75/Final-9-09-18-piezo-1-36-2048.jpg)


![SEMINAR REPORT ENERGY HARVESTINGBY PIEZOELECTRICITY
EE, SRMGPC 37
REFERENCES
[1] H. R. Silva, J. A. Afonso, P. C. Morim, P. M. Oliveira, J. H. Correia and
L. A. Rocha , “Wireless Hydrotherapy Smart-Suit Network for Posture Monitoring,” Proc IEEE.
International Symposium on Industrial Electronics, ISIE, 4-7 June 2007, pp. 2713-2717.
[2] S. Roundy, P.K. Wright, and J. Rabaey, “Energy Scavenging for Wireless Sensor Networks with
Special Focus on Vibrations,” Kluwer Academic Press, 2003.
[3] S. Roundy, E. S. Leland, J. Baker, E. Carleton, E. Reilly, E. Lai, B. Otis,
J.M. Rabaey, P. K. Wright, “Improving Power Output for Vibration-Based Energy Scavengers,”
Pervasive Computing 2005 pp 28-36.
[4] M. El-hami et al., “Design and Fabrication of a New Vibration-Based Electromechanical Power
Generator,” Sensors and Actuators A: Physical, vol. 92, nos. 1–3, 2001, pp. 335–342.
[5] M. Miyazaki et al., “Electric-Energy Generation Using Variable-Capacitive Resonator for
Power-Free LSI,” Proc. Int’l Symp. Low Power Electronics and Design (ISLPED), 2003, pp.
193–198.
[6] C. Keawboonchuay, T. G. Engel, “Maximum power generation in a piezoelectric pulse
generator,” IEEE Trans. Plasma Science, Vol. 31 (1), 2003, pp. 123 – 128.
[7] Jiashi Yang, Ziguang Chen, Yuantai Hu, “An exact analysis of a rectangular plate piezoelectric
generator,” IEEE Trans. Ultrasonics, Ferroelectrics and Frequency Control, Vol. 54 (1), 2007, pp.
190 – 195.
[8] M.S.M Soliman,. E.F El-Saadany,. R.R Mansour,.”Electromagnetic MEMS Based Micro-Power
Generator,” IEEE International Symposium on Industrial Electronics, Vol. 4, 9-13 July 2006, pp.
2747 – 2753.](https://image.slidesharecdn.com/final9-200412064156/75/Final-9-09-18-piezo-1-41-2048.jpg)


