SlideShare a Scribd company logo
1 of 40
Sanjivani Rural Education Society's
Sanjivani College of Engineering, Kopargaon 423603.
-Department of Strucutral Engineering-
By
Mr. Sumit S. Kolapkar (Assistant Professor)
Mail Id- kolapkarsumitst@sanjivani.org.in
Ø Why data visualization in Python-
• Is a quick and easy way to convey the concepts in a
universal manner.
Ø What is data visualization-
• Is a graphical way of representing information and
data.
Ø Types of data visualization in Python-
• Plotting Libraries-
• Matplotlib-
• Pandas Visualization-
• Seaborn-
• ggplot-
• Plotly-
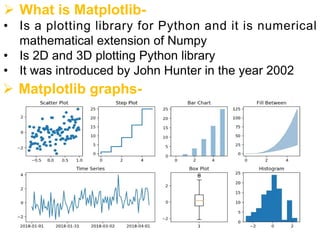
Ø What is Matplotlib-
• Is a plotting library for Python and it is numerical
mathematical extension of Numpy
• Is 2D and 3D plotting Python library
• It was introduced by John Hunter in the year 2002
Ø Matplotlib graphs-
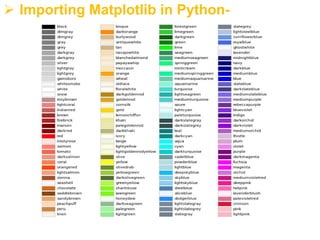
Ø Importing Matplotlib in Python-
• import matplotlib.pyplot as plt
OR
• from matplotlib import pyplot as plt
Example-
import matplotlib.pyplot as plt
x=[1,2,3,4,5]
y=[6,7,8,9,10]
plt.plot(x,y)
plt.show ()
Example-
import matplotlib.pyplot as plt
x=[1,2,3,4,5]
y=[6,7,8,9,10]
plt.bar(x,y)
plt.show ()
Ø Importing Matplotlib in Python-
Example-
import matplotlib.pyplot as plt
x=[1,2,3,4,5]
y=[6,7,8,9,10]
Z=['b','g','r','black','pink']
plt.bar(x,y,color=Z)
plt.show ()
Base Color-
Ø Importing Matplotlib in Python-
Ø Matplotlib Bar Plot-
• import matplotlib.pyplot as plt
x = ['Python','C','C++', 'Java']
y = [90,65,82,85]
plt.bar(x,y)
plt.show ()
Ø Matplotlib Bar Plot-
• import matplotlib.pyplot as plt
x=[ ]
y=[ ]
z=[ ]
plt.bar(x,y, width=0.4, color=“y”, align= “edge” (or center),
edgecolor=“r”, linewidth=10, linestyle=“:”, alpha=0.4,
label=“Popularity”)
plt.bar(x,z, width=0.4, color=“g”, align=edge, edgecolor=“r”,
linewidth=10, linestyle=“:”, alpha=0.4, label=“Popularity1”)...for
multiple bar graphs
plt.legend()
plt.show( )
plt.xlabel (“languages”, fontsize=10)
plt.ylabel(“No.” ”, font size=10)
plt.title(“Graph1” ”, font size=10)
Note- To apply the label we must apply for legend.
Ø Matplotlib Bar Plot-
• import matplotlib.pyplot as plt
x=[ ]
y=[ ]
z=[ ]
plt.bar(x,y, width=0.4, color=“y”,label=“Popularity”)
plt.bar(x,z, width=0.4, color=“g”, label=“Popularity1”)...for
multiple bar graphs.....overlapped
plt.legend()
plt.show( )
plt.xlabel (“languages”, fontsize=10)
plt.ylabel(“No.” ”, font size=10)
plt.title(“Graph1” ”, font size=10)
Note- To apply the label we must apply for legend.
Ø Matplotlib Bar Plot- Side by Side Graph
• import matplotlib.pyplot as plt
• import numpy as np
x=[ “python”, “c”, “c++”, “java”]
y=[80,70,60,82 ]
z=[ 20,30,40,50]
p = [0,1,2,3].....indexing of x
OR
p = np.arange(len(x))...by importing numpy also we can create an array of indexing
width = 0.4
plt.bar(p,y, width, color=“y”,label=“Popularity”)....x replaced with ‘p’
plt.bar(p,z, width, color=“g”, label=“Popularity1”)....x replaced with ‘p’
plt.legend()
plt.show( )
plt.xlabel (“languages”, fontsize=10)
plt.ylabel(“No.” ”, font size=10)
plt.title(“Graph1” ”, font size=10)
Note- To apply the label we must apply for legend.
gives number
at x-axis and
is over lapped
Ø Matplotlib Bar Plot- Side by Side Graph
• import matplotlib.pyplot as plt
• import numpy as np
x=[ “python”, “c”, “c++”, “java”]
y=[80,70,60,82 ]
z=[ 20,30,40,50]
width = 0.4
p = np.arange(len(x))
p1=[ j+width for j in p]...will create another graph of same width on side
plt.bar(p,y, width, color=“y”,label=“Popularity”)....x replaced with ‘p’
plt.bar(p1,z, width, color=“g”, label=“Popularity1”)....x replaced with ‘p’
plt.legend()
plt.show( )
plt.xlabel (“languages”, fontsize=10)
plt.ylabel(“No.” ”, font size=10)
plt.title(“Graph1” ”, font size=10)
Note- To apply the label we must apply for legend.
gives number
at x-axis
Ø Matplotlib Bar Plot- Side by Side Graph
• import matplotlib.pyplot as plt
• import numpy as np
x=[ “python”, “c”, “c++”, “java”]
y=[80,70,60,82 ]
z=[ 20,30,40,50]
width = 0.4
p = np.arange(len(x))
p1=[ j+width for j in p]...will create another graph of same width on side
plt.bar(p,y, width, color=“y”,label=“Popularity”)....x replaced with ‘p’
plt.bar(p1,z, width, color=“g”, label=“Popularity1”)....x replaced with ‘p’
plt.xticks(p+width,x)......to show name at x-axisand at right hand side
plt.legend()
plt.show( )
plt.xlabel (“languages”, fontsize=10)
plt.ylabel(“No.” ”, font size=10)
plt.title(“Graph1” ”, font size=10)
Note- To apply the label we must apply for legend.
gives name at
RHS
Ø Matplotlib Bar Plot- Side by Side Graph
• import matplotlib.pyplot as plt
• import numpy as np
x=[ “python”, “c”, “c++”, “java”]
y=[80,70,60,82 ]
z=[ 20,30,40,50]
width = 0.4
p = np.arange(len(x))
p1=[ j+width for j in p]...will create another graph of same width on side
plt.bar(p,y, width, color=“y”,label=“Popularity”)....x replaced with ‘p’
plt.bar(p1,z, width, color=“g”, label=“Popularity1”)....x replaced with ‘p’
plt.xticks(p+width/2,x,rotation=10)......to show name at x-axis and at
center
plt.legend()
plt.show( )
plt.xlabel (“languages”, fontsize=10)
plt.ylabel(“No.” ”, font size=10)
plt.title(“Graph1” ”, font size=10)
Note- To apply the label we must apply for legend.
gives name in
rotation
Ø Matplotlib Bar Plot- Horizontal Graph
• import matplotlib.pyplot as plt
• import numpy as np
• x=['Python','C','C++', 'Java']
• y=[90,65,82,85]
• z=[23,52,29,20]
• width = 0.8
• p=np.arange(len(x))
• p1=[j+width for j in p]
• plt.barh(p,y, width, color='r')
• plt.bar(p1,z, width, color='k')
• plt.xticks(p+width/2,x,rotation=50)
• plt.show ()
Ø Matplotlib Step Plot-
• import matplotlib.pyplot as plt
x=[ ]
y=[ ]
plt.step(x,y,marker= “o”, color= “r”, ms=10, mfc=
“g”)
plt.legend()
plt.grid()
plt.show( )
plt.xlabel (“languages”, font size=10)
plt.ylabel(“No.” ”, font size=10)
plt.title(“Graph1” ”, font size=10)
Note-To align the bars on the right edge pass a negative
width and align='edge'
Ø Matplotlib Pie Plot-
• import matplotlib.pyplot as plt
• x=[1,2,3,4]
• y=["C","C++","Java","Python"]
• plt.pie(x)
• plt.show ()
• import matplotlib.pyplot as plt
• x=[1,2,3,4]
• y=["C","C++","Java","Python"]
• plt.pie(x,labels=y)
• plt.show ()
Ø Matplotlib Pie Plot-
• import matplotlib.pyplot as plt
• x=[1,2,3,4]
• y=["C","C++","Java","Python"]
• z=[0.4,0.0,0.0,0.0]
• plt.pie(x,labels=y,explode=z)
• plt.show ()
• import matplotlib.pyplot as plt
• x=[1,2,3,4]
• y=["C","C++","Java","Python"]
• z=[0.4,0.0,0.0,0.0]
• var1=["r","c","g","orange"]
• plt.pie(x,labels=y,explode=z,colors=var1)
• plt.show ()
Ø Matplotlib Pie Plot-
• import matplotlib.pyplot as plt
• x=[1,2,3,4]
• y=["C","C++","Java","Python"]
• z=[0.4,0.0,0.0,0.0]
• var1=["r","c","g","orange"]
• plt.pie(x,labels=y,explode=z,colors=var1,autopct="%0.
1f%%")
Ø Matplotlib Pie Plot-
• import matplotlib.pyplot as plt
• x=[1,2,3,4]
• y=["C","C++","Java","Python"]
• z=[0.4,0.0,0.0,0.0]
• var1=["r","c","g","orange"]
• plt.pie(x,labels=y,explode=z,colors=var1,autopct="%0.
3f%%")
Ø Matplotlib Pie Plot-
• import matplotlib.pyplot as plt
• x=[1,2,3,4]
• y=["C","C++","Java","Python"]
• z=[0.4,0.0,0.0,0.0]
• plt.pie(x,labels=y,explode=z,autopct="%0.3f%%",shad
ow=True)
• plt.show ()
Ø Matplotlib Pie Plot-
• import matplotlib.pyplot as plt
• x=[1,2,3,4]
• y=["C","C++","Java","Python"]
• z=[0.4,0.0,0.0,0.0]
• plt.pie(x,labels=y,explode=z,autopct="%0.3f%%",radiu
s=1.5)
• plt.show ()
Ø Matplotlib Pie Plot-
• import matplotlib.pyplot as plt
• x=[1,2,3,4]
• y=["C","C++","Java","Python"]
• z=[0.4,0.0,0.0,0.0]
• plt.pie(x,labels=y,explode=z,autopct="%0.3f%%",label
distance=1.3)
• plt.show ()
Ø Matplotlib Pie Plot-
• import matplotlib.pyplot as plt
• x=[1,2,3,4]
• y=["C","C++","Java","Python"]
• z=[0.4,0.0,0.0,0.0]
• plt.pie(x,labels=y,explode=z,autopct="%0.3f%%",start
angle=90)
• plt.show ()
Ø Matplotlib Pie Plot-
• import matplotlib.pyplot as plt
• x=[1,2,3,4]
• y=["C","C++","Java","Python"]
• z=[0.4,0.0,0.0,0.0]
• plt.pie(x,labels=y,explode=z,autopct="%0.3f%%",textp
rops={"fontsize":15})
• plt.show ()
Ø Matplotlib Pie Plot-
• import matplotlib.pyplot as plt
• x=[1,2,3,4]
• y=["C","C++","Java","Python"]
• z=[0.4,0.0,0.0,0.0]
• plt.pie(x,labels=y,explode=z,autopct="%0.3f%%",textp
rops={"fontsize":15},counterclock=False)
• plt.show ()
Ø Matplotlib Pie Plot-
• import matplotlib.pyplot as plt
• x=[1,2,3,4]
• y=["C","C++","Java","Python"]
• z=[0.4,0.0,0.0,0.0]
• plt.pie(x,labels=y,explode=z,autopct="%0.3f%%",shad
ow=True,textprops={"fontsize":15},wedgeprops={"line
width":5})
• plt.show ()
Ø Matplotlib Pie Plot-
• import matplotlib.pyplot as plt
• x=[1,2,3,4]
• y=["C","C++","Java","Python"]
• z=[0.4,0.0,0.0,0.0]
• plt.pie(x,labels=y,explode=z,autopct="%0.3f%%",shad
ow=True,textprops={"fontsize":15},wedgeprops={"line
width":5,"edgecolor":"c"})
• plt.show ()
Ø Matplotlib Pie Plot-
• import matplotlib.pyplot as plt
• x=[1,2,3,4]
• y=["C","C++","Java","Python"]
• z=[0.4,0.0,0.0,0.0]
• plt.pie(x,labels=y,explode=z,autopct="%0.3f%%",shad
ow=True,textprops={"fontsize":15},wedgeprops={"line
width":5},rotatelabels=True)
• plt.show ()
Ø Matplotlib Pie Plot-
• import matplotlib.pyplot as plt
• x=[1,2,3,4]
• y=["C","C++","Java","Python"]
• z=[0.4,0.0,0.0,0.0]
• plt.pie(x,labels=y,explode=z,autopct="%0.3f%%",radiu
s=0.9,shadow=True,textprops={"fontsize":15},wedgep
rops={"linewidth":5},rotatelabels=True)
• plt.title("Computers and Structures")
• plt.legend(loc=1).....loc=1 to 10
• plt.show ()
Ø Matplotlib Pie Plot-
• import matplotlib.pyplot as plt
• x=[1,2,3,4]
• x1=[40,30,20,10]
• y=["C","C++","Java","Python"]
• z=[0.4,0.0,0.0,0.0]
• plt.pie(x,labels=y,radius=1.5)
• plt.pie(x1,radius=1)
• plt.show ()
Ø Matplotlib Pie Plot-
• import matplotlib.pyplot as plt
• x=[1,2,3,4]
• x1=[40,30,20,10]
• y=["C","C++","Java","Python"]
• z=[0.4,0.0,0.0,0.0]
• plt.pie(x,labels=y,radius=1.5)
• plt.pie([1],colors="w",radius=1)
• plt.show ()
Ø Matplotlib Save Figure-
• import matplotlib.pyplot as plt
x=[ ]
y=[ ]
plt.plot(x,y)
plt.savefig(“fname”, dpi=1000, facecolor= “g”,
transparent=True)
plt.savefig(fname.pdf)......save in format as per
requirement
plt.show( )
Ex-
import matplotlib.pyplot as plt
x=[1,2,3,4,5]
y=[90,65,82,85,80]
plt.plot(x,y)
plt.savefig("line")
plt.show()
Note- File gets saved in a folder location
Ø Matplotlib Work With Axes-
• import matplotlib.pyplot as plt
• x=[1,2,3,4,5]
• y=[3,2,1,3,4]
• plt.plot(x,y)
• plt.xticks(x)
• plt.yticks(x)
• plt.show ()
Ø Matplotlib Work With Axes-
• import matplotlib.pyplot as plt
• x=[1,2,3,4,5]
• y=[3,2,1,3,4]
• plt.plot(x,y)
• plt.xticks(x,labels=["Python","Java","C","C++","HTML"])
• plt.yticks(x)
• plt.show ()
Ø Matplotlib Work With Axes-
• import matplotlib.pyplot as plt
• x=[1,2,3,4,5]
• y=[3,2,1,3,4]
• plt.plot(x,y)
• plt.xlim(0,10)
• plt.show ()
Ø Matplotlib Work With Axes-
• import matplotlib.pyplot as plt
• x=[1,2,3,4,5]
• y=[3,2,1,3,4]
• plt.plot(x,y)
• plt.axis([0,10,0,7])
• plt.show ()
Ø Text in Matplotlib-
text- Add text at an arbitrary location of the axes.
annotate- Add an annotation with an optional arrow at an
arbitrary location of the axes
xlabel- Add a label to the axes’s along x-axis
ylabel- Add a label to the axes’s along y-axis
title- Add a title to the axes
Ø Text in Matplotlib-
Ex-
import matplotlib.pyplot as plt
x=[1,2,3,4,5]
y=[3,2,1,3,4]
plt.plot(x,y)
plt.text(2,3,"java",style="italic",bbox={"facecolor":"c"})
plt.annotate("python",xy=(2,1),xytext=(4,4),arrowprops=dict(facec
olor="green"))
plt.legend(["up"],loc=9,facecolor="red",edgecolor="c",framealpha
=0.5,shadow=True)
plt.show ()
text position on x and y
axis
THANK YOU....

More Related Content

Similar to Introduction to Data Visualization,Matplotlib.pdf

Data Visualization 2020_21
Data Visualization 2020_21Data Visualization 2020_21
Data Visualization 2020_21Sangita Panchal
 
Swift for tensorflow
Swift for tensorflowSwift for tensorflow
Swift for tensorflow규영 허
 
Python - Numpy/Pandas/Matplot Machine Learning Libraries
Python - Numpy/Pandas/Matplot Machine Learning LibrariesPython - Numpy/Pandas/Matplot Machine Learning Libraries
Python - Numpy/Pandas/Matplot Machine Learning LibrariesAndrew Ferlitsch
 
Matplotlib adalah pustaka plotting 2D Python yang menghasilkan gambar berkual...
Matplotlib adalah pustaka plotting 2D Python yang menghasilkan gambar berkual...Matplotlib adalah pustaka plotting 2D Python yang menghasilkan gambar berkual...
Matplotlib adalah pustaka plotting 2D Python yang menghasilkan gambar berkual...HendraPurnama31
 
Python과 node.js기반 데이터 분석 및 가시화
Python과 node.js기반 데이터 분석 및 가시화Python과 node.js기반 데이터 분석 및 가시화
Python과 node.js기반 데이터 분석 및 가시화Tae wook kang
 
Introduction to Tensorflow
Introduction to TensorflowIntroduction to Tensorflow
Introduction to TensorflowTzar Umang
 
matplotlib-installatin-interactive-contour-example-guide
matplotlib-installatin-interactive-contour-example-guidematplotlib-installatin-interactive-contour-example-guide
matplotlib-installatin-interactive-contour-example-guideArulalan T
 
Introduction to matplotlib
Introduction to matplotlibIntroduction to matplotlib
Introduction to matplotlibPiyush rai
 
python-numpyandpandas-170922144956 (1).pptx
python-numpyandpandas-170922144956 (1).pptxpython-numpyandpandas-170922144956 (1).pptx
python-numpyandpandas-170922144956 (1).pptxAkashgupta517936
 
Python for Scientists
Python for ScientistsPython for Scientists
Python for ScientistsAndreas Dewes
 
Linear Logistic regession_Practical.pptx
Linear Logistic regession_Practical.pptxLinear Logistic regession_Practical.pptx
Linear Logistic regession_Practical.pptxDr. Amanpreet Kaur
 
Python seaborn cheat_sheet
Python seaborn cheat_sheetPython seaborn cheat_sheet
Python seaborn cheat_sheetNishant Upadhyay
 
The TensorFlow dance craze
The TensorFlow dance crazeThe TensorFlow dance craze
The TensorFlow dance crazeGabriel Hamilton
 

Similar to Introduction to Data Visualization,Matplotlib.pdf (20)

Data Visualization 2020_21
Data Visualization 2020_21Data Visualization 2020_21
Data Visualization 2020_21
 
Swift for tensorflow
Swift for tensorflowSwift for tensorflow
Swift for tensorflow
 
Python - Numpy/Pandas/Matplot Machine Learning Libraries
Python - Numpy/Pandas/Matplot Machine Learning LibrariesPython - Numpy/Pandas/Matplot Machine Learning Libraries
Python - Numpy/Pandas/Matplot Machine Learning Libraries
 
Matplotlib adalah pustaka plotting 2D Python yang menghasilkan gambar berkual...
Matplotlib adalah pustaka plotting 2D Python yang menghasilkan gambar berkual...Matplotlib adalah pustaka plotting 2D Python yang menghasilkan gambar berkual...
Matplotlib adalah pustaka plotting 2D Python yang menghasilkan gambar berkual...
 
12-IP.pdf
12-IP.pdf12-IP.pdf
12-IP.pdf
 
Python과 node.js기반 데이터 분석 및 가시화
Python과 node.js기반 데이터 분석 및 가시화Python과 node.js기반 데이터 분석 및 가시화
Python과 node.js기반 데이터 분석 및 가시화
 
Introduction to Tensorflow
Introduction to TensorflowIntroduction to Tensorflow
Introduction to Tensorflow
 
matplotlib-installatin-interactive-contour-example-guide
matplotlib-installatin-interactive-contour-example-guidematplotlib-installatin-interactive-contour-example-guide
matplotlib-installatin-interactive-contour-example-guide
 
Chaco Step-by-Step
Chaco Step-by-StepChaco Step-by-Step
Chaco Step-by-Step
 
Introduction to matplotlib
Introduction to matplotlibIntroduction to matplotlib
Introduction to matplotlib
 
NUMPY
NUMPY NUMPY
NUMPY
 
python-numpyandpandas-170922144956 (1).pptx
python-numpyandpandas-170922144956 (1).pptxpython-numpyandpandas-170922144956 (1).pptx
python-numpyandpandas-170922144956 (1).pptx
 
Python for Scientists
Python for ScientistsPython for Scientists
Python for Scientists
 
Matplotlib
MatplotlibMatplotlib
Matplotlib
 
Foliumcheatsheet
FoliumcheatsheetFoliumcheatsheet
Foliumcheatsheet
 
Linear Logistic regession_Practical.pptx
Linear Logistic regession_Practical.pptxLinear Logistic regession_Practical.pptx
Linear Logistic regession_Practical.pptx
 
Python seaborn cheat_sheet
Python seaborn cheat_sheetPython seaborn cheat_sheet
Python seaborn cheat_sheet
 
The TensorFlow dance craze
The TensorFlow dance crazeThe TensorFlow dance craze
The TensorFlow dance craze
 
Lec2
Lec2Lec2
Lec2
 
SVGo workshop
SVGo workshopSVGo workshop
SVGo workshop
 

More from sumitt6_25730773

Introduction to Numpy, NumPy Arrays.pdf
Introduction to Numpy, NumPy  Arrays.pdfIntroduction to Numpy, NumPy  Arrays.pdf
Introduction to Numpy, NumPy Arrays.pdfsumitt6_25730773
 
Formwork Supports, Scaffolds and Failure.pdf
Formwork Supports, Scaffolds and Failure.pdfFormwork Supports, Scaffolds and Failure.pdf
Formwork Supports, Scaffolds and Failure.pdfsumitt6_25730773
 
Formwork Design-Introduction.pdf
Formwork Design-Introduction.pdfFormwork Design-Introduction.pdf
Formwork Design-Introduction.pdfsumitt6_25730773
 
Bending stresses and shear stresses
Bending stresses and shear stressesBending stresses and shear stresses
Bending stresses and shear stressessumitt6_25730773
 
Shear Force and Bending Moment Diagram
Shear Force and Bending Moment DiagramShear Force and Bending Moment Diagram
Shear Force and Bending Moment Diagramsumitt6_25730773
 

More from sumitt6_25730773 (8)

Introduction to Numpy, NumPy Arrays.pdf
Introduction to Numpy, NumPy  Arrays.pdfIntroduction to Numpy, NumPy  Arrays.pdf
Introduction to Numpy, NumPy Arrays.pdf
 
Formwork Supports, Scaffolds and Failure.pdf
Formwork Supports, Scaffolds and Failure.pdfFormwork Supports, Scaffolds and Failure.pdf
Formwork Supports, Scaffolds and Failure.pdf
 
Formwork Design-Introduction.pdf
Formwork Design-Introduction.pdfFormwork Design-Introduction.pdf
Formwork Design-Introduction.pdf
 
Bending stresses and shear stresses
Bending stresses and shear stressesBending stresses and shear stresses
Bending stresses and shear stresses
 
Shear Force and Bending Moment Diagram
Shear Force and Bending Moment DiagramShear Force and Bending Moment Diagram
Shear Force and Bending Moment Diagram
 
Flow Through Pipe
Flow Through PipeFlow Through Pipe
Flow Through Pipe
 
Concept of Boundary Layer
Concept of Boundary LayerConcept of Boundary Layer
Concept of Boundary Layer
 
Flow through pipes
Flow through pipesFlow through pipes
Flow through pipes
 

Recently uploaded

5G and 6G refer to generations of mobile network technology, each representin...
5G and 6G refer to generations of mobile network technology, each representin...5G and 6G refer to generations of mobile network technology, each representin...
5G and 6G refer to generations of mobile network technology, each representin...archanaece3
 
analog-vs-digital-communication (concept of analog and digital).pptx
analog-vs-digital-communication (concept of analog and digital).pptxanalog-vs-digital-communication (concept of analog and digital).pptx
analog-vs-digital-communication (concept of analog and digital).pptxKarpagam Institute of Teechnology
 
UNIT 4 PTRP final Convergence in probability.pptx
UNIT 4 PTRP final Convergence in probability.pptxUNIT 4 PTRP final Convergence in probability.pptx
UNIT 4 PTRP final Convergence in probability.pptxkalpana413121
 
Theory of Time 2024 (Universal Theory for Everything)
Theory of Time 2024 (Universal Theory for Everything)Theory of Time 2024 (Universal Theory for Everything)
Theory of Time 2024 (Universal Theory for Everything)Ramkumar k
 
Working Principle of Echo Sounder and Doppler Effect.pdf
Working Principle of Echo Sounder and Doppler Effect.pdfWorking Principle of Echo Sounder and Doppler Effect.pdf
Working Principle of Echo Sounder and Doppler Effect.pdfSkNahidulIslamShrabo
 
Danikor Product Catalog- Screw Feeder.pdf
Danikor Product Catalog- Screw Feeder.pdfDanikor Product Catalog- Screw Feeder.pdf
Danikor Product Catalog- Screw Feeder.pdfthietkevietthinh
 
Dynamo Scripts for Task IDs and Space Naming.pptx
Dynamo Scripts for Task IDs and Space Naming.pptxDynamo Scripts for Task IDs and Space Naming.pptx
Dynamo Scripts for Task IDs and Space Naming.pptxMustafa Ahmed
 
engineering chemistry power point presentation
engineering chemistry  power point presentationengineering chemistry  power point presentation
engineering chemistry power point presentationsj9399037128
 
Study of Computer Hardware System using Block Diagram
Study of Computer Hardware System using Block DiagramStudy of Computer Hardware System using Block Diagram
Study of Computer Hardware System using Block DiagramChandrakantDivate1
 
HOA1&2 - Module 3 - PREHISTORCI ARCHITECTURE OF KERALA.pptx
HOA1&2 - Module 3 - PREHISTORCI ARCHITECTURE OF KERALA.pptxHOA1&2 - Module 3 - PREHISTORCI ARCHITECTURE OF KERALA.pptx
HOA1&2 - Module 3 - PREHISTORCI ARCHITECTURE OF KERALA.pptxSCMS School of Architecture
 
NEWLETTER FRANCE HELICES/ SDS SURFACE DRIVES - MAY 2024
NEWLETTER FRANCE HELICES/ SDS SURFACE DRIVES - MAY 2024NEWLETTER FRANCE HELICES/ SDS SURFACE DRIVES - MAY 2024
NEWLETTER FRANCE HELICES/ SDS SURFACE DRIVES - MAY 2024EMMANUELLEFRANCEHELI
 
History of Indian Railways - the story of Growth & Modernization
History of Indian Railways - the story of Growth & ModernizationHistory of Indian Railways - the story of Growth & Modernization
History of Indian Railways - the story of Growth & ModernizationEmaan Sharma
 
Degrees of freedom for the robots 1.pptx
Degrees of freedom for the robots 1.pptxDegrees of freedom for the robots 1.pptx
Degrees of freedom for the robots 1.pptxMostafa Mahmoud
 
Path loss model, OKUMURA Model, Hata Model
Path loss model, OKUMURA Model, Hata ModelPath loss model, OKUMURA Model, Hata Model
Path loss model, OKUMURA Model, Hata ModelDrAjayKumarYadav4
 
Scouring of cotton and wool fabric with effective scouring method
Scouring of cotton and wool fabric with effective scouring methodScouring of cotton and wool fabric with effective scouring method
Scouring of cotton and wool fabric with effective scouring methodvimal412355
 
Introduction-to- Metrology and Quality.pptx
Introduction-to- Metrology and Quality.pptxIntroduction-to- Metrology and Quality.pptx
Introduction-to- Metrology and Quality.pptxProfASKolap
 
Computer Graphics - Windowing and Clipping
Computer Graphics - Windowing and ClippingComputer Graphics - Windowing and Clipping
Computer Graphics - Windowing and ClippingChandrakantDivate1
 
Max. shear stress theory-Maximum Shear Stress Theory ​ Maximum Distortional ...
Max. shear stress theory-Maximum Shear Stress Theory ​  Maximum Distortional ...Max. shear stress theory-Maximum Shear Stress Theory ​  Maximum Distortional ...
Max. shear stress theory-Maximum Shear Stress Theory ​ Maximum Distortional ...ronahami
 
Autodesk Construction Cloud (Autodesk Build).pptx
Autodesk Construction Cloud (Autodesk Build).pptxAutodesk Construction Cloud (Autodesk Build).pptx
Autodesk Construction Cloud (Autodesk Build).pptxMustafa Ahmed
 

Recently uploaded (20)

5G and 6G refer to generations of mobile network technology, each representin...
5G and 6G refer to generations of mobile network technology, each representin...5G and 6G refer to generations of mobile network technology, each representin...
5G and 6G refer to generations of mobile network technology, each representin...
 
analog-vs-digital-communication (concept of analog and digital).pptx
analog-vs-digital-communication (concept of analog and digital).pptxanalog-vs-digital-communication (concept of analog and digital).pptx
analog-vs-digital-communication (concept of analog and digital).pptx
 
UNIT 4 PTRP final Convergence in probability.pptx
UNIT 4 PTRP final Convergence in probability.pptxUNIT 4 PTRP final Convergence in probability.pptx
UNIT 4 PTRP final Convergence in probability.pptx
 
Theory of Time 2024 (Universal Theory for Everything)
Theory of Time 2024 (Universal Theory for Everything)Theory of Time 2024 (Universal Theory for Everything)
Theory of Time 2024 (Universal Theory for Everything)
 
Working Principle of Echo Sounder and Doppler Effect.pdf
Working Principle of Echo Sounder and Doppler Effect.pdfWorking Principle of Echo Sounder and Doppler Effect.pdf
Working Principle of Echo Sounder and Doppler Effect.pdf
 
Danikor Product Catalog- Screw Feeder.pdf
Danikor Product Catalog- Screw Feeder.pdfDanikor Product Catalog- Screw Feeder.pdf
Danikor Product Catalog- Screw Feeder.pdf
 
Dynamo Scripts for Task IDs and Space Naming.pptx
Dynamo Scripts for Task IDs and Space Naming.pptxDynamo Scripts for Task IDs and Space Naming.pptx
Dynamo Scripts for Task IDs and Space Naming.pptx
 
engineering chemistry power point presentation
engineering chemistry  power point presentationengineering chemistry  power point presentation
engineering chemistry power point presentation
 
Study of Computer Hardware System using Block Diagram
Study of Computer Hardware System using Block DiagramStudy of Computer Hardware System using Block Diagram
Study of Computer Hardware System using Block Diagram
 
HOA1&2 - Module 3 - PREHISTORCI ARCHITECTURE OF KERALA.pptx
HOA1&2 - Module 3 - PREHISTORCI ARCHITECTURE OF KERALA.pptxHOA1&2 - Module 3 - PREHISTORCI ARCHITECTURE OF KERALA.pptx
HOA1&2 - Module 3 - PREHISTORCI ARCHITECTURE OF KERALA.pptx
 
NEWLETTER FRANCE HELICES/ SDS SURFACE DRIVES - MAY 2024
NEWLETTER FRANCE HELICES/ SDS SURFACE DRIVES - MAY 2024NEWLETTER FRANCE HELICES/ SDS SURFACE DRIVES - MAY 2024
NEWLETTER FRANCE HELICES/ SDS SURFACE DRIVES - MAY 2024
 
History of Indian Railways - the story of Growth & Modernization
History of Indian Railways - the story of Growth & ModernizationHistory of Indian Railways - the story of Growth & Modernization
History of Indian Railways - the story of Growth & Modernization
 
Degrees of freedom for the robots 1.pptx
Degrees of freedom for the robots 1.pptxDegrees of freedom for the robots 1.pptx
Degrees of freedom for the robots 1.pptx
 
Path loss model, OKUMURA Model, Hata Model
Path loss model, OKUMURA Model, Hata ModelPath loss model, OKUMURA Model, Hata Model
Path loss model, OKUMURA Model, Hata Model
 
Scouring of cotton and wool fabric with effective scouring method
Scouring of cotton and wool fabric with effective scouring methodScouring of cotton and wool fabric with effective scouring method
Scouring of cotton and wool fabric with effective scouring method
 
Introduction-to- Metrology and Quality.pptx
Introduction-to- Metrology and Quality.pptxIntroduction-to- Metrology and Quality.pptx
Introduction-to- Metrology and Quality.pptx
 
Signal Processing and Linear System Analysis
Signal Processing and Linear System AnalysisSignal Processing and Linear System Analysis
Signal Processing and Linear System Analysis
 
Computer Graphics - Windowing and Clipping
Computer Graphics - Windowing and ClippingComputer Graphics - Windowing and Clipping
Computer Graphics - Windowing and Clipping
 
Max. shear stress theory-Maximum Shear Stress Theory ​ Maximum Distortional ...
Max. shear stress theory-Maximum Shear Stress Theory ​  Maximum Distortional ...Max. shear stress theory-Maximum Shear Stress Theory ​  Maximum Distortional ...
Max. shear stress theory-Maximum Shear Stress Theory ​ Maximum Distortional ...
 
Autodesk Construction Cloud (Autodesk Build).pptx
Autodesk Construction Cloud (Autodesk Build).pptxAutodesk Construction Cloud (Autodesk Build).pptx
Autodesk Construction Cloud (Autodesk Build).pptx
 

Introduction to Data Visualization,Matplotlib.pdf

  • 1. Sanjivani Rural Education Society's Sanjivani College of Engineering, Kopargaon 423603. -Department of Strucutral Engineering- By Mr. Sumit S. Kolapkar (Assistant Professor) Mail Id- kolapkarsumitst@sanjivani.org.in
  • 2. Ø Why data visualization in Python- • Is a quick and easy way to convey the concepts in a universal manner. Ø What is data visualization- • Is a graphical way of representing information and data. Ø Types of data visualization in Python- • Plotting Libraries- • Matplotlib- • Pandas Visualization- • Seaborn- • ggplot- • Plotly-
  • 3. Ø What is Matplotlib- • Is a plotting library for Python and it is numerical mathematical extension of Numpy • Is 2D and 3D plotting Python library • It was introduced by John Hunter in the year 2002 Ø Matplotlib graphs-
  • 4. Ø Importing Matplotlib in Python- • import matplotlib.pyplot as plt OR • from matplotlib import pyplot as plt Example- import matplotlib.pyplot as plt x=[1,2,3,4,5] y=[6,7,8,9,10] plt.plot(x,y) plt.show () Example- import matplotlib.pyplot as plt x=[1,2,3,4,5] y=[6,7,8,9,10] plt.bar(x,y) plt.show ()
  • 5. Ø Importing Matplotlib in Python- Example- import matplotlib.pyplot as plt x=[1,2,3,4,5] y=[6,7,8,9,10] Z=['b','g','r','black','pink'] plt.bar(x,y,color=Z) plt.show () Base Color-
  • 7. Ø Matplotlib Bar Plot- • import matplotlib.pyplot as plt x = ['Python','C','C++', 'Java'] y = [90,65,82,85] plt.bar(x,y) plt.show ()
  • 8. Ø Matplotlib Bar Plot- • import matplotlib.pyplot as plt x=[ ] y=[ ] z=[ ] plt.bar(x,y, width=0.4, color=“y”, align= “edge” (or center), edgecolor=“r”, linewidth=10, linestyle=“:”, alpha=0.4, label=“Popularity”) plt.bar(x,z, width=0.4, color=“g”, align=edge, edgecolor=“r”, linewidth=10, linestyle=“:”, alpha=0.4, label=“Popularity1”)...for multiple bar graphs plt.legend() plt.show( ) plt.xlabel (“languages”, fontsize=10) plt.ylabel(“No.” ”, font size=10) plt.title(“Graph1” ”, font size=10) Note- To apply the label we must apply for legend.
  • 9. Ø Matplotlib Bar Plot- • import matplotlib.pyplot as plt x=[ ] y=[ ] z=[ ] plt.bar(x,y, width=0.4, color=“y”,label=“Popularity”) plt.bar(x,z, width=0.4, color=“g”, label=“Popularity1”)...for multiple bar graphs.....overlapped plt.legend() plt.show( ) plt.xlabel (“languages”, fontsize=10) plt.ylabel(“No.” ”, font size=10) plt.title(“Graph1” ”, font size=10) Note- To apply the label we must apply for legend.
  • 10. Ø Matplotlib Bar Plot- Side by Side Graph • import matplotlib.pyplot as plt • import numpy as np x=[ “python”, “c”, “c++”, “java”] y=[80,70,60,82 ] z=[ 20,30,40,50] p = [0,1,2,3].....indexing of x OR p = np.arange(len(x))...by importing numpy also we can create an array of indexing width = 0.4 plt.bar(p,y, width, color=“y”,label=“Popularity”)....x replaced with ‘p’ plt.bar(p,z, width, color=“g”, label=“Popularity1”)....x replaced with ‘p’ plt.legend() plt.show( ) plt.xlabel (“languages”, fontsize=10) plt.ylabel(“No.” ”, font size=10) plt.title(“Graph1” ”, font size=10) Note- To apply the label we must apply for legend. gives number at x-axis and is over lapped
  • 11. Ø Matplotlib Bar Plot- Side by Side Graph • import matplotlib.pyplot as plt • import numpy as np x=[ “python”, “c”, “c++”, “java”] y=[80,70,60,82 ] z=[ 20,30,40,50] width = 0.4 p = np.arange(len(x)) p1=[ j+width for j in p]...will create another graph of same width on side plt.bar(p,y, width, color=“y”,label=“Popularity”)....x replaced with ‘p’ plt.bar(p1,z, width, color=“g”, label=“Popularity1”)....x replaced with ‘p’ plt.legend() plt.show( ) plt.xlabel (“languages”, fontsize=10) plt.ylabel(“No.” ”, font size=10) plt.title(“Graph1” ”, font size=10) Note- To apply the label we must apply for legend. gives number at x-axis
  • 12. Ø Matplotlib Bar Plot- Side by Side Graph • import matplotlib.pyplot as plt • import numpy as np x=[ “python”, “c”, “c++”, “java”] y=[80,70,60,82 ] z=[ 20,30,40,50] width = 0.4 p = np.arange(len(x)) p1=[ j+width for j in p]...will create another graph of same width on side plt.bar(p,y, width, color=“y”,label=“Popularity”)....x replaced with ‘p’ plt.bar(p1,z, width, color=“g”, label=“Popularity1”)....x replaced with ‘p’ plt.xticks(p+width,x)......to show name at x-axisand at right hand side plt.legend() plt.show( ) plt.xlabel (“languages”, fontsize=10) plt.ylabel(“No.” ”, font size=10) plt.title(“Graph1” ”, font size=10) Note- To apply the label we must apply for legend. gives name at RHS
  • 13. Ø Matplotlib Bar Plot- Side by Side Graph • import matplotlib.pyplot as plt • import numpy as np x=[ “python”, “c”, “c++”, “java”] y=[80,70,60,82 ] z=[ 20,30,40,50] width = 0.4 p = np.arange(len(x)) p1=[ j+width for j in p]...will create another graph of same width on side plt.bar(p,y, width, color=“y”,label=“Popularity”)....x replaced with ‘p’ plt.bar(p1,z, width, color=“g”, label=“Popularity1”)....x replaced with ‘p’ plt.xticks(p+width/2,x,rotation=10)......to show name at x-axis and at center plt.legend() plt.show( ) plt.xlabel (“languages”, fontsize=10) plt.ylabel(“No.” ”, font size=10) plt.title(“Graph1” ”, font size=10) Note- To apply the label we must apply for legend. gives name in rotation
  • 14. Ø Matplotlib Bar Plot- Horizontal Graph • import matplotlib.pyplot as plt • import numpy as np • x=['Python','C','C++', 'Java'] • y=[90,65,82,85] • z=[23,52,29,20] • width = 0.8 • p=np.arange(len(x)) • p1=[j+width for j in p] • plt.barh(p,y, width, color='r') • plt.bar(p1,z, width, color='k') • plt.xticks(p+width/2,x,rotation=50) • plt.show ()
  • 15. Ø Matplotlib Step Plot- • import matplotlib.pyplot as plt x=[ ] y=[ ] plt.step(x,y,marker= “o”, color= “r”, ms=10, mfc= “g”) plt.legend() plt.grid() plt.show( ) plt.xlabel (“languages”, font size=10) plt.ylabel(“No.” ”, font size=10) plt.title(“Graph1” ”, font size=10) Note-To align the bars on the right edge pass a negative width and align='edge'
  • 16. Ø Matplotlib Pie Plot- • import matplotlib.pyplot as plt • x=[1,2,3,4] • y=["C","C++","Java","Python"] • plt.pie(x) • plt.show () • import matplotlib.pyplot as plt • x=[1,2,3,4] • y=["C","C++","Java","Python"] • plt.pie(x,labels=y) • plt.show ()
  • 17. Ø Matplotlib Pie Plot- • import matplotlib.pyplot as plt • x=[1,2,3,4] • y=["C","C++","Java","Python"] • z=[0.4,0.0,0.0,0.0] • plt.pie(x,labels=y,explode=z) • plt.show () • import matplotlib.pyplot as plt • x=[1,2,3,4] • y=["C","C++","Java","Python"] • z=[0.4,0.0,0.0,0.0] • var1=["r","c","g","orange"] • plt.pie(x,labels=y,explode=z,colors=var1) • plt.show ()
  • 18. Ø Matplotlib Pie Plot- • import matplotlib.pyplot as plt • x=[1,2,3,4] • y=["C","C++","Java","Python"] • z=[0.4,0.0,0.0,0.0] • var1=["r","c","g","orange"] • plt.pie(x,labels=y,explode=z,colors=var1,autopct="%0. 1f%%")
  • 19. Ø Matplotlib Pie Plot- • import matplotlib.pyplot as plt • x=[1,2,3,4] • y=["C","C++","Java","Python"] • z=[0.4,0.0,0.0,0.0] • var1=["r","c","g","orange"] • plt.pie(x,labels=y,explode=z,colors=var1,autopct="%0. 3f%%")
  • 20. Ø Matplotlib Pie Plot- • import matplotlib.pyplot as plt • x=[1,2,3,4] • y=["C","C++","Java","Python"] • z=[0.4,0.0,0.0,0.0] • plt.pie(x,labels=y,explode=z,autopct="%0.3f%%",shad ow=True) • plt.show ()
  • 21. Ø Matplotlib Pie Plot- • import matplotlib.pyplot as plt • x=[1,2,3,4] • y=["C","C++","Java","Python"] • z=[0.4,0.0,0.0,0.0] • plt.pie(x,labels=y,explode=z,autopct="%0.3f%%",radiu s=1.5) • plt.show ()
  • 22. Ø Matplotlib Pie Plot- • import matplotlib.pyplot as plt • x=[1,2,3,4] • y=["C","C++","Java","Python"] • z=[0.4,0.0,0.0,0.0] • plt.pie(x,labels=y,explode=z,autopct="%0.3f%%",label distance=1.3) • plt.show ()
  • 23. Ø Matplotlib Pie Plot- • import matplotlib.pyplot as plt • x=[1,2,3,4] • y=["C","C++","Java","Python"] • z=[0.4,0.0,0.0,0.0] • plt.pie(x,labels=y,explode=z,autopct="%0.3f%%",start angle=90) • plt.show ()
  • 24. Ø Matplotlib Pie Plot- • import matplotlib.pyplot as plt • x=[1,2,3,4] • y=["C","C++","Java","Python"] • z=[0.4,0.0,0.0,0.0] • plt.pie(x,labels=y,explode=z,autopct="%0.3f%%",textp rops={"fontsize":15}) • plt.show ()
  • 25. Ø Matplotlib Pie Plot- • import matplotlib.pyplot as plt • x=[1,2,3,4] • y=["C","C++","Java","Python"] • z=[0.4,0.0,0.0,0.0] • plt.pie(x,labels=y,explode=z,autopct="%0.3f%%",textp rops={"fontsize":15},counterclock=False) • plt.show ()
  • 26. Ø Matplotlib Pie Plot- • import matplotlib.pyplot as plt • x=[1,2,3,4] • y=["C","C++","Java","Python"] • z=[0.4,0.0,0.0,0.0] • plt.pie(x,labels=y,explode=z,autopct="%0.3f%%",shad ow=True,textprops={"fontsize":15},wedgeprops={"line width":5}) • plt.show ()
  • 27. Ø Matplotlib Pie Plot- • import matplotlib.pyplot as plt • x=[1,2,3,4] • y=["C","C++","Java","Python"] • z=[0.4,0.0,0.0,0.0] • plt.pie(x,labels=y,explode=z,autopct="%0.3f%%",shad ow=True,textprops={"fontsize":15},wedgeprops={"line width":5,"edgecolor":"c"}) • plt.show ()
  • 28. Ø Matplotlib Pie Plot- • import matplotlib.pyplot as plt • x=[1,2,3,4] • y=["C","C++","Java","Python"] • z=[0.4,0.0,0.0,0.0] • plt.pie(x,labels=y,explode=z,autopct="%0.3f%%",shad ow=True,textprops={"fontsize":15},wedgeprops={"line width":5},rotatelabels=True) • plt.show ()
  • 29. Ø Matplotlib Pie Plot- • import matplotlib.pyplot as plt • x=[1,2,3,4] • y=["C","C++","Java","Python"] • z=[0.4,0.0,0.0,0.0] • plt.pie(x,labels=y,explode=z,autopct="%0.3f%%",radiu s=0.9,shadow=True,textprops={"fontsize":15},wedgep rops={"linewidth":5},rotatelabels=True) • plt.title("Computers and Structures") • plt.show ()
  • 30. Ø Matplotlib Pie Plot- • import matplotlib.pyplot as plt • x=[1,2,3,4] • y=["C","C++","Java","Python"] • z=[0.4,0.0,0.0,0.0] • plt.pie(x,labels=y,explode=z,autopct="%0.3f%%",radiu s=0.9,shadow=True,textprops={"fontsize":15},wedgep rops={"linewidth":5},rotatelabels=True) • plt.title("Computers and Structures") • plt.legend(loc=1).....loc=1 to 10 • plt.show ()
  • 31. Ø Matplotlib Pie Plot- • import matplotlib.pyplot as plt • x=[1,2,3,4] • x1=[40,30,20,10] • y=["C","C++","Java","Python"] • z=[0.4,0.0,0.0,0.0] • plt.pie(x,labels=y,radius=1.5) • plt.pie(x1,radius=1) • plt.show ()
  • 32. Ø Matplotlib Pie Plot- • import matplotlib.pyplot as plt • x=[1,2,3,4] • x1=[40,30,20,10] • y=["C","C++","Java","Python"] • z=[0.4,0.0,0.0,0.0] • plt.pie(x,labels=y,radius=1.5) • plt.pie([1],colors="w",radius=1) • plt.show ()
  • 33. Ø Matplotlib Save Figure- • import matplotlib.pyplot as plt x=[ ] y=[ ] plt.plot(x,y) plt.savefig(“fname”, dpi=1000, facecolor= “g”, transparent=True) plt.savefig(fname.pdf)......save in format as per requirement plt.show( ) Ex- import matplotlib.pyplot as plt x=[1,2,3,4,5] y=[90,65,82,85,80] plt.plot(x,y) plt.savefig("line") plt.show() Note- File gets saved in a folder location
  • 34. Ø Matplotlib Work With Axes- • import matplotlib.pyplot as plt • x=[1,2,3,4,5] • y=[3,2,1,3,4] • plt.plot(x,y) • plt.xticks(x) • plt.yticks(x) • plt.show ()
  • 35. Ø Matplotlib Work With Axes- • import matplotlib.pyplot as plt • x=[1,2,3,4,5] • y=[3,2,1,3,4] • plt.plot(x,y) • plt.xticks(x,labels=["Python","Java","C","C++","HTML"]) • plt.yticks(x) • plt.show ()
  • 36. Ø Matplotlib Work With Axes- • import matplotlib.pyplot as plt • x=[1,2,3,4,5] • y=[3,2,1,3,4] • plt.plot(x,y) • plt.xlim(0,10) • plt.show ()
  • 37. Ø Matplotlib Work With Axes- • import matplotlib.pyplot as plt • x=[1,2,3,4,5] • y=[3,2,1,3,4] • plt.plot(x,y) • plt.axis([0,10,0,7]) • plt.show ()
  • 38. Ø Text in Matplotlib- text- Add text at an arbitrary location of the axes. annotate- Add an annotation with an optional arrow at an arbitrary location of the axes xlabel- Add a label to the axes’s along x-axis ylabel- Add a label to the axes’s along y-axis title- Add a title to the axes
  • 39. Ø Text in Matplotlib- Ex- import matplotlib.pyplot as plt x=[1,2,3,4,5] y=[3,2,1,3,4] plt.plot(x,y) plt.text(2,3,"java",style="italic",bbox={"facecolor":"c"}) plt.annotate("python",xy=(2,1),xytext=(4,4),arrowprops=dict(facec olor="green")) plt.legend(["up"],loc=9,facecolor="red",edgecolor="c",framealpha =0.5,shadow=True) plt.show () text position on x and y axis