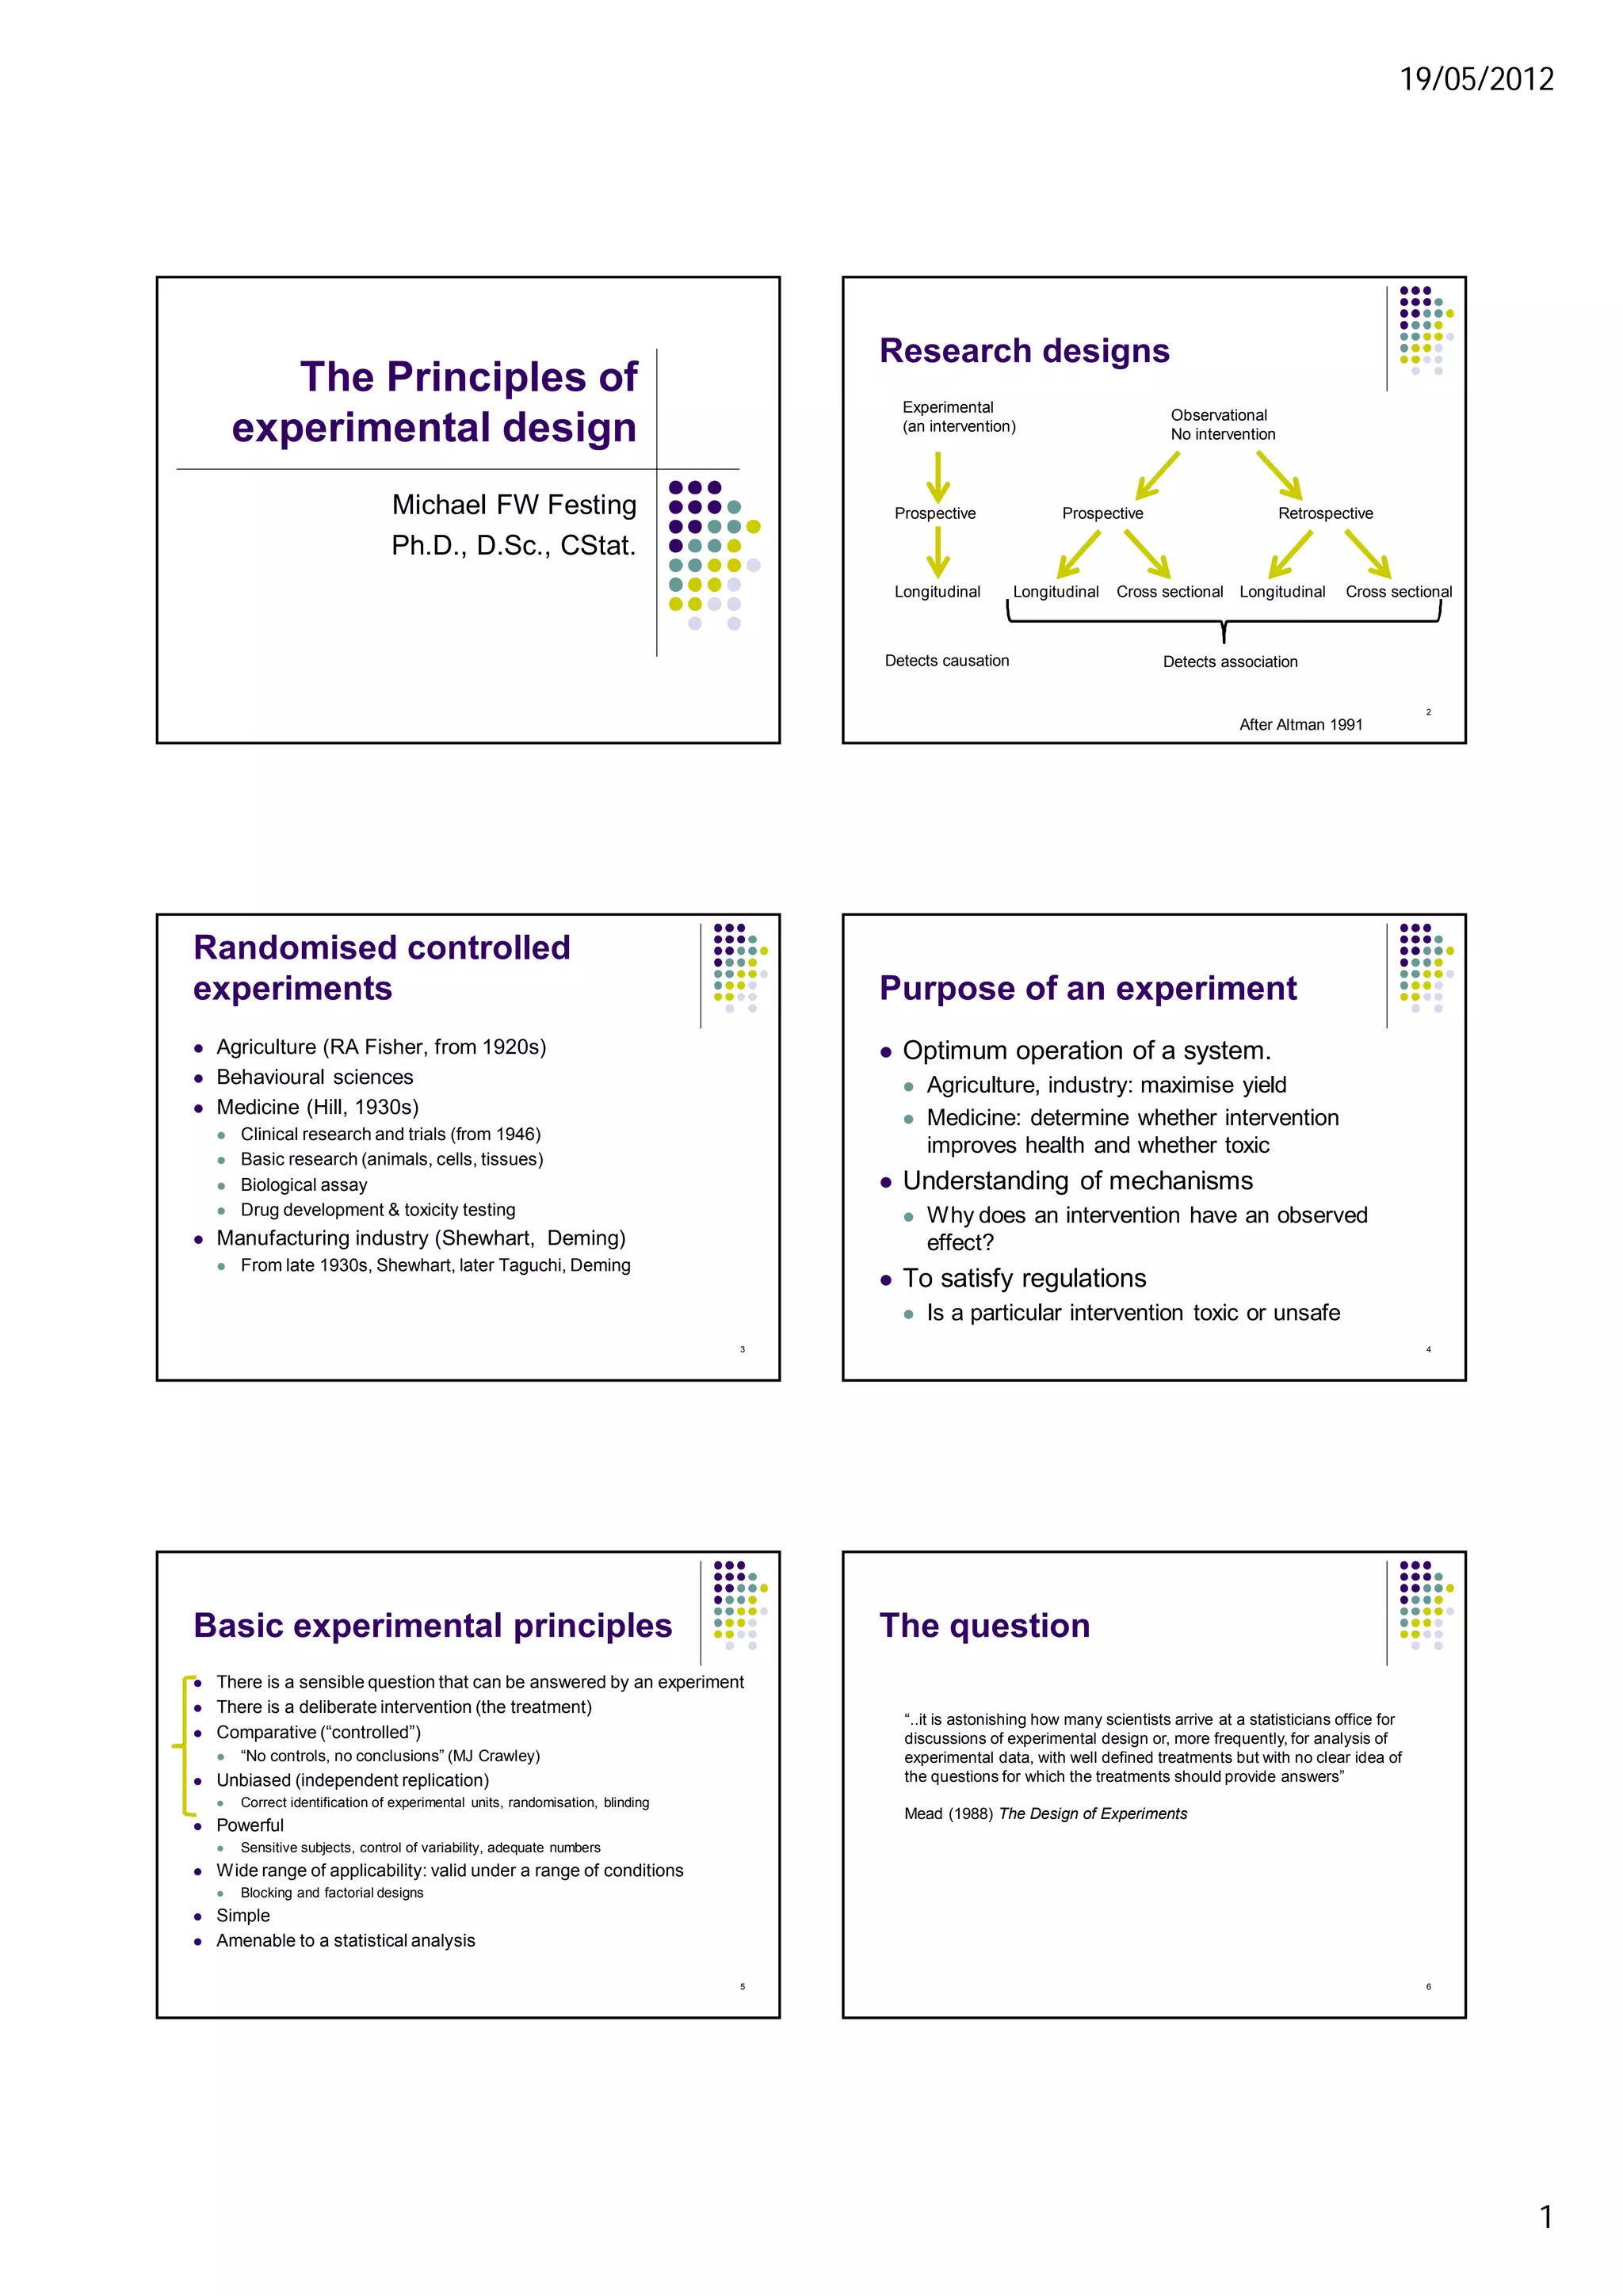
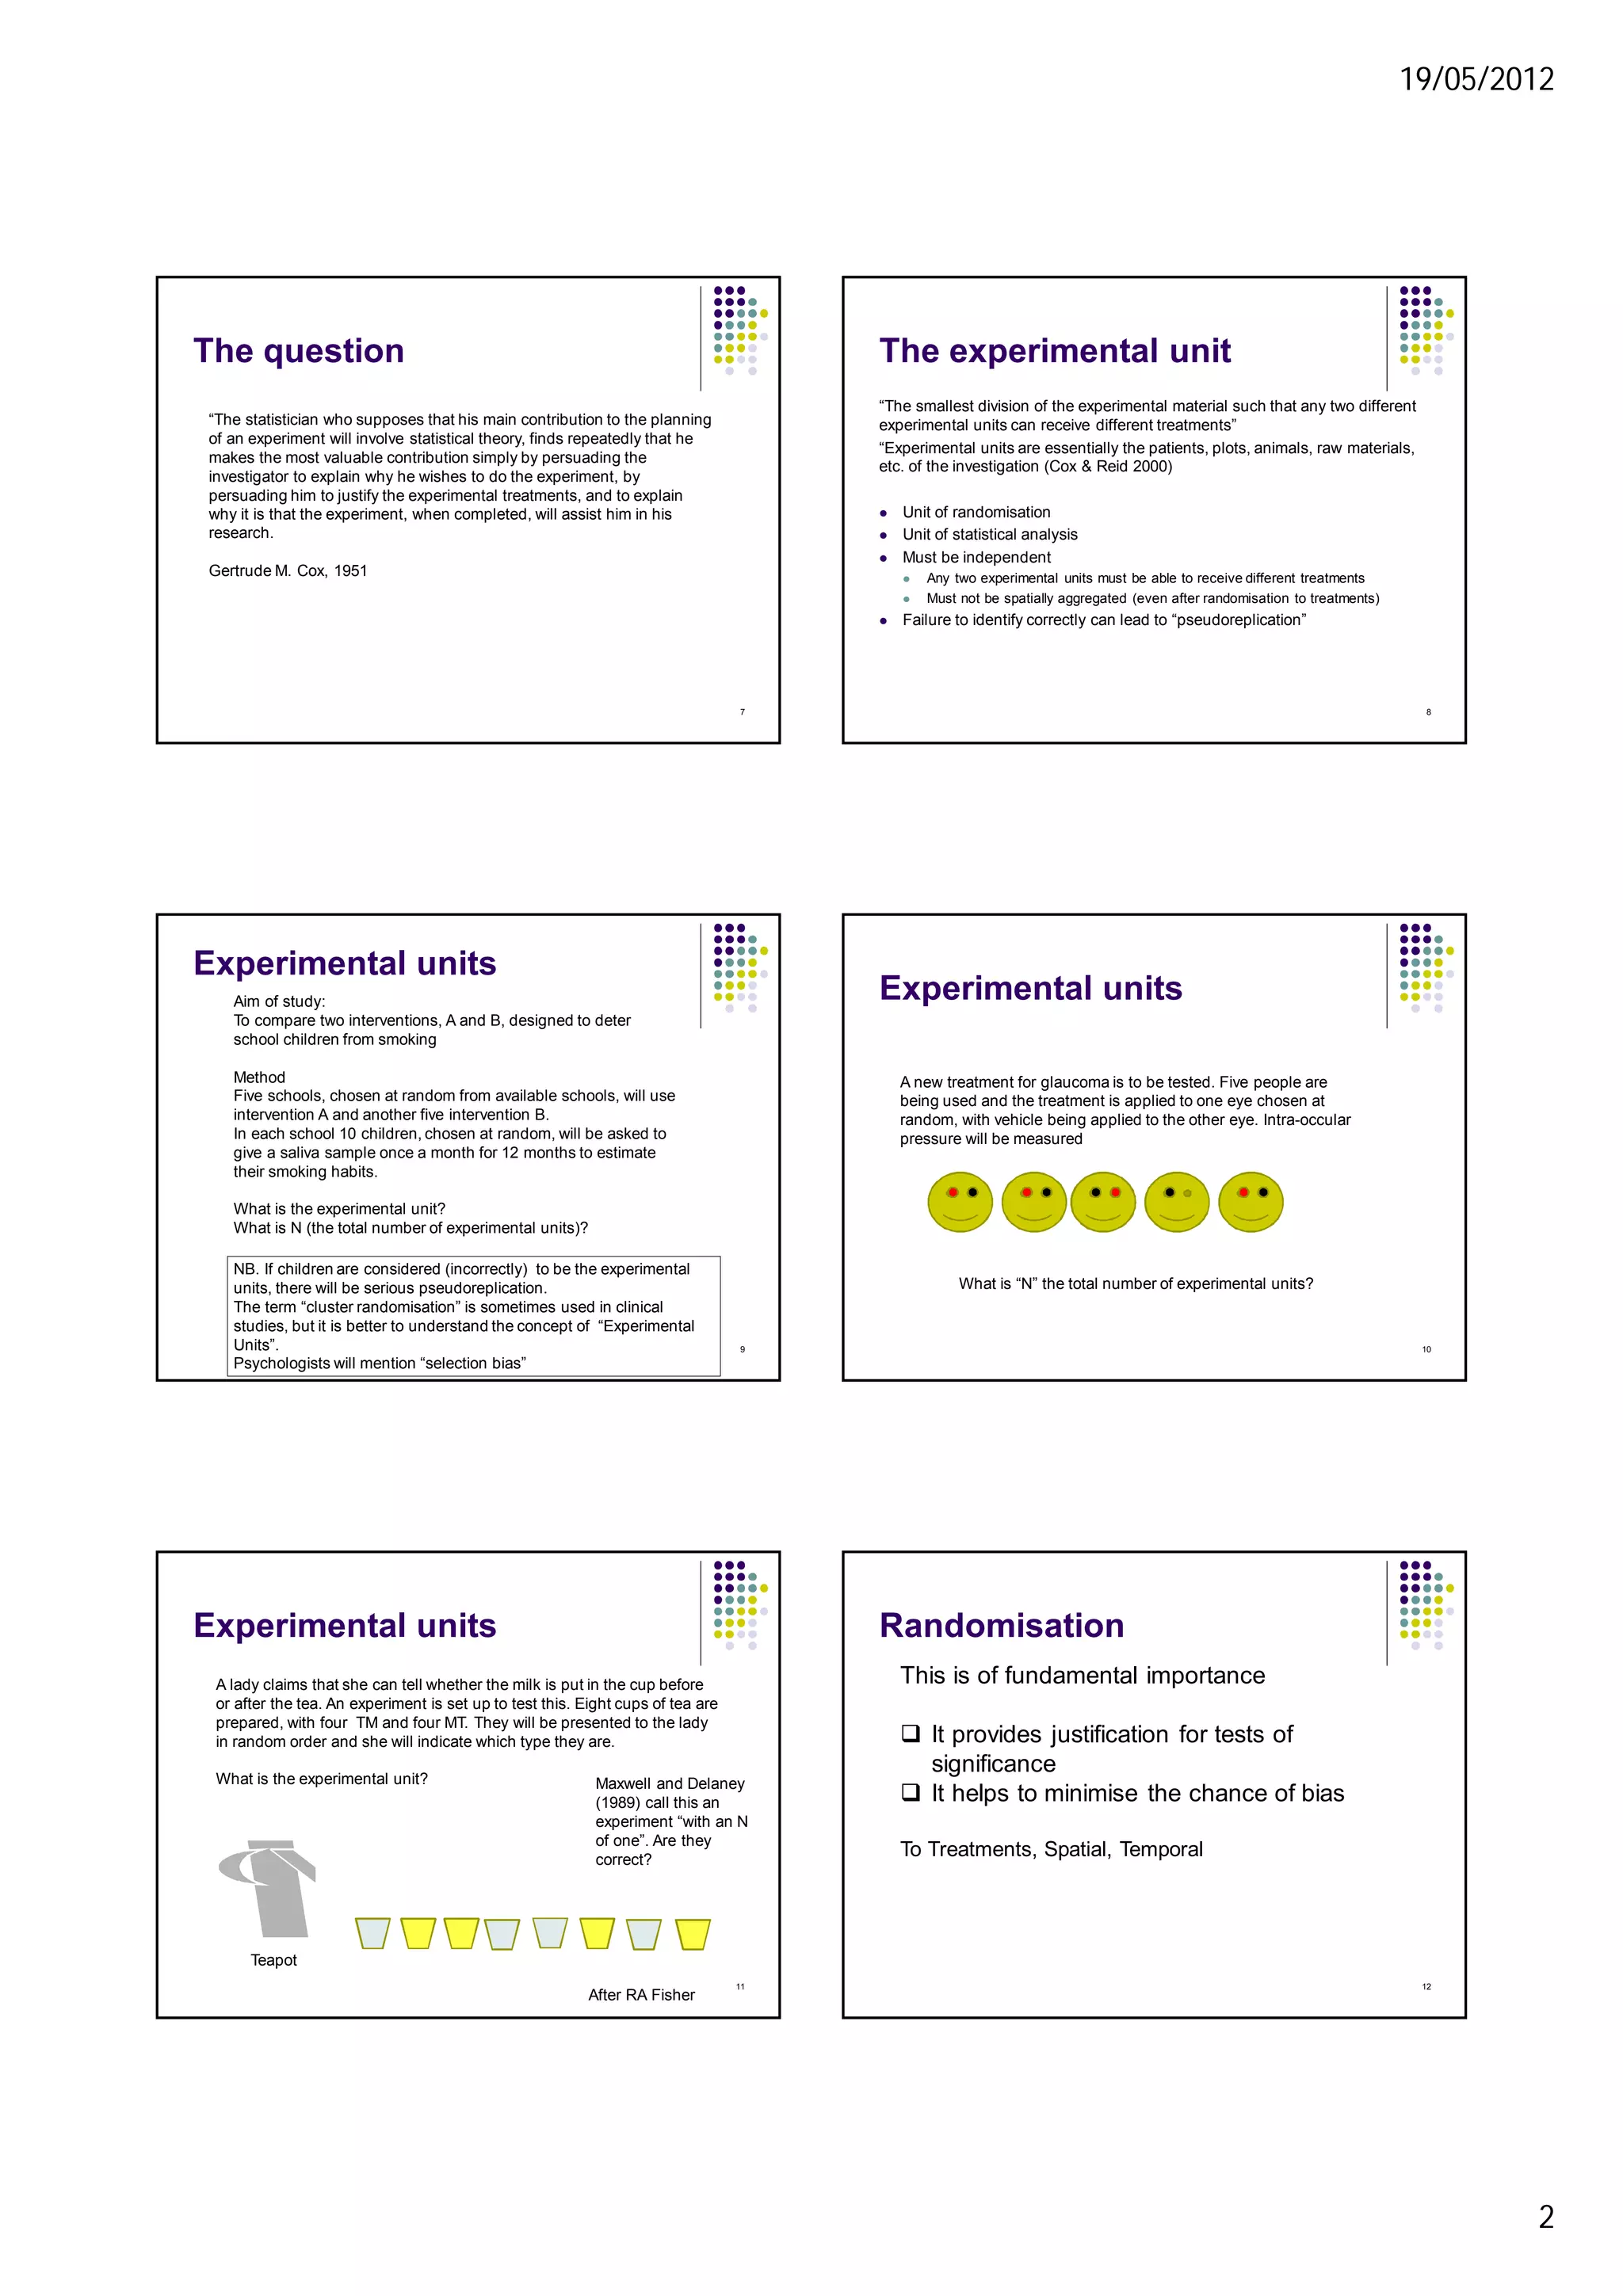
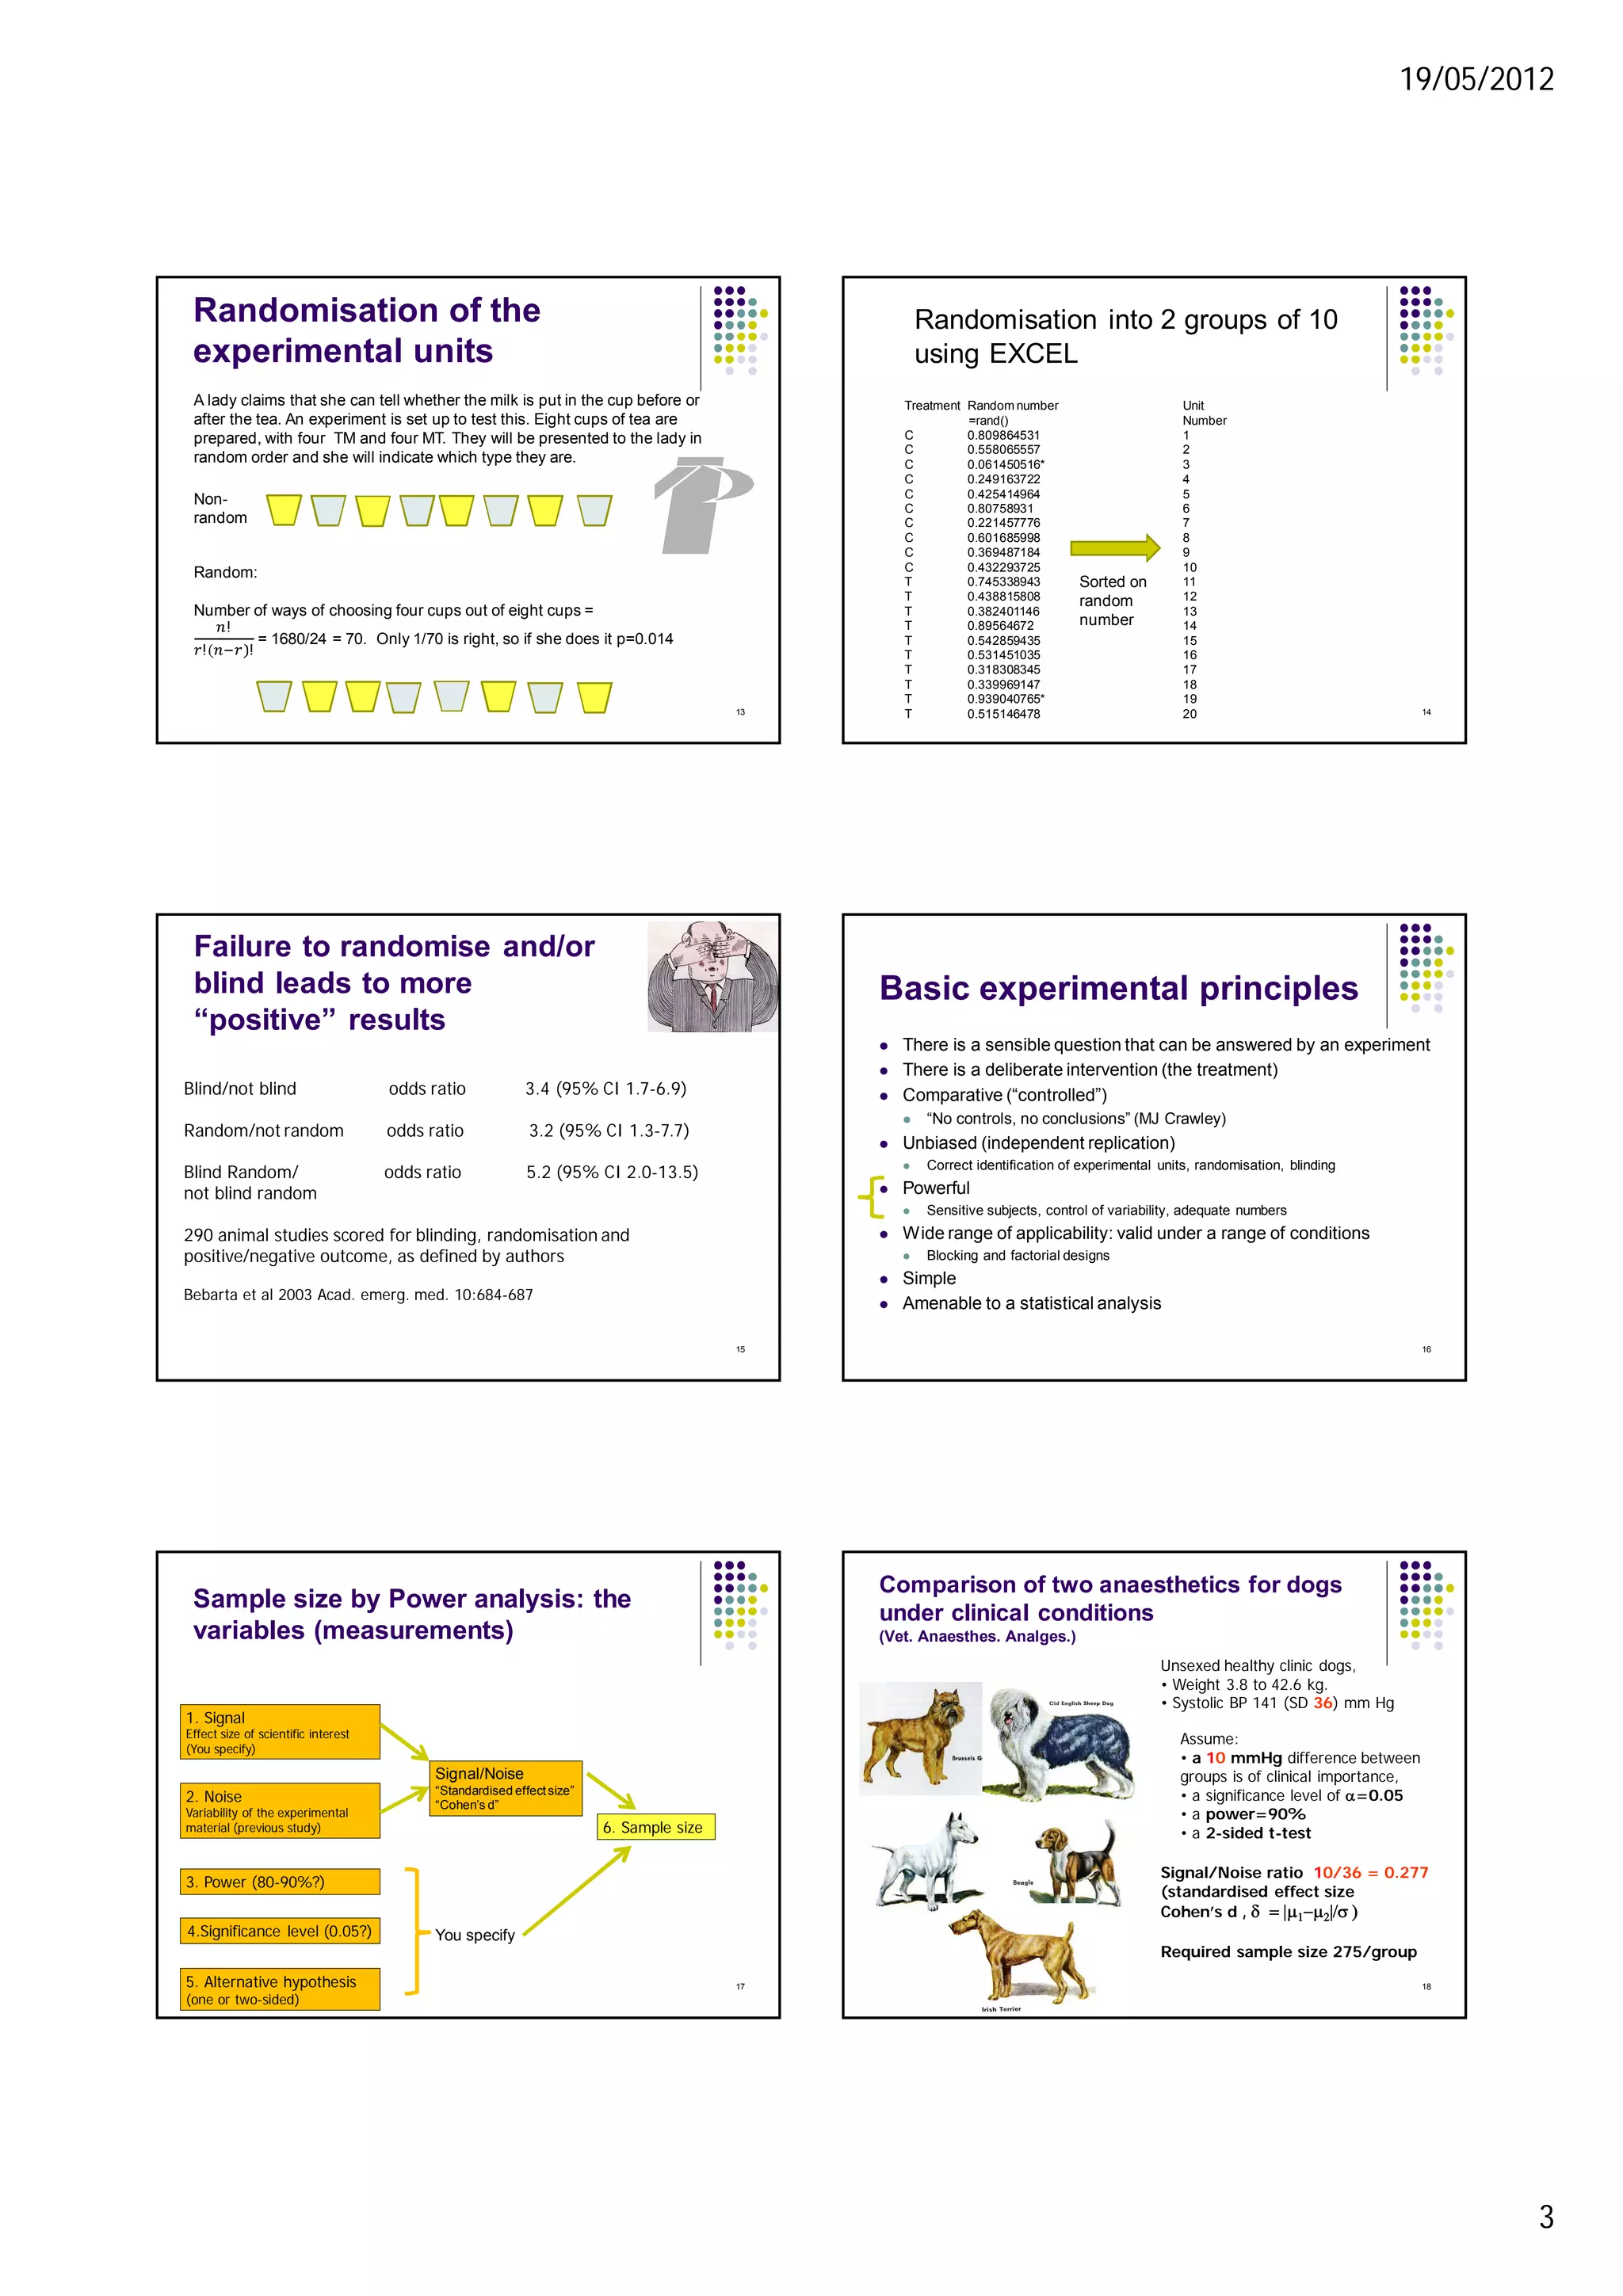
19/05/2012
1
The Principles of
experimental design
Michael FW Festing
Ph.D., D.Sc., CStat.
Research designs
Experimental
(an intervention)
Observational
No intervention
Prospective RetrospectiveProspective
Longitudinal Longitudinal Longitudinal Cross sectionalCross sectional
After Altman 1991
2
Detects causation Detects association
Randomised controlled
experiments
 Agriculture (RA Fisher, from 1920s)
 Behavioural sciences
 Medicine (Hill, 1930s)
 Clinical research and trials (from 1946)
 Basic research (animals, cells, tissues)
 Biological assay
 Drug development & toxicity testing
 Manufacturing industry (Shewhart, Deming)
 From late 1930s, Shewhart, later Taguchi, Deming
3
Purpose of an experiment
 Optimum operation of a system.
 Agriculture, industry: maximise yield
 Medicine: determine whether intervention
improves health and whether toxic
 Understanding of mechanisms
 Why does an intervention have an observed
effect?
 To satisfy regulations
 Is a particular intervention toxic or unsafe
4
Basic experimental principles
 There is a sensible question that can be answered by an experiment
 There is a deliberate intervention (the treatment)
 Comparative (“controlled”)
 “No controls, no conclusions” (MJ Crawley)
 Unbiased (independent replication)
 Correct identification of experimental units, randomisation, blinding
 Powerful
 Sensitive subjects, control of variability, adequate numbers
 Wide range of applicability: valid under a range of conditions
 Blocking and factorial designs
 Simple
 Amenable to a statistical analysis
5
The question
“..it is astonishing how many scientists arrive at a statisticians office for
discussions of experimental design or, more frequently, for analysis of
experimental data, with well defined treatments but with no clear idea of
the questions for which the treatments should provide answers”
Mead (1988) The Design of Experiments
6
19/05/2012
2
The question
“The statistician who supposes that his main contribution to the planning
of an experiment will involve statistical theory, finds repeatedly that he
makes the most valuable contribution simply by persuading the
investigator to explain why he wishes to do the experiment, by
persuading him to justify the experimental treatments, and to explain
why it is that the experiment, when completed, will assist him in his
research.
Gertrude M. Cox, 1951
7
The experimental unit
“The smallest division of the experimental material such that any two different
experimental units can receive different treatments”
“Experimental units are essentially the patients, plots, animals, raw materials,
etc. of the investigation (Cox & Reid 2000)
 Unit of randomisation
 Unit of statistical analysis
 Must be independent
 Any two experimental units must be able to receive different treatments
 Must not be spatially aggregated (even after randomisation to treatments)
 Failure to identify correctly can lead to “pseudoreplication”
8
Experimental units
Aim of study:
To compare two interventions, A and B, designed to deter
school children from smoking
Method
Five schools, chosen at random from available schools, will use
intervention A and another five intervention B.
In each school 10 children, chosen at random, will be asked to
give a saliva sample once a month for 12 months to estimate
their smoking habits.
What is the experimental unit?
What is N (the total number of experimental units)?
NB. If children are considered (incorrectly) to be the experimental
units, there will be serious pseudoreplication.
The term “cluster randomisation” is sometimes used in clinical
studies, but it is better to understand the concept of “Experimental
Units”.
Psychologists will mention “selection bias”
9
Experimental units
A new treatment for glaucoma is to be tested. Five people are
being used and the treatment is applied to one eye chosen at
random, with vehicle being applied to the other eye. Intra-occular
pressure will be measured
What is “N” the total number of experimental units?
10
Experimental units
A lady claims that she can tell whether the milk is put in the cup before
or after the tea. An experiment is set up to test this. Eight cups of tea are
prepared, with four TM and four MT. They will be presented to the lady
in random order and she will indicate which type they are.
What is the experimental unit? Maxwell and Delaney
(1989) call this an
experiment “with an N
of one”. Are they
correct?
After RA Fisher
11
Teapot
Randomisation
This is of fundamental importance
 It provides justification for tests of
significance
 It helps to minimise the chance of bias
To Treatments, Spatial, Temporal
12
19/05/2012
3
Randomisation of the
experimental units
A lady claims that she can tell whether the milk is put in the cup before or
after the tea. An experiment is set up to test this. Eight cups of tea are
prepared, with four TM and four MT. They will be presented to the lady in
random order and she will indicate which type they are.
Random:
Number of ways of choosing four cups out of eight cups =
!
! !
= 1680/24 = 70. Only 1/70 is right, so if she does it p=0.014
Non-
random
13
Treatment Random number
=rand()
C 0.809864531
C 0.558065557
C 0.061450516*
C 0.249163722
C 0.425414964
C 0.80758931
C 0.221457776
C 0.601685998
C 0.369487184
C 0.432293725
T 0.745338943
T 0.438815808
T 0.382401146
T 0.89564672
T 0.542859435
T 0.531451035
T 0.318308345
T 0.339969147
T 0.939040765*
T 0.515146478
Randomisation into 2 groups of 10
using EXCEL
14
Unit Treatment
Number randomised
1 C 0.061450516
2 C 0.221457776
3 C 0.249163722
4 T 0.318308345
5 T 0.339969147
6 C 0.369487184
7 T 0.382401146
8 C 0.425414964
9 C 0.432293725
10 T 0.438815808
11 T 0.515146478
12 T 0.531451035
13 T 0.542859435
14 C 0.558065557
15 C 0.601685998
16 T 0.745338943
17 C 0.80758931
18 C 0.809864531
19 T 0.89564672
20 T 0.939040765
Sorted on
random
number
15
Failure to randomise and/or
blind leads to more
“positive” results
Blind/not blind odds ratio 3.4 (95% CI 1.7-6.9)
Random/not random odds ratio 3.2 (95% CI 1.3-7.7)
Blind Random/ odds ratio 5.2 (95% CI 2.0-13.5)
not blind random
290 animal studies scored for blinding, randomisation and
positive/negative outcome, as defined by authors
Bebarta et al 2003 Acad. emerg. med. 10:684-687
Basic experimental principles
 There is a sensible question that can be answered by an experiment
 There is a deliberate intervention (the treatment)
 Comparative (“controlled”)
 “No controls, no conclusions” (MJ Crawley)
 Unbiased (independent replication)
 Correct identification of experimental units, randomisation, blinding
 Powerful
 Sensitive subjects, control of variability, adequate numbers
 Wide range of applicability: valid under a range of conditions
 Blocking and factorial designs
 Simple
 Amenable to a statistical analysis
16
17
Sample size by Power analysis: the
variables (measurements)
1. Signal
Effect size of scientific interest
(You specify)
4.Significance level (0.05?)
5. Alternative hypothesis
(one or two-sided)
3. Power (80-90%?)
2. Noise
Variability of the experimental
material (previous study)
Signal/Noise
“Standardised effectsize”
“Cohen’s d”
6. Sample size
You specify
18
Comparison of two anaesthetics for dogs
under clinical conditions
(Vet. Anaesthes. Analges.)
Unsexed healthy clinic dogs,
• Weight 3.8 to 42.6 kg.
• Systolic BP 141 (SD 36) mm Hg
Assume:
• a 10 mmHg difference between
groups is of clinical importance,
• a significance level of a=0.05
• a power=90%
• a 2-sided t-test
Signal/Noise ratio 10/36 = 0.277
(standardised effect size
Cohen’s d , d = |m1-m2|/s )
Required sample size 275/group
19/05/2012
4
19
Power and sample size
calculations using R
> power.t.test(delta=.277, sd=1, power=.9, sig.level=.05)
Two-sample t test power calculation
n = 274.8479
delta = 0.277
sd = 1
sig.level = 0.05
power = 0.9
alternative = two.sided
NOTE: n is number in *each* group
20
A second paper described:
• Male Beagles weight 17-23 kg
• mean BP 108 (SD 9) mm Hg.
• Want to detect 10mm
difference between groups (as
before)
With the same assumptions as
previous slide:
Signal/noise ratio = 10/9 =1.11
Required sample size 19/group
Assuming 2-sample, 2 sided t-test and 5% significance
level, 90% power (circles) or 80% power (triangles)
0.2 0.4 0.6 0.8 1.0 1.2 1.4 1.6 1.8
0
20
40
60
80
100
120
140
160
180
200
220
240
260
280
300
Signal to noise ratio
Samplesize
Signal/noise ratio and sample size for a two-sample
t-test
21 22
Summary for two sources of dogs: aim is to
be able to detect a 10mmHg change in blood
pressure
Type of dog SDev Signal/noise Sample %Power (n=18)
size/gp(1) (2)
Random dogs 36 0.277 275 12
Male beagles 9 1.111 18 90
(1) Sample size: 90% power
(2) Power, Sample size 18/group
Assumes a=5%, 2-sided t-test and effect size 10mmHg
Why do we need so few animals, compared
with humans, in an experiment?
Low noise
 Animals about the same age
 Same diet
 Live in the same environment
 Free of disease
 Genetically identical (if
inbred)
High signal
 Choice of sensitive strains
 More extreme treatments
23
But we need to think about the generalizability or external validity
Basic experimental principles
 There is a sensible question that can be answered by an experiment
 There is a deliberate intervention (the treatment)
 Comparative (“controlled”)
 “No controls, no conclusions” (MJ Crawley)
 Unbiased (independent replication)
 Correct identification of experimental units, randomisation, blinding
 Powerful
 Sensitive subjects, control of variability (blocking), adequate numbers
 Wide range of applicability: valid under a range of conditions
 Blocking, covariance, factorial designs
 Simple
 Amenable to a statistical analysis
24
19/05/2012
5
Generalising the results
“One possible solution to the problem of external validity is, where
possible, to take steps to assure that the study will use a heterogeneous
group of persons, settings and times.
Note that this is at odds with one of the recommendations we made
regarding statistical conclusion validity.
In fact, what is good for the precision of a study, such as standardising
conditions and working with a homogeneous sample of subjects is often
detrimental to the generality of the findings…
……although heterogeneity makes it difficult to obtain statistically
significant findings, once they are obtained it allows generalisation of these
findings with greater confidence to other situations.”
Maxwell and Delaney (1989) This is not true. Uncontrolled random
variation leads to more false negative
rsults. Do we want to generalise false
negative results?
25
Generalising the results
The method of pairing, which is much used in biological work,
illustrates well the way in which an appropriate experimental design is
able to reconcile two desiderata, which sometimes seem to be in
conflict.
On the one hand we require the utmost uniformity in biological
material, which is the subject of the experiment, in order to increase
the sensitiveness of each individual observation; and on the other, we
require to multiply the observations so as to demonstrate as far as
possible the reliability and consistency of the results…
….however there is no real dilemma. Uniformity is only required
between the objects whose response is to be contrasted (that is
objects treated differently)
RA Fisher (1960)
26
Pairing or matching (blocking)
Control Treated
“The method of pairing, which
is much used in biological
work, illustrates well the way in
which an appropriate
experimental design is able to
reconcile two desiderata, which
sometimes seem to be in
conflict.”
RA Fisher
27
Pairing or matching (hypothetical data)
Anaesthetic A Anaesthetic B
mmHg
140
100
125
90
135
mmHg A-B Difference
135 5
89 11
118 7
80 10
110 25
Mean diff. =11.6 28
A paired (one-sample) t-test
One Sample t-test
data: Difference
t = 3.2995, df = 4, p-value = 0.02995
alternative hypothesis: true mean is
not equal to 0
95 percent confidence interval:
1.83891 21.36109
sample estimates:
mean of x
11.6
29
Other situations
 Many outcomes
 Separate power calculation for each outcome
 More than 2 groups
 Power analysis for 1-way ANOVA
 Compare control vs. top dose ?
 Power on a standardised effect size (in clinical work small,
medium and large effects are d= 0.2, 0.5 and 0.8, respectively. In
animal work d=0.5, 1.0 and 1.5 might be more appropriate)
 Two proportions
 Other:
 Survival
 Regression etc.
30
19/05/2012
6
Sample size for two proportions
31
Randomised block designs
Randomised block
 Purpose is to control inter-individual variability and increase generality
 Experiment split up into a number of more homogeneous groups
 Randomisation is within-group
 We are not generally interested in group differences
 Widely used in agricultural research, less common in other disciplines
(though potentially useful)
(the paired design is a randomised block design)
32
Blocking vs. covariance.
Blocking
can account for multiple differences, some of which may not be
measurable. But subjects need to be organised into blocks
Covariance
can correct for one or a few variables correlated with the outcome
variable, which can be measured before the experiment is started
Completely randomised
High fertility Low fertility
An experiment with four treatments and five
subjects/treatment
Problems:
4/5 yellow in low
fertility area
4/5 white in high
fertility area
Large inter-
individual
variation
33
A randomised block design
An experiment with four treatments and five subjects/treatment
Randomisation is done separately in each block
Bias due to fertility gradient is minimised, inter-individual variation
removed as “blocks” in the statistical analysis
High fertility Low fertility
Block 1 Block 2 Block 3 Block 4 Block 5
Comments
All treatments
now in equal
fertility areas
But need a 2-
way ANOVA to
remove block
differences
34
Randomised block designs all
have the same statistical analysis
Several names for the same design
 Randomised block
 Within-subjects
 Matched subjects, matched pairs
 Crossover
 Related subjects
 Correlated subjects
 Repeated measures (but this name also used for other
designs)
Yij= m+ ti + bj + tbij + eij
35
A randomised block design
Block 1
Block 4
Block 3
Block 2
1. Normally each block has one of each of the treatments, but can have more
2. Best not to use with unequal numbers
3. Randomisation is done within a block
4. Can be multiple differences between blocks
5. Experimental units within a block should be as similar as possible
Time
Or
space
36
Time or space
19/05/2012
7
Factorial designs
Two or more factors in a single experiment
Purpose is to increase generality and increase
efficiency of a design
Factors thought likely to influence outcome
deliberately varied to determine their effect
Detect interactions (one factor may potentiate
another one)
Important in agricultural, industrial and
fundamental biomedical research, sometimes in
clinical trials
37
Factorial designs. Another way
of increasing generality
“..we should, in designing the experiment, artificially
vary conditions if we can do so without inflating the
error.
… it is important to recognise explicitly what are the
restrictions on the conclusions of any particular
experiment”
Cox 1958
38
39
Factorial designs
(By using a factorial design)”.... an experimental
investigation, at the same time as it is made more
comprehensive, may also be made more efficient if
by more efficient we mean that more knowledge
and a higher degree of precision are obtainable by
the same number of observations.”
R.A. Fisher, 1960
A 2x2 factorial
Placebo Drug 1
Placebo
Drug 2
A B
C D
Effect of drug 1 = (A+C)-(B+D)
Effect of drug 2 = (A+B)-(C+D)
Interaction= (A+D)-(B+C)
40
Examples of factorial designs
Clinical:
1. Canadian transient ischemic attack: Aspirin, sulfinpyrazone for
suspected acute myocardial infarction
2. ISIS2 Aspirin, Streptokinase for suspected acute myocardial
infarction
3. GISSI2 alteplase, streptokinase+heparin for acute myocardial
infarction
4. The international stroke trial: aspirin, subcutaneous heparin
Preclinical:
About 1/3rd. Of experiments involving laboratory animals
Agricultural & industrial. Majority of studies
41
Factorial designs are widely used but
often incorrectly analysed
42
Number of studies 513
Factorial designs 153 (30%)
Correctly analysed 78 (50%)
Niewenhuis et al (2011) Nature Neurosci. 14:1105
19/05/2012
8
43
Effect of chloramphenicol on
RBC counts (2000mg/kg)
Strain Control Treated Strain means
BALB/c 10.10 8.95
10.08 8.45
9.73 8.68
10.09 8.89 9.37
C57BL 9.60 8.82
9.56 8.24
9.14 8.18
9.20 8.10 8.86
Treat.
Mean 9.69 8.54
Want to know:
1. Does treatment
have an effect on
RBC counts
2. Do strains differ
in RBC counts
3. Do strains differ
in their response
(interaction)
44
No interaction
8.59.09.510.0
Treatment
meanofRBCs
C T
BALB/c
C57BL
45
Analyse by 2-way ANOVA with
interaction
Analysis of Variance Table
Response: RBCs
Df Sum Sq Mean Sq F value Pr(>F)
Treatment 1 1.0661 1.0661 17.1512 0.001367 **
Strain 1 5.2785 5.2785 84.9232 8.595e-07 ***
Treatment:Strain 1 0.0473 0.0473 0.7611 0.400108
Residuals 12 0.7459 0.0622
---
Signif. codes: 0 ‘***’ 0.001 ‘**’ 0.01 ‘*’ 0.05 ‘.’ 0.1
‘ ’ 1
>
46
Effect of chloramphenicol
(2000mg/kg) on RBC count
Strain Control Treated Strain means
C3H 7.85 7.81
8.77 7.21
8.48 6.96
8.22 7.10 7.80
CD-1 9.01 9.18
7.76 8.31
8.42 8.47
8.83 8.67 8.58
Treatment
means 8.42 7.96
47
Interaction
7.47.67.88.08.28.48.6
Treatment
meanofRBCs
C T
C3H
CD-1
48
Analysis of Variance Table
Response: RBCs
Df Sum Sq Mean Sq F value Pr(>F)
Strain 1 0.82356 0.82356 4.4302 0.057057 .
Treatment 1 2.44141 2.44141 13.1330 0.003489 **
Strain:Treatment 1 1.47016 1.47016 7.9084 0.015686 *
Residuals 12 2.23077 0.18590
---
Signif. codes: 0 ‘***’ 0.001 ‘**’ 0.01 ‘*’ 0.05 ‘.’ 0.1 ‘
’ 1
>
19/05/2012
9
Basic experimental principles
 There is a sensible question that can be answered by an experiment
 There is a deliberate intervention (the treatment)
 Comparative (“controlled”)
 “No controls, no conclusions” (MJ Crawley)
 Unbiased (independent replication)
 Correct identification of experimental units, randomisation, blinding
 Powerful
 Sensitive subjects, control of variability, adequate numbers
 Wide range of applicability: valid under a range of conditions
 Blocking and factorial designs
 Simple
 Amenable to a statistical analysis
49
Published papers often fail to
provide sufficient information
 CONSORT for clinical studies
 ARRIVE and Gold Standard Publication
Checklist (GSPC) for animal studies
50
Literature
51
Altman,D.G. (1991): Practical statistics for medical research. Chapman and Hall, London, Glasgow, New York.
Cochran,W.G. and Cox,G.M. (1957): Experimental designs. John Wiley & Sons, Inc., New York, London.
Cox,D.R. (1958): Planning experiments. John Wiley and Sons, New York.
Cox DR, Reid N. The theory of the design of experiments. Boca Raton, Florida: Chapman and Hall/CRC Press, 2000.
Festing,M.F.W., Overend,P., Gaines Das,R., Cortina Borja,M., and Berdoy,M. (2002): The Design of Animal
Experiments. Laboratory Animals Ltd., London.
Fisher RA. The design of experiments. New York: Hafner Publishing Company, Inc, 1960
Howell,D.C. (1999): Fundamental Statistics for the Behavioral Sciences. Duxbury Press, PacificGrove, London, New
York.
Friedman, L.M., Furburg, C.D. and DeMets, D.L. (2010) Clinical Trials, 4th. edn.,Springer
Maxwell,S.E. and Delaney,H.D. (1989): Designing experiments and analyzing data. Wadsworth Publishing Company,
Belmont, California.
Mead,R. (1988): The design of experiments. Cambridge University Press, Cambridge, New York.
Montgomery,D.C. (1997): Design and analysis of experiments. Wiley, New York.
Ruxton GD, Colegrave N. Experimental design for the life sciences. 3rd edn. Oxford: Oxford University Press, 2010.
Conclusions
 Basic principles of experimental design are universal
 Absence of bias
 High power
 Wide range of generality
 Simple
 Amenable to a statistical analysis
 But each discipline has different priorities
 Clinical trials often large and simple
 Animal, agricultural and industrial research often small and complex
(factorial designs common)
 For anyone planning animal research:
 www.3Rs-reduction.co.uk
52

Michael Festing - The Principles of Experimental Design

  • 1.
    19/05/2012 1 The Principles of experimentaldesign Michael FW Festing Ph.D., D.Sc., CStat. Research designs Experimental (an intervention) Observational No intervention Prospective RetrospectiveProspective Longitudinal Longitudinal Longitudinal Cross sectionalCross sectional After Altman 1991 2 Detects causation Detects association Randomised controlled experiments  Agriculture (RA Fisher, from 1920s)  Behavioural sciences  Medicine (Hill, 1930s)  Clinical research and trials (from 1946)  Basic research (animals, cells, tissues)  Biological assay  Drug development & toxicity testing  Manufacturing industry (Shewhart, Deming)  From late 1930s, Shewhart, later Taguchi, Deming 3 Purpose of an experiment  Optimum operation of a system.  Agriculture, industry: maximise yield  Medicine: determine whether intervention improves health and whether toxic  Understanding of mechanisms  Why does an intervention have an observed effect?  To satisfy regulations  Is a particular intervention toxic or unsafe 4 Basic experimental principles  There is a sensible question that can be answered by an experiment  There is a deliberate intervention (the treatment)  Comparative (“controlled”)  “No controls, no conclusions” (MJ Crawley)  Unbiased (independent replication)  Correct identification of experimental units, randomisation, blinding  Powerful  Sensitive subjects, control of variability, adequate numbers  Wide range of applicability: valid under a range of conditions  Blocking and factorial designs  Simple  Amenable to a statistical analysis 5 The question “..it is astonishing how many scientists arrive at a statisticians office for discussions of experimental design or, more frequently, for analysis of experimental data, with well defined treatments but with no clear idea of the questions for which the treatments should provide answers” Mead (1988) The Design of Experiments 6
  • 2.
    19/05/2012 2 The question “The statisticianwho supposes that his main contribution to the planning of an experiment will involve statistical theory, finds repeatedly that he makes the most valuable contribution simply by persuading the investigator to explain why he wishes to do the experiment, by persuading him to justify the experimental treatments, and to explain why it is that the experiment, when completed, will assist him in his research. Gertrude M. Cox, 1951 7 The experimental unit “The smallest division of the experimental material such that any two different experimental units can receive different treatments” “Experimental units are essentially the patients, plots, animals, raw materials, etc. of the investigation (Cox & Reid 2000)  Unit of randomisation  Unit of statistical analysis  Must be independent  Any two experimental units must be able to receive different treatments  Must not be spatially aggregated (even after randomisation to treatments)  Failure to identify correctly can lead to “pseudoreplication” 8 Experimental units Aim of study: To compare two interventions, A and B, designed to deter school children from smoking Method Five schools, chosen at random from available schools, will use intervention A and another five intervention B. In each school 10 children, chosen at random, will be asked to give a saliva sample once a month for 12 months to estimate their smoking habits. What is the experimental unit? What is N (the total number of experimental units)? NB. If children are considered (incorrectly) to be the experimental units, there will be serious pseudoreplication. The term “cluster randomisation” is sometimes used in clinical studies, but it is better to understand the concept of “Experimental Units”. Psychologists will mention “selection bias” 9 Experimental units A new treatment for glaucoma is to be tested. Five people are being used and the treatment is applied to one eye chosen at random, with vehicle being applied to the other eye. Intra-occular pressure will be measured What is “N” the total number of experimental units? 10 Experimental units A lady claims that she can tell whether the milk is put in the cup before or after the tea. An experiment is set up to test this. Eight cups of tea are prepared, with four TM and four MT. They will be presented to the lady in random order and she will indicate which type they are. What is the experimental unit? Maxwell and Delaney (1989) call this an experiment “with an N of one”. Are they correct? After RA Fisher 11 Teapot Randomisation This is of fundamental importance  It provides justification for tests of significance  It helps to minimise the chance of bias To Treatments, Spatial, Temporal 12
  • 3.
    19/05/2012 3 Randomisation of the experimentalunits A lady claims that she can tell whether the milk is put in the cup before or after the tea. An experiment is set up to test this. Eight cups of tea are prepared, with four TM and four MT. They will be presented to the lady in random order and she will indicate which type they are. Random: Number of ways of choosing four cups out of eight cups = ! ! ! = 1680/24 = 70. Only 1/70 is right, so if she does it p=0.014 Non- random 13 Treatment Random number =rand() C 0.809864531 C 0.558065557 C 0.061450516* C 0.249163722 C 0.425414964 C 0.80758931 C 0.221457776 C 0.601685998 C 0.369487184 C 0.432293725 T 0.745338943 T 0.438815808 T 0.382401146 T 0.89564672 T 0.542859435 T 0.531451035 T 0.318308345 T 0.339969147 T 0.939040765* T 0.515146478 Randomisation into 2 groups of 10 using EXCEL 14 Unit Treatment Number randomised 1 C 0.061450516 2 C 0.221457776 3 C 0.249163722 4 T 0.318308345 5 T 0.339969147 6 C 0.369487184 7 T 0.382401146 8 C 0.425414964 9 C 0.432293725 10 T 0.438815808 11 T 0.515146478 12 T 0.531451035 13 T 0.542859435 14 C 0.558065557 15 C 0.601685998 16 T 0.745338943 17 C 0.80758931 18 C 0.809864531 19 T 0.89564672 20 T 0.939040765 Sorted on random number 15 Failure to randomise and/or blind leads to more “positive” results Blind/not blind odds ratio 3.4 (95% CI 1.7-6.9) Random/not random odds ratio 3.2 (95% CI 1.3-7.7) Blind Random/ odds ratio 5.2 (95% CI 2.0-13.5) not blind random 290 animal studies scored for blinding, randomisation and positive/negative outcome, as defined by authors Bebarta et al 2003 Acad. emerg. med. 10:684-687 Basic experimental principles  There is a sensible question that can be answered by an experiment  There is a deliberate intervention (the treatment)  Comparative (“controlled”)  “No controls, no conclusions” (MJ Crawley)  Unbiased (independent replication)  Correct identification of experimental units, randomisation, blinding  Powerful  Sensitive subjects, control of variability, adequate numbers  Wide range of applicability: valid under a range of conditions  Blocking and factorial designs  Simple  Amenable to a statistical analysis 16 17 Sample size by Power analysis: the variables (measurements) 1. Signal Effect size of scientific interest (You specify) 4.Significance level (0.05?) 5. Alternative hypothesis (one or two-sided) 3. Power (80-90%?) 2. Noise Variability of the experimental material (previous study) Signal/Noise “Standardised effectsize” “Cohen’s d” 6. Sample size You specify 18 Comparison of two anaesthetics for dogs under clinical conditions (Vet. Anaesthes. Analges.) Unsexed healthy clinic dogs, • Weight 3.8 to 42.6 kg. • Systolic BP 141 (SD 36) mm Hg Assume: • a 10 mmHg difference between groups is of clinical importance, • a significance level of a=0.05 • a power=90% • a 2-sided t-test Signal/Noise ratio 10/36 = 0.277 (standardised effect size Cohen’s d , d = |m1-m2|/s ) Required sample size 275/group
  • 4.
    19/05/2012 4 19 Power and samplesize calculations using R > power.t.test(delta=.277, sd=1, power=.9, sig.level=.05) Two-sample t test power calculation n = 274.8479 delta = 0.277 sd = 1 sig.level = 0.05 power = 0.9 alternative = two.sided NOTE: n is number in *each* group 20 A second paper described: • Male Beagles weight 17-23 kg • mean BP 108 (SD 9) mm Hg. • Want to detect 10mm difference between groups (as before) With the same assumptions as previous slide: Signal/noise ratio = 10/9 =1.11 Required sample size 19/group Assuming 2-sample, 2 sided t-test and 5% significance level, 90% power (circles) or 80% power (triangles) 0.2 0.4 0.6 0.8 1.0 1.2 1.4 1.6 1.8 0 20 40 60 80 100 120 140 160 180 200 220 240 260 280 300 Signal to noise ratio Samplesize Signal/noise ratio and sample size for a two-sample t-test 21 22 Summary for two sources of dogs: aim is to be able to detect a 10mmHg change in blood pressure Type of dog SDev Signal/noise Sample %Power (n=18) size/gp(1) (2) Random dogs 36 0.277 275 12 Male beagles 9 1.111 18 90 (1) Sample size: 90% power (2) Power, Sample size 18/group Assumes a=5%, 2-sided t-test and effect size 10mmHg Why do we need so few animals, compared with humans, in an experiment? Low noise  Animals about the same age  Same diet  Live in the same environment  Free of disease  Genetically identical (if inbred) High signal  Choice of sensitive strains  More extreme treatments 23 But we need to think about the generalizability or external validity Basic experimental principles  There is a sensible question that can be answered by an experiment  There is a deliberate intervention (the treatment)  Comparative (“controlled”)  “No controls, no conclusions” (MJ Crawley)  Unbiased (independent replication)  Correct identification of experimental units, randomisation, blinding  Powerful  Sensitive subjects, control of variability (blocking), adequate numbers  Wide range of applicability: valid under a range of conditions  Blocking, covariance, factorial designs  Simple  Amenable to a statistical analysis 24
  • 5.
    19/05/2012 5 Generalising the results “Onepossible solution to the problem of external validity is, where possible, to take steps to assure that the study will use a heterogeneous group of persons, settings and times. Note that this is at odds with one of the recommendations we made regarding statistical conclusion validity. In fact, what is good for the precision of a study, such as standardising conditions and working with a homogeneous sample of subjects is often detrimental to the generality of the findings… ……although heterogeneity makes it difficult to obtain statistically significant findings, once they are obtained it allows generalisation of these findings with greater confidence to other situations.” Maxwell and Delaney (1989) This is not true. Uncontrolled random variation leads to more false negative rsults. Do we want to generalise false negative results? 25 Generalising the results The method of pairing, which is much used in biological work, illustrates well the way in which an appropriate experimental design is able to reconcile two desiderata, which sometimes seem to be in conflict. On the one hand we require the utmost uniformity in biological material, which is the subject of the experiment, in order to increase the sensitiveness of each individual observation; and on the other, we require to multiply the observations so as to demonstrate as far as possible the reliability and consistency of the results… ….however there is no real dilemma. Uniformity is only required between the objects whose response is to be contrasted (that is objects treated differently) RA Fisher (1960) 26 Pairing or matching (blocking) Control Treated “The method of pairing, which is much used in biological work, illustrates well the way in which an appropriate experimental design is able to reconcile two desiderata, which sometimes seem to be in conflict.” RA Fisher 27 Pairing or matching (hypothetical data) Anaesthetic A Anaesthetic B mmHg 140 100 125 90 135 mmHg A-B Difference 135 5 89 11 118 7 80 10 110 25 Mean diff. =11.6 28 A paired (one-sample) t-test One Sample t-test data: Difference t = 3.2995, df = 4, p-value = 0.02995 alternative hypothesis: true mean is not equal to 0 95 percent confidence interval: 1.83891 21.36109 sample estimates: mean of x 11.6 29 Other situations  Many outcomes  Separate power calculation for each outcome  More than 2 groups  Power analysis for 1-way ANOVA  Compare control vs. top dose ?  Power on a standardised effect size (in clinical work small, medium and large effects are d= 0.2, 0.5 and 0.8, respectively. In animal work d=0.5, 1.0 and 1.5 might be more appropriate)  Two proportions  Other:  Survival  Regression etc. 30
  • 6.
    19/05/2012 6 Sample size fortwo proportions 31 Randomised block designs Randomised block  Purpose is to control inter-individual variability and increase generality  Experiment split up into a number of more homogeneous groups  Randomisation is within-group  We are not generally interested in group differences  Widely used in agricultural research, less common in other disciplines (though potentially useful) (the paired design is a randomised block design) 32 Blocking vs. covariance. Blocking can account for multiple differences, some of which may not be measurable. But subjects need to be organised into blocks Covariance can correct for one or a few variables correlated with the outcome variable, which can be measured before the experiment is started Completely randomised High fertility Low fertility An experiment with four treatments and five subjects/treatment Problems: 4/5 yellow in low fertility area 4/5 white in high fertility area Large inter- individual variation 33 A randomised block design An experiment with four treatments and five subjects/treatment Randomisation is done separately in each block Bias due to fertility gradient is minimised, inter-individual variation removed as “blocks” in the statistical analysis High fertility Low fertility Block 1 Block 2 Block 3 Block 4 Block 5 Comments All treatments now in equal fertility areas But need a 2- way ANOVA to remove block differences 34 Randomised block designs all have the same statistical analysis Several names for the same design  Randomised block  Within-subjects  Matched subjects, matched pairs  Crossover  Related subjects  Correlated subjects  Repeated measures (but this name also used for other designs) Yij= m+ ti + bj + tbij + eij 35 A randomised block design Block 1 Block 4 Block 3 Block 2 1. Normally each block has one of each of the treatments, but can have more 2. Best not to use with unequal numbers 3. Randomisation is done within a block 4. Can be multiple differences between blocks 5. Experimental units within a block should be as similar as possible Time Or space 36 Time or space
  • 7.
    19/05/2012 7 Factorial designs Two ormore factors in a single experiment Purpose is to increase generality and increase efficiency of a design Factors thought likely to influence outcome deliberately varied to determine their effect Detect interactions (one factor may potentiate another one) Important in agricultural, industrial and fundamental biomedical research, sometimes in clinical trials 37 Factorial designs. Another way of increasing generality “..we should, in designing the experiment, artificially vary conditions if we can do so without inflating the error. … it is important to recognise explicitly what are the restrictions on the conclusions of any particular experiment” Cox 1958 38 39 Factorial designs (By using a factorial design)”.... an experimental investigation, at the same time as it is made more comprehensive, may also be made more efficient if by more efficient we mean that more knowledge and a higher degree of precision are obtainable by the same number of observations.” R.A. Fisher, 1960 A 2x2 factorial Placebo Drug 1 Placebo Drug 2 A B C D Effect of drug 1 = (A+C)-(B+D) Effect of drug 2 = (A+B)-(C+D) Interaction= (A+D)-(B+C) 40 Examples of factorial designs Clinical: 1. Canadian transient ischemic attack: Aspirin, sulfinpyrazone for suspected acute myocardial infarction 2. ISIS2 Aspirin, Streptokinase for suspected acute myocardial infarction 3. GISSI2 alteplase, streptokinase+heparin for acute myocardial infarction 4. The international stroke trial: aspirin, subcutaneous heparin Preclinical: About 1/3rd. Of experiments involving laboratory animals Agricultural & industrial. Majority of studies 41 Factorial designs are widely used but often incorrectly analysed 42 Number of studies 513 Factorial designs 153 (30%) Correctly analysed 78 (50%) Niewenhuis et al (2011) Nature Neurosci. 14:1105
  • 8.
    19/05/2012 8 43 Effect of chloramphenicolon RBC counts (2000mg/kg) Strain Control Treated Strain means BALB/c 10.10 8.95 10.08 8.45 9.73 8.68 10.09 8.89 9.37 C57BL 9.60 8.82 9.56 8.24 9.14 8.18 9.20 8.10 8.86 Treat. Mean 9.69 8.54 Want to know: 1. Does treatment have an effect on RBC counts 2. Do strains differ in RBC counts 3. Do strains differ in their response (interaction) 44 No interaction 8.59.09.510.0 Treatment meanofRBCs C T BALB/c C57BL 45 Analyse by 2-way ANOVA with interaction Analysis of Variance Table Response: RBCs Df Sum Sq Mean Sq F value Pr(>F) Treatment 1 1.0661 1.0661 17.1512 0.001367 ** Strain 1 5.2785 5.2785 84.9232 8.595e-07 *** Treatment:Strain 1 0.0473 0.0473 0.7611 0.400108 Residuals 12 0.7459 0.0622 --- Signif. codes: 0 ‘***’ 0.001 ‘**’ 0.01 ‘*’ 0.05 ‘.’ 0.1 ‘ ’ 1 > 46 Effect of chloramphenicol (2000mg/kg) on RBC count Strain Control Treated Strain means C3H 7.85 7.81 8.77 7.21 8.48 6.96 8.22 7.10 7.80 CD-1 9.01 9.18 7.76 8.31 8.42 8.47 8.83 8.67 8.58 Treatment means 8.42 7.96 47 Interaction 7.47.67.88.08.28.48.6 Treatment meanofRBCs C T C3H CD-1 48 Analysis of Variance Table Response: RBCs Df Sum Sq Mean Sq F value Pr(>F) Strain 1 0.82356 0.82356 4.4302 0.057057 . Treatment 1 2.44141 2.44141 13.1330 0.003489 ** Strain:Treatment 1 1.47016 1.47016 7.9084 0.015686 * Residuals 12 2.23077 0.18590 --- Signif. codes: 0 ‘***’ 0.001 ‘**’ 0.01 ‘*’ 0.05 ‘.’ 0.1 ‘ ’ 1 >
  • 9.
    19/05/2012 9 Basic experimental principles There is a sensible question that can be answered by an experiment  There is a deliberate intervention (the treatment)  Comparative (“controlled”)  “No controls, no conclusions” (MJ Crawley)  Unbiased (independent replication)  Correct identification of experimental units, randomisation, blinding  Powerful  Sensitive subjects, control of variability, adequate numbers  Wide range of applicability: valid under a range of conditions  Blocking and factorial designs  Simple  Amenable to a statistical analysis 49 Published papers often fail to provide sufficient information  CONSORT for clinical studies  ARRIVE and Gold Standard Publication Checklist (GSPC) for animal studies 50 Literature 51 Altman,D.G. (1991): Practical statistics for medical research. Chapman and Hall, London, Glasgow, New York. Cochran,W.G. and Cox,G.M. (1957): Experimental designs. John Wiley & Sons, Inc., New York, London. Cox,D.R. (1958): Planning experiments. John Wiley and Sons, New York. Cox DR, Reid N. The theory of the design of experiments. Boca Raton, Florida: Chapman and Hall/CRC Press, 2000. Festing,M.F.W., Overend,P., Gaines Das,R., Cortina Borja,M., and Berdoy,M. (2002): The Design of Animal Experiments. Laboratory Animals Ltd., London. Fisher RA. The design of experiments. New York: Hafner Publishing Company, Inc, 1960 Howell,D.C. (1999): Fundamental Statistics for the Behavioral Sciences. Duxbury Press, PacificGrove, London, New York. Friedman, L.M., Furburg, C.D. and DeMets, D.L. (2010) Clinical Trials, 4th. edn.,Springer Maxwell,S.E. and Delaney,H.D. (1989): Designing experiments and analyzing data. Wadsworth Publishing Company, Belmont, California. Mead,R. (1988): The design of experiments. Cambridge University Press, Cambridge, New York. Montgomery,D.C. (1997): Design and analysis of experiments. Wiley, New York. Ruxton GD, Colegrave N. Experimental design for the life sciences. 3rd edn. Oxford: Oxford University Press, 2010. Conclusions  Basic principles of experimental design are universal  Absence of bias  High power  Wide range of generality  Simple  Amenable to a statistical analysis  But each discipline has different priorities  Clinical trials often large and simple  Animal, agricultural and industrial research often small and complex (factorial designs common)  For anyone planning animal research:  www.3Rs-reduction.co.uk 52