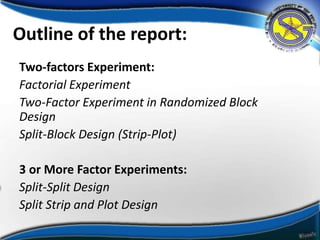
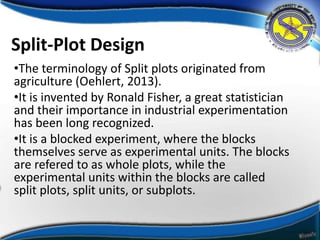
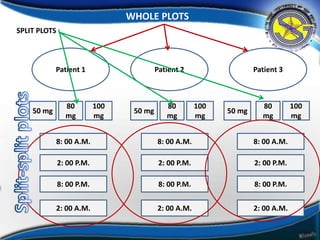
Two-Factors Experiment and Three
or More Factor Experiments
Research Seminar I (RH 630)
Dr. Loreto V. Jao
Presented by:
Mary Anne Portuguez
MP-IP-1
Outline of the report:
Two-factors Experiment:
Factorial Experiment
Two-Factor Experiment in Randomized Block
Design
Split-Block Design (Strip-Plot)
3 or More Factor Experiments:
Split-Split Design
Split Strip and Plot Design
Factor
•In analysis of variance, the variable (independent
or quasi-independent) that designates the groups
being compared (Gravetter & Wallnau, 2012).
•A factor is a general type or category of
treatments (Easton & McColl, 2004).
Factorial Experiment
•A research study that involves more than one
factor (Gravetter & Wallnau, 2012).
•One in which all possible combinations of the
selected values of each of the independent
variables are used (McGuigan, 1990).
•An experimental series in which the effects of
several experimental variables are assessed
(Chaplin, 1986).
Illustration
Consider an experiment that was conducted on learning during
hypnosis. These two independent variables are (1) whether the
participants are hypnotized and (2) high or low susceptibility to
being hypnotized.
There are four possible combinations of the
values of the IV. Each represented in a box.
Advantages
1. More precision on each factor than with single
factor experimentation.
2. Broadening the scope of an experiment.
3. Possible to estimate the interaction effect.
4. Good for exploratory work where we wish to
find the most important factor or the optimal
level of a factor (or combination of levels of more
than one factor).
Disadvantages:
1. Some people say it’s complex.
2. With a number of factors each at
several levels, the experiment can
become very large.
Randomized Block Design
(Stratified Random Sampling)
•Constructed to reduce the noise or variance in
the data.
•They require that the researcher divide the
sample into relatively homogeneous subgroups or
blocks.
•Block refers to homogenous experimental unit
which is analogous to strata.
How Blocking Reduces Noise
•It reduces
variability of
the sample
•You are
ensured that
it has stronger
treatment
effect
Split-Plot Design
•The terminology of Split plots originated from
agriculture (Oehlert, 2013).
•It is invented by Ronald Fisher, a great statistician
and their importance in industrial experimentation
has been long recognized.
•It is a blocked experiment, where the blocks
themselves serve as experimental units. The blocks
are refered to as whole plots, while the
experimental units within the blocks are called
split plots, split units, or subplots.
Patient 1 Patient 3Patient 2
50 mg
80
mg
100
mg
50 mg
80
mg
100
mg
50 mg
80
mg
100
mg
WHOLE PLOTS
SPLIT PLOTS
Why use of Split-plot?
•Cost
•Efficiency
•Validity
For
Randomized
Block Design
SPLIT-SPLIT PLOTS
•An extension of split-plot.
•In split-split plot design, there are two
restrictions of randomization.
Patient 1 Patient 3Patient 2
50 mg
80
mg
100
mg
50 mg
80
mg
100
mg
50 mg
80
mg
100
mg
8: 00 A.M.
2: 00 P.M.
8: 00 P.M.
2: 00 A.M.
8: 00 A.M.
2: 00 P.M.
8: 00 P.M.
2: 00 A.M.
8: 00 A.M.
2: 00 P.M.
8: 00 P.M.
2: 00 A.M.
WHOLE PLOTS
SPLIT PLOTS
Recap
One way to think about split plots is that
the units have a structure somewhat like
that of nested factorial treatments. In a split
plot, the split plots are nested in whole
plots; in a split-split plot, the split-split plots
are nested in split plots, which are
themselves nested in whole plots. In the
split-plot design, levels of different factors
are assigned to the different kinds of units.
Strip-Split-Plot Design
•It has an extensive application in the
agricultural sciences, but it finds occasional use
in industrial experimentation.
•Factor A is applied to whole plots then factor B
is applied to strips (which are just another set of
whole plots) which are not important to the
original whole plots.
Sample Problem: From Gary Oehlert “A First Course in Design and
Analysis of Experiments (2010)”
Machine shop
Consider a machine shop that is producing parts cut from metal
blanks. The quality of the parts is determined by their strength
and fidelity to the desired shape. The shop wishes to determine
how brand of cutting tool and sup plier of metal blank affect
the quality. An experiment will be performed one week, and
then repeated the next week. Four brands of cutting tools will
be obtained, and brand of tool will be randomly assigned to
four lathes. A different supplier of metal blank will be randomly
selected for each of the 5 work days during the week. That way,
all brand-supplier combinations are observed.
Strip Plots are easier to use in
this example.
The strip plot arises through ease-of-use
considerations.It is easier to use one brand of tool
on each lathe than it is to change. Simi larly, it is
easier to use one supplier all day than to change
suppliers during the day. When units are large and
treatments difficult to change, but the units and
treatments can cross, a strip plot can be the design
of choice.
References:
•Chaplin, J.P.(1986). Dictionary of psychology. Bantam Dell: Canada.
•Gravetter, F.J. & Wallnau, L.B. (2012). Statistics for behavioral sciences. Philippines:
Cengage Learning Asia Pte. Ltd.
•McGuigan, F.J. (1990). Experimental psychology (5th ed.). Englewood Cliffs, New Jersey:
Prentice Hall.
•Montgomery, D.C. (2001). Design and analysis of experiments. (5th ed.). USA: John Wiley &
Sons, Inc.
•Jones, B. (2009 October). Split-plots: What, why, and how. Journal of Quality
Technology. 41 (4).
•Oehlert, G.W. (2010). A first course in design and analysis of Experiments. Minitab, Inc.
•Oehlert, G.W. Split Plots. Retrieved from
http://users.stat.umn.edu/~gary/classes/5303/lectures/SplitPlots.pdf as of July 9, 2014.
•Easton, V.J. & McColl, J.H. (2004). Statistics glossary. Retrieved from
http://www.stats.gla.ac.uk/steps/glossary/anova.html#treatment as of July 8, 2014.
•Factorial experiment. Retrieved from
http://www.stat.ncsu.edu/people/nelson/courses/st512/Factorial%20Experiments.pdf
as of July 8, 2014.
•Randomized block design. Retrieved from
http://www.socialresearchmethods.net/kb/expblock.php as of July 8, 2014.
Two-Factor Experiment and Three or More Factor Experiments

Two-Factor Experiment and Three or More Factor Experiments

  • 1.
    Two-Factors Experiment andThree or More Factor Experiments Research Seminar I (RH 630) Dr. Loreto V. Jao Presented by: Mary Anne Portuguez MP-IP-1
  • 2.
    Outline of thereport: Two-factors Experiment: Factorial Experiment Two-Factor Experiment in Randomized Block Design Split-Block Design (Strip-Plot) 3 or More Factor Experiments: Split-Split Design Split Strip and Plot Design
  • 3.
    Factor •In analysis ofvariance, the variable (independent or quasi-independent) that designates the groups being compared (Gravetter & Wallnau, 2012). •A factor is a general type or category of treatments (Easton & McColl, 2004).
  • 4.
    Factorial Experiment •A researchstudy that involves more than one factor (Gravetter & Wallnau, 2012). •One in which all possible combinations of the selected values of each of the independent variables are used (McGuigan, 1990). •An experimental series in which the effects of several experimental variables are assessed (Chaplin, 1986).
  • 5.
    Illustration Consider an experimentthat was conducted on learning during hypnosis. These two independent variables are (1) whether the participants are hypnotized and (2) high or low susceptibility to being hypnotized.
  • 6.
    There are fourpossible combinations of the values of the IV. Each represented in a box.
  • 7.
    Advantages 1. More precisionon each factor than with single factor experimentation. 2. Broadening the scope of an experiment. 3. Possible to estimate the interaction effect. 4. Good for exploratory work where we wish to find the most important factor or the optimal level of a factor (or combination of levels of more than one factor).
  • 8.
    Disadvantages: 1. Some peoplesay it’s complex. 2. With a number of factors each at several levels, the experiment can become very large.
  • 9.
    Randomized Block Design (StratifiedRandom Sampling) •Constructed to reduce the noise or variance in the data. •They require that the researcher divide the sample into relatively homogeneous subgroups or blocks. •Block refers to homogenous experimental unit which is analogous to strata.
  • 11.
    How Blocking ReducesNoise •It reduces variability of the sample •You are ensured that it has stronger treatment effect
  • 12.
    Split-Plot Design •The terminologyof Split plots originated from agriculture (Oehlert, 2013). •It is invented by Ronald Fisher, a great statistician and their importance in industrial experimentation has been long recognized. •It is a blocked experiment, where the blocks themselves serve as experimental units. The blocks are refered to as whole plots, while the experimental units within the blocks are called split plots, split units, or subplots.
  • 13.
    Patient 1 Patient3Patient 2 50 mg 80 mg 100 mg 50 mg 80 mg 100 mg 50 mg 80 mg 100 mg WHOLE PLOTS SPLIT PLOTS
  • 14.
    Why use ofSplit-plot? •Cost •Efficiency •Validity
  • 15.
  • 16.
    SPLIT-SPLIT PLOTS •An extensionof split-plot. •In split-split plot design, there are two restrictions of randomization.
  • 17.
    Patient 1 Patient3Patient 2 50 mg 80 mg 100 mg 50 mg 80 mg 100 mg 50 mg 80 mg 100 mg 8: 00 A.M. 2: 00 P.M. 8: 00 P.M. 2: 00 A.M. 8: 00 A.M. 2: 00 P.M. 8: 00 P.M. 2: 00 A.M. 8: 00 A.M. 2: 00 P.M. 8: 00 P.M. 2: 00 A.M. WHOLE PLOTS SPLIT PLOTS
  • 18.
    Recap One way tothink about split plots is that the units have a structure somewhat like that of nested factorial treatments. In a split plot, the split plots are nested in whole plots; in a split-split plot, the split-split plots are nested in split plots, which are themselves nested in whole plots. In the split-plot design, levels of different factors are assigned to the different kinds of units.
  • 19.
    Strip-Split-Plot Design •It hasan extensive application in the agricultural sciences, but it finds occasional use in industrial experimentation. •Factor A is applied to whole plots then factor B is applied to strips (which are just another set of whole plots) which are not important to the original whole plots.
  • 20.
    Sample Problem: FromGary Oehlert “A First Course in Design and Analysis of Experiments (2010)” Machine shop Consider a machine shop that is producing parts cut from metal blanks. The quality of the parts is determined by their strength and fidelity to the desired shape. The shop wishes to determine how brand of cutting tool and sup plier of metal blank affect the quality. An experiment will be performed one week, and then repeated the next week. Four brands of cutting tools will be obtained, and brand of tool will be randomly assigned to four lathes. A different supplier of metal blank will be randomly selected for each of the 5 work days during the week. That way, all brand-supplier combinations are observed.
  • 22.
    Strip Plots areeasier to use in this example. The strip plot arises through ease-of-use considerations.It is easier to use one brand of tool on each lathe than it is to change. Simi larly, it is easier to use one supplier all day than to change suppliers during the day. When units are large and treatments difficult to change, but the units and treatments can cross, a strip plot can be the design of choice.
  • 23.
    References: •Chaplin, J.P.(1986). Dictionaryof psychology. Bantam Dell: Canada. •Gravetter, F.J. & Wallnau, L.B. (2012). Statistics for behavioral sciences. Philippines: Cengage Learning Asia Pte. Ltd. •McGuigan, F.J. (1990). Experimental psychology (5th ed.). Englewood Cliffs, New Jersey: Prentice Hall. •Montgomery, D.C. (2001). Design and analysis of experiments. (5th ed.). USA: John Wiley & Sons, Inc. •Jones, B. (2009 October). Split-plots: What, why, and how. Journal of Quality Technology. 41 (4). •Oehlert, G.W. (2010). A first course in design and analysis of Experiments. Minitab, Inc. •Oehlert, G.W. Split Plots. Retrieved from http://users.stat.umn.edu/~gary/classes/5303/lectures/SplitPlots.pdf as of July 9, 2014. •Easton, V.J. & McColl, J.H. (2004). Statistics glossary. Retrieved from http://www.stats.gla.ac.uk/steps/glossary/anova.html#treatment as of July 8, 2014. •Factorial experiment. Retrieved from http://www.stat.ncsu.edu/people/nelson/courses/st512/Factorial%20Experiments.pdf as of July 8, 2014. •Randomized block design. Retrieved from http://www.socialresearchmethods.net/kb/expblock.php as of July 8, 2014.