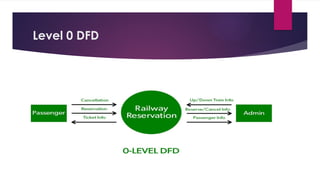
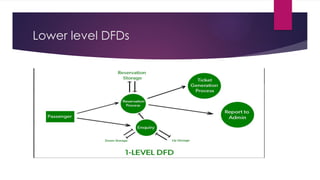
Data flow diagram
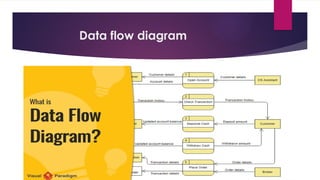
DFDis the abbreviation for Data Flow Diagram. The flow of data of a
system or a process is represented by DFD. It also gives insight into the
inputs and outputs of each entity and the process itself. DFD does not
have control flow and no loops or decision rules are present. Specific
operations depending on the type of data can be explained by a
flowchart. It is a graphical tool, useful for communicating with
users ,managers and other personnel. it is useful for analyzing existing
as well as proposed system.
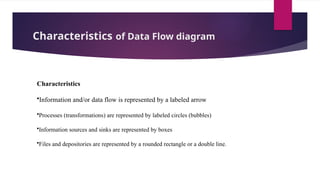
Characteristics of DataFlow diagram
Characteristics
•Information and/or data flow is represented by a labeled arrow
•Processes (transformations) are represented by labeled circles (bubbles)
•Information sources and sinks are represented by boxes
•Files and depositories are represented by a rounded rectangle or a double line.
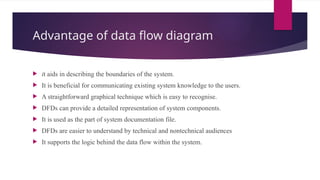
Advantage of dataflow diagram
it aids in describing the boundaries of the system.
It is beneficial for communicating existing system knowledge to the users.
A straightforward graphical technique which is easy to recognise.
DFDs can provide a detailed representation of system components.
It is used as the part of system documentation file.
DFDs are easier to understand by technical and nontechnical audiences
It supports the logic behind the data flow within the system.
10.
disadvantage of dataflow diagram
It make the programmers little confusing concerning the system.
The biggest drawback of the DFD is that it simply takes a long time
to create, so long that the analyst may not receive support from
management to complete it.
Physical considerations are left out.