Download to read offline


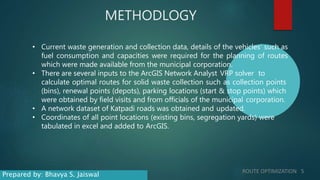
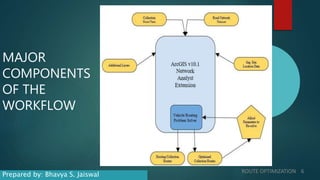
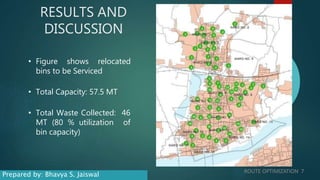
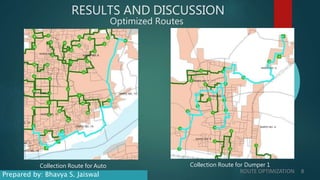

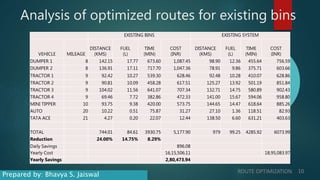
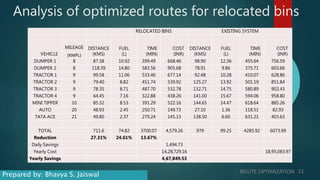
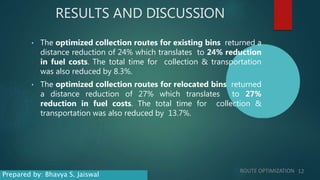


This document discusses route optimization techniques for collecting municipal solid waste in Katpadi, India. It presents the objectives, methodology, and results of optimizing waste collection routes. The methodology uses ArcGIS Network Analyst to calculate optimal routes based on collection points, depots, and vehicle details. The optimized routes reduced distance traveled by 24-27%, fuel costs by 24-27%, and collection time by 8.3-13.7% compared to existing routes. Route optimization can benefit other city services that make multiple stops, such as public transportation.


