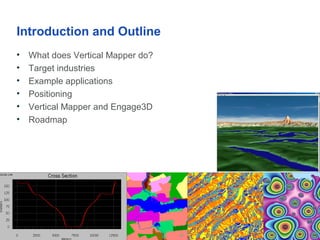
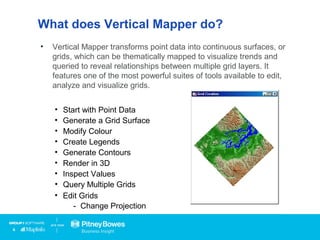
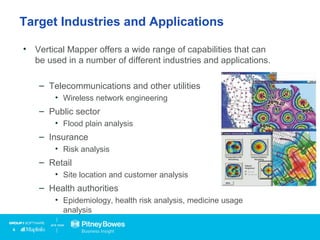
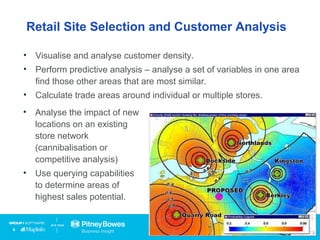
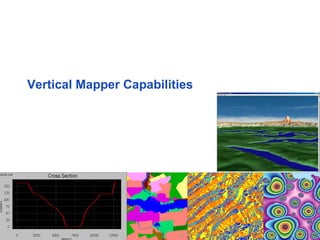
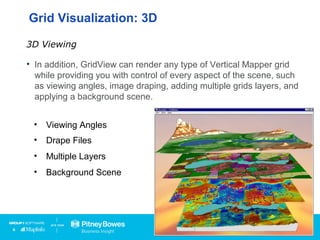
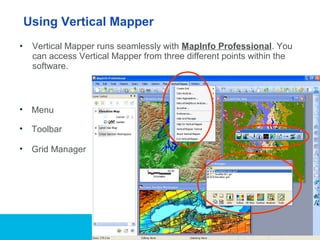
Exploring New Dimensions with Vertical Mapper
Tom Probert
EMEA Desktop Product Marketing Manager
February 2010
A presentation on the basic capabilities and
applications of Vertical Mapper
Disclaimer
• This presentation contains Pitney Bowes Business Insight forward
looking statements
• Road map information and final implementation details and delivery
dates are subject to change without prior notice
Introduction and Outline
• What does Vertical Mapper do?
• Target industries
• Example applications
• Positioning
• Vertical Mapper and Engage3D
• Roadmap
What does Vertical Mapper do?
• Vertical Mapper transforms point data into continuous surfaces, or
grids, which can be thematically mapped to visualize trends and
queried to reveal relationships between multiple grid layers. It
features one of the most powerful suites of tools available to edit,
analyze and visualize grids.
• Start with Point Data
• Generate a Grid Surface
• Modify Colour
• Create Legends
• Generate Contours
• Render in 3D
• Inspect Values
• Query Multiple Grids
• Edit Grids
- Change Projection
Click
Target Industries and Applications
• Vertical Mapper offers a wide range of capabilities that can
be used in a number of different industries and applications.
– Telecommunications and other utilities
• Wireless network engineering
– Public sector
• Flood plain analysis
– Insurance
• Risk analysis
– Retail
• Site location and customer analysis
– Health authorities
• Epidemiology, health risk analysis, medicine usage
analysis
Wireless Network Engineering
• Determine if line of sight exists between microwave links on towers.
– Determine required height of microwave link to achieve line of sight.
• Calculate “viewshed” of a tower to determine visibility with other
towers.
• Analyse the strength of signal coverage with respect to customer or
demographic data.
• Analyse the location of
customer issues (“trouble
tickets”) with respect to the
network.
• Compare predicted signal
strength with drive test data.
Retail Site Selection and Customer Analysis
• Visualise and analyse customer density.
• Perform predictive analysis – analyse a set of variables in one area
find those other areas that are most similar.
• Calculate trade areas around individual or multiple stores.
• Analyse the impact of new
locations on an existing
store network
(cannibalisation or
competitive analysis)
• Use querying capabilities
to determine areas of
highest sales potential.
Insurance Risk Analysis
• Analyse risk
exposure in various
types of disaster
scenarios.
• Improve underwriting
decisions on policies
by analysing
proximity to risk
factors.
The Role of Vertical Mapper
• Vertical Mapper adds complete raster grid based capabilities to
MapInfo Professional.
– Comprehensive grid creation capabilities
– Powerful and flexible grid analysis and visualisation
• Tightly integrated with MapInfo Professional.
– “Best of both worlds” – MapInfo Professional’s vector based
analytical capabilities and Vertical Mapper’s raster based
capabilities work seamlessly together.
• Very powerful feature set for a very reasonable price.
Vertical Mapper Capabilities
• You can create a grid in Vertical Mapper in a number of different ways:
• Interpolation
• Modeling
• Vector to Grid Conversion
• Importing
• Point Density
• Create grids from
images
Grid Creation
Grid Creation - Interpolation
• Vertical Mapper interpolation techniques are used in different
industry sectors.
Interpolating Numeric Grids
Health Care
Data on the blood lead levels
of children can be interpolated
to show risk areas.
Telecommunications
Drive test data can be
interpolated to show where
mobile phones can obtain a
signal.
Weather Forecasting
Temperature readings at
weather stations can be
interpolated to show changes
in air temperature.
Grid Creation – Classified Grids
Raster
Create grids from raster images
• Import Raster Data as Vertical Mapper Grid
– Example 1: Calculate the area of RF signal coverage from an
image
GridContour
Create grids from raster images
• Import Raster Data as Vertical Mapper Grid
– Example 2: Calculate the total roof area from an aerial photo
GridRaster Query
ContourSmooth Final
Grid Creation
• The ability to import a variety of grid formats enhances the
flexibility of Vertical Mapper. The import utility can auto-detect
and convert these commonly used grid formats.
Importing
• ArcGrid ASCII Export
• ASCII Classified Grid
• CRC-500
• Geological Survey of
Canada Grid
• DTED
• CDED
• GeoSoft
• MONA
• UK Ordnance
Survey Grid
• USGS DEM
• SDTS
• MapInfo Grid
Grid Visualization
• Vertical Mapper provides many ways of modifying the display of
a grid—from simply changing the colours to rendering the grid in
3D.
• Modifying Grid Colours
• Contouring
• Cross Sections
• 3D Viewing
• Grid Calculations
• Slope and Aspect
Grid Visualization and Analysis
Contours can be generated
from any type of grid. This
example has used elevation
data.
Contour Lines and
Regions
Grid Visualisation and Analysis
You can analyze a grid by
calculating statistics on grid
values that fall under a
given point, along a line or
within a region.
In this example, tornado
density values for the state
of Texas are examined. In
addition, the coordinate
location of the maximum
and minimum values are
provided.
Point, Line and Region Inspection
Click
Grid Visualisation and Analysis
Here are some examples of
how Vertical Mapper can
return information about a line
object.
Point, Line and Region Inspection
Grid Visualisation and Analysis
Grid Querying
Grid Visualisation and Analysis
Grid Querying
Grid Visualisation and Analysis
• In a viewshed analysis a single location is chosen as the viewing location
from which you calculate those areas that are visible and invisible to this
location.
Viewpoint Analysis
• Elevation
• Tower Location
• Viewshed Creation
• Viewshed Legend
• Viewable Area Only
Tower
Location
In this map, the blue symbol in the centre represents
tower or viewpoint location. The green polygon
represents the viewable area from the tower.
Grid Visualisation and Analysis
Slope and Aspect
Slope
Aspect
Slope = steepness/gradient
Aspect = the direction the grid
cell is facing
Grid Visualisation and Analysis
In a point-to-point analysis you
specify two viewing locations.
Vertical Mapper not only
determines if locations are
intervisible but also what
changes are required to make
locations intervisible. The results
can be shown on a map or in a
graph.
Point-to-Point Analysis
Tower
LocationsStart
Line
Here
End
Line
Here
Grid Visualization: 3D
The Vertical Mapper GridView
module enables you to render
grids in 3D. This type of
visualization is commonly used
to present elevation information.
3D Viewing
• In addition, GridView can render any type of Vertical Mapper grid
while providing you with control of every aspect of the scene, such
as viewing angles, image draping, adding multiple grids layers, and
applying a background scene.
3D Viewing
• Viewing Angles
• Drape Files
• Multiple Layers
• Background Scene
Grid Visualization: 3D
• Vertical Mapper runs seamlessly with MapInfo Professional. You
can access Vertical Mapper from three different points within the
software.
Using Vertical Mapper
• Menu
• Grid Manager
• Toolbar
Differences between Vertical Mapper
and MapInfo Professional
• MapInfo Professional offers a very limited set of grid creation and
visualisation capabilities (grid thematic map)
– Limited methods to build the grid and limited control
over the results. Visualisation only, no analytical capabilities.
• Vertical Mapper offers more robust grid creation and visualisation
capabilities as well as analysis and data management
capabilities.
– More methods to create grids.
• Interpolation, point density, importing, raster to grid conversion,
location profiler and grid models.
• Support for both classified grids and numeric grids.
– A variety of ways to analyse and query grids.
– Tools for managing grid data
Custom Applications with Vertical Mapper
• VM SDK
– C based API
– Can be called from MapBasic
• “Include” files make the VM capabilities easy to use in a
MapBasic application
• Sample applications
• VM SDK is supported for desktop deployments only.
– Our MapXtreme 2008 developer kit does offer some grid
creation and visualisation capabilities.
Tom Probert
EMEA Desktop Product Marketing Manager
tom.probert@pb.com
More information:
Vertical Mapper:
http://www.pbinsight.com/verticalmapper

Explore new dimensions with MapInfo Vertical Mapper

  • 1.
    Exploring New Dimensionswith Vertical Mapper Tom Probert EMEA Desktop Product Marketing Manager February 2010 A presentation on the basic capabilities and applications of Vertical Mapper
  • 2.
    Disclaimer • This presentationcontains Pitney Bowes Business Insight forward looking statements • Road map information and final implementation details and delivery dates are subject to change without prior notice
  • 3.
    Introduction and Outline •What does Vertical Mapper do? • Target industries • Example applications • Positioning • Vertical Mapper and Engage3D • Roadmap
  • 4.
    What does VerticalMapper do? • Vertical Mapper transforms point data into continuous surfaces, or grids, which can be thematically mapped to visualize trends and queried to reveal relationships between multiple grid layers. It features one of the most powerful suites of tools available to edit, analyze and visualize grids. • Start with Point Data • Generate a Grid Surface • Modify Colour • Create Legends • Generate Contours • Render in 3D • Inspect Values • Query Multiple Grids • Edit Grids - Change Projection Click
  • 5.
    Target Industries andApplications • Vertical Mapper offers a wide range of capabilities that can be used in a number of different industries and applications. – Telecommunications and other utilities • Wireless network engineering – Public sector • Flood plain analysis – Insurance • Risk analysis – Retail • Site location and customer analysis – Health authorities • Epidemiology, health risk analysis, medicine usage analysis
  • 6.
    Wireless Network Engineering •Determine if line of sight exists between microwave links on towers. – Determine required height of microwave link to achieve line of sight. • Calculate “viewshed” of a tower to determine visibility with other towers. • Analyse the strength of signal coverage with respect to customer or demographic data. • Analyse the location of customer issues (“trouble tickets”) with respect to the network. • Compare predicted signal strength with drive test data.
  • 7.
    Retail Site Selectionand Customer Analysis • Visualise and analyse customer density. • Perform predictive analysis – analyse a set of variables in one area find those other areas that are most similar. • Calculate trade areas around individual or multiple stores. • Analyse the impact of new locations on an existing store network (cannibalisation or competitive analysis) • Use querying capabilities to determine areas of highest sales potential.
  • 8.
    Insurance Risk Analysis •Analyse risk exposure in various types of disaster scenarios. • Improve underwriting decisions on policies by analysing proximity to risk factors.
  • 9.
    The Role ofVertical Mapper • Vertical Mapper adds complete raster grid based capabilities to MapInfo Professional. – Comprehensive grid creation capabilities – Powerful and flexible grid analysis and visualisation • Tightly integrated with MapInfo Professional. – “Best of both worlds” – MapInfo Professional’s vector based analytical capabilities and Vertical Mapper’s raster based capabilities work seamlessly together. • Very powerful feature set for a very reasonable price.
  • 10.
  • 11.
    • You cancreate a grid in Vertical Mapper in a number of different ways: • Interpolation • Modeling • Vector to Grid Conversion • Importing • Point Density • Create grids from images Grid Creation
  • 12.
    Grid Creation -Interpolation • Vertical Mapper interpolation techniques are used in different industry sectors. Interpolating Numeric Grids Health Care Data on the blood lead levels of children can be interpolated to show risk areas. Telecommunications Drive test data can be interpolated to show where mobile phones can obtain a signal. Weather Forecasting Temperature readings at weather stations can be interpolated to show changes in air temperature.
  • 13.
    Grid Creation –Classified Grids
  • 14.
    Raster Create grids fromraster images • Import Raster Data as Vertical Mapper Grid – Example 1: Calculate the area of RF signal coverage from an image GridContour
  • 15.
    Create grids fromraster images • Import Raster Data as Vertical Mapper Grid – Example 2: Calculate the total roof area from an aerial photo GridRaster Query ContourSmooth Final
  • 16.
    Grid Creation • Theability to import a variety of grid formats enhances the flexibility of Vertical Mapper. The import utility can auto-detect and convert these commonly used grid formats. Importing • ArcGrid ASCII Export • ASCII Classified Grid • CRC-500 • Geological Survey of Canada Grid • DTED • CDED • GeoSoft • MONA • UK Ordnance Survey Grid • USGS DEM • SDTS • MapInfo Grid
  • 17.
    Grid Visualization • VerticalMapper provides many ways of modifying the display of a grid—from simply changing the colours to rendering the grid in 3D. • Modifying Grid Colours • Contouring • Cross Sections • 3D Viewing • Grid Calculations • Slope and Aspect
  • 18.
    Grid Visualization andAnalysis Contours can be generated from any type of grid. This example has used elevation data. Contour Lines and Regions
  • 19.
    Grid Visualisation andAnalysis You can analyze a grid by calculating statistics on grid values that fall under a given point, along a line or within a region. In this example, tornado density values for the state of Texas are examined. In addition, the coordinate location of the maximum and minimum values are provided. Point, Line and Region Inspection Click
  • 20.
    Grid Visualisation andAnalysis Here are some examples of how Vertical Mapper can return information about a line object. Point, Line and Region Inspection
  • 21.
    Grid Visualisation andAnalysis Grid Querying
  • 22.
    Grid Visualisation andAnalysis Grid Querying
  • 23.
    Grid Visualisation andAnalysis • In a viewshed analysis a single location is chosen as the viewing location from which you calculate those areas that are visible and invisible to this location. Viewpoint Analysis • Elevation • Tower Location • Viewshed Creation • Viewshed Legend • Viewable Area Only Tower Location In this map, the blue symbol in the centre represents tower or viewpoint location. The green polygon represents the viewable area from the tower.
  • 24.
    Grid Visualisation andAnalysis Slope and Aspect Slope Aspect Slope = steepness/gradient Aspect = the direction the grid cell is facing
  • 25.
    Grid Visualisation andAnalysis In a point-to-point analysis you specify two viewing locations. Vertical Mapper not only determines if locations are intervisible but also what changes are required to make locations intervisible. The results can be shown on a map or in a graph. Point-to-Point Analysis Tower LocationsStart Line Here End Line Here
  • 26.
    Grid Visualization: 3D TheVertical Mapper GridView module enables you to render grids in 3D. This type of visualization is commonly used to present elevation information. 3D Viewing
  • 27.
    • In addition,GridView can render any type of Vertical Mapper grid while providing you with control of every aspect of the scene, such as viewing angles, image draping, adding multiple grids layers, and applying a background scene. 3D Viewing • Viewing Angles • Drape Files • Multiple Layers • Background Scene Grid Visualization: 3D
  • 28.
    • Vertical Mapperruns seamlessly with MapInfo Professional. You can access Vertical Mapper from three different points within the software. Using Vertical Mapper • Menu • Grid Manager • Toolbar
  • 29.
    Differences between VerticalMapper and MapInfo Professional • MapInfo Professional offers a very limited set of grid creation and visualisation capabilities (grid thematic map) – Limited methods to build the grid and limited control over the results. Visualisation only, no analytical capabilities. • Vertical Mapper offers more robust grid creation and visualisation capabilities as well as analysis and data management capabilities. – More methods to create grids. • Interpolation, point density, importing, raster to grid conversion, location profiler and grid models. • Support for both classified grids and numeric grids. – A variety of ways to analyse and query grids. – Tools for managing grid data
  • 30.
    Custom Applications withVertical Mapper • VM SDK – C based API – Can be called from MapBasic • “Include” files make the VM capabilities easy to use in a MapBasic application • Sample applications • VM SDK is supported for desktop deployments only. – Our MapXtreme 2008 developer kit does offer some grid creation and visualisation capabilities.
  • 31.
    Tom Probert EMEA DesktopProduct Marketing Manager tom.probert@pb.com More information: Vertical Mapper: http://www.pbinsight.com/verticalmapper

Editor's Notes

  • #2 Presentation Title Slide Type Specifications: Presentation Title should be in Arial Bold, size 16 pt, in White. Title Should appear in all Caps Subtitle section should be in Trebuchet MS Bold, Size13 pt, in White. This piece may include: Presenter’s name, title, company and date – No other content should appear in this section, however all pieces need not be present
  • #4 Short Copy/Statement Slide Type Specifications: Slide Title should be in Arial Bold, size 18 pt, in Black. Title Should appear in all Caps. Copy should be no more than 4 lines of text. Should be in Trebuchet MS, size 18 pt, in Orange – RGB Values 97-27-0