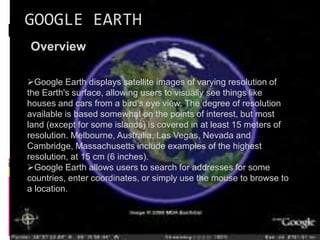
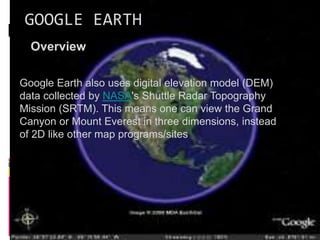
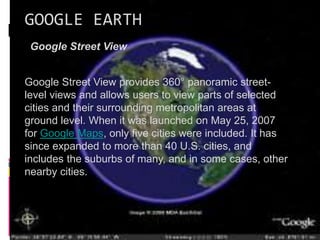
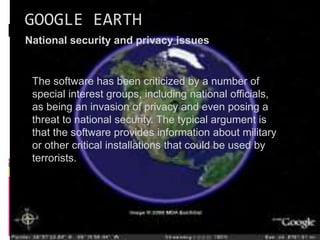
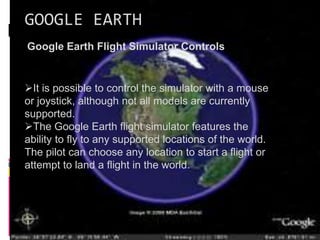
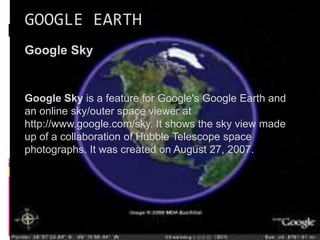
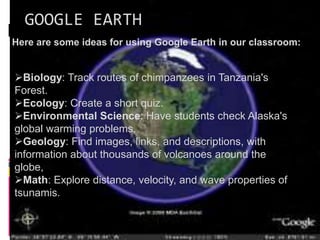
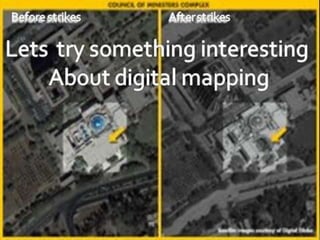
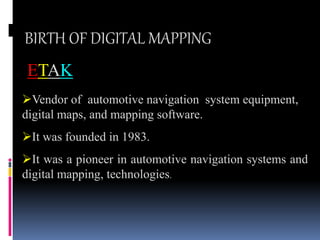
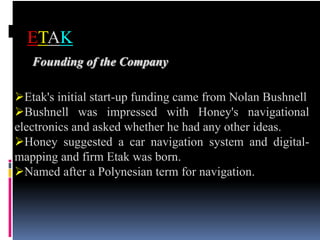
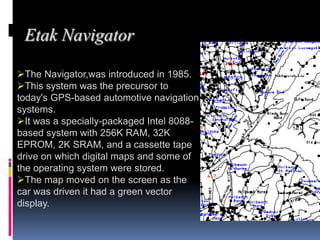
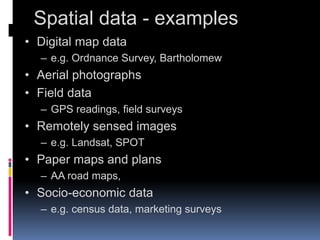
Digital mapping involves converting traditional paper maps into digital formats. Etak was a pioneer in digital mapping and automotive navigation systems. It was founded in 1983 and created the first digital maps and navigation system for cars called the Etak Navigator in 1985. Over time, digital mapping has expanded and improved, allowing for applications like tracking diseases and monitoring natural disasters. Issues remain around data sharing and costs, but digital mapping provides important benefits for research, emergency response, and more. Google Earth further advanced digital mapping by providing satellite imagery and street views of locations around the world, though it also raised privacy and security concerns for some.


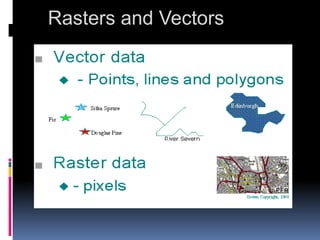
![Vector data - points, lines and
areas
Points - x,y co-ordinates
representing individual
points e.g. trees
Lines - sets of points
representing linear
features e.g. roads,
rivers
Areas - closed set of lines
such as woodlands or a city
boundary
Area
[x1,y1]
[x2,y2]
[x3,y3]
Line
[x1,y1]
[x2,y2]
[x3,y3]
[x4,y4]
[x5,y5]
[x6,y6]
Point
[x1,y1]](https://image.slidesharecdn.com/digitalmappimg-240111133354-f8a0c423/85/Introduction-to-Digital-Mapping-for-UG-Students-18-320.jpg)
![Stumbling blocks
Even with better software and skilled database specialists, GIS
faces further problems. With private companies, non-governmental
organisations and other international players as potential users,
governments still hesitate to make GIS information available in the
public domain, citing security reasons.
But even if GIS maps are shared more widely, there remains the
problem of standardising the data. The same set of data often cannot
be used by different agencies with different needs.
Equally important is the cost.
the price of hardware has come down but the software is still
expensive. He says the poorest countries will be able to afford the
technology if the price is halved.
"There are still grey areas [regarding] governments' national security
concerns, right to privacy of individuals and ethical use of GIS data."](https://image.slidesharecdn.com/digitalmappimg-240111133354-f8a0c423/85/Introduction-to-Digital-Mapping-for-UG-Students-27-320.jpg)