Downloaded 69 times


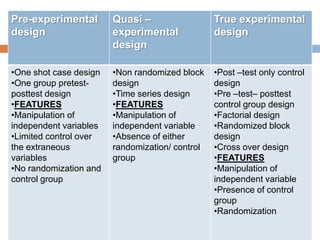


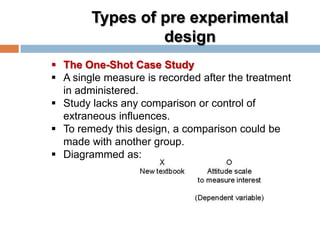


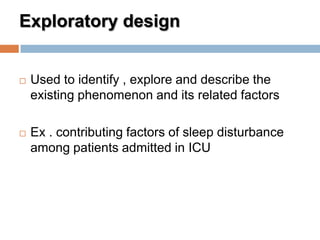
![Prospective Cohort Study
Some have the
factor (c)
Population
(lapse of time)
Begin enquiry here
& work forwards
Sample people
without
the disease
Disease (a)
Disease (b)
No Disease
No Disease
Statistic = Relative Risk [RR] = (a/c) divided by (b/d)
This shows the ratio of incidence in exposed
compared to non-exposed.
RR > 1 implies a hazard;
RR < 1 implies a protective factor
95% CI are usually presented:
e.g., RR = 1.9 (95% CI 1.5, 2.3)
Note: as you begin
with people who do not
have the disease, you
can calculate incidence
but not prevalence.
(Prevalence would be
underestimated as you
omitted existing
cases)
Some do not (d)
Outcomes](https://image.slidesharecdn.com/experimentaldesign-140428002236-phpapp01/85/Experimental-design-63-320.jpg)
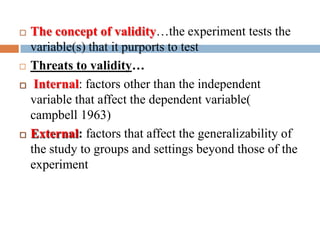
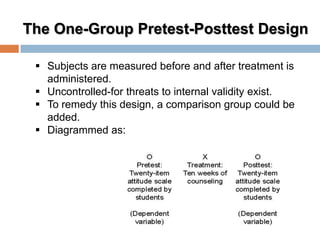
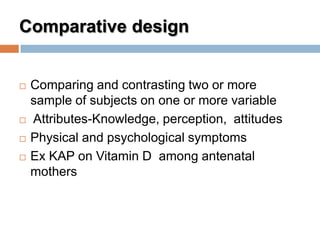
![Retrospective Case-Control Study
Population
Select
Cases
(have the
disease)
Sample of
Controls
(who do not
have the
disease)
Exposed (c)
Exposed (a)
Not Exposed (d)
Not Exposed (b)
Begin enquiry here
& look backwards
Statistic = Odds Ratio [OR] = (a/b) divided by (c/d)
This shows how many times more likely were the cases
to have been exposed than the controls.
OR interpreted in same way as RR
Review
history
Review
history
Note: as you begin
with people who already
have the disease, you
cannot calculate
incidence or prevalence](https://image.slidesharecdn.com/experimentaldesign-140428002236-phpapp01/85/Experimental-design-64-320.jpg)


The document discusses various experimental research designs including completely randomized design, randomized block design, Latin square design, and other designs. It provides definitions and explanations of key concepts in experimental research such as experimental versus control groups, independent and dependent variables, randomization, and threats to internal and external validity. Examples of different types of experimental designs are given, including pre-experimental, quasi-experimental, and true experimental designs. Characteristics and advantages and disadvantages of each design type are also summarized.