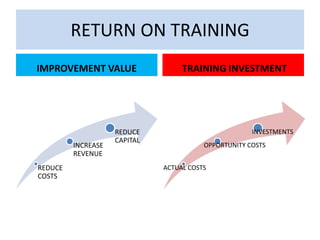
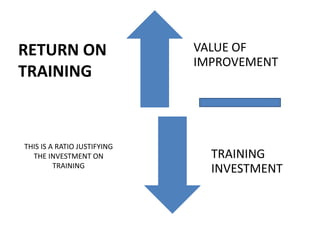
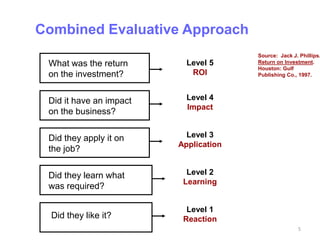
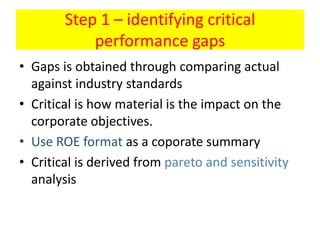
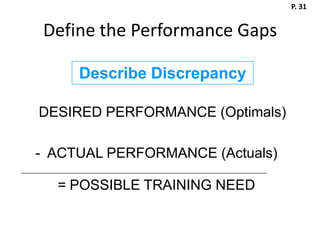
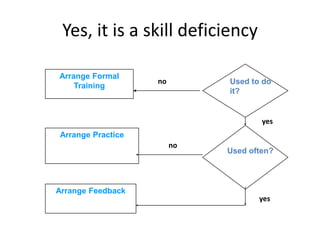
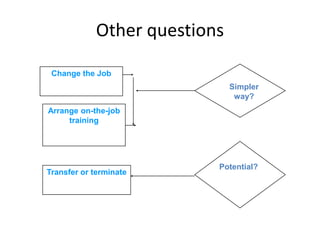
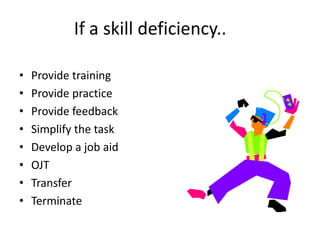
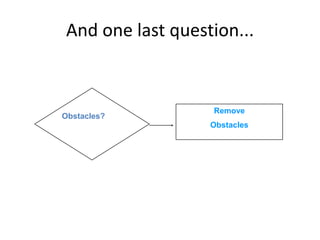
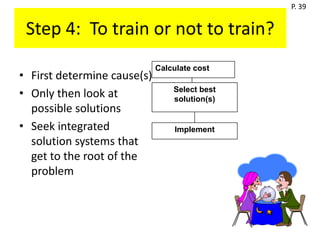
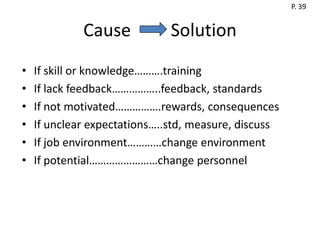
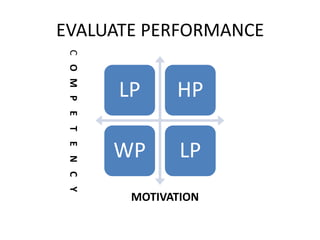
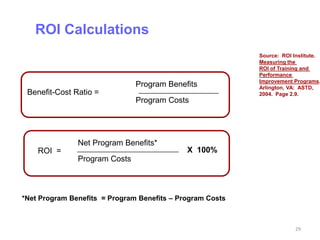
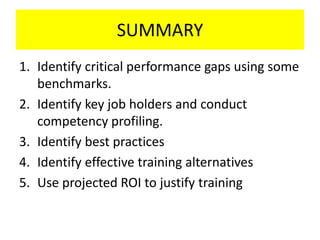
TRAINING NEED ANALYSIS
What is training?
• TRAINING IS TO IMPROVE WORK
  PERFORMANCE
  – ON THE JOB TRAINING OR
  – OFF THE JOB TRAINING
RETURN ON TRAINING
IMPROVEMENT VALUE                  TRAINING INVESTMENT


                    REDUCE                            INVESTMENTS
                    CAPITAL
         INCREASE                        OPPORTUNITY COSTS
         REVENUE
REDUCE                        ACTUAL COSTS
COSTS
RETURN ON                    VALUE OF
                             IMPROVEMENT
TRAINING


THIS IS A RATIO JUSTIFYING
  THE INVESTMENT ON            TRAINING
         TRAINING
                               INVESTMENT
Combined Evaluative Approach
                                       Source: Jack J. Phillips.
 What was the return       Level 5     Return on Investment.
                                       Houston: Gulf
 on the investment?         ROI        Publishing Co., 1997.


 Did it have an impact     Level 4
                           Impact
 on the business?

 Did they apply it on      Level 3
                         Application
 the job?

 Did they learn what       Level 2
                          Learning
 was required?

                           Level 1
  Did they like it?       Reaction
                                                       5
ROI Calculations
                                                           Source: ROI Institute.
                                                           Measuring the
                                                           ROI of Training and
                                                           Performance
                                                           Improvement Programs.
                               Program Benefits            Arlington, VA: ASTD,
 Benefit-Cost Ratio =                                      2004. Page 2.9.
                               Program Costs


               Net Program Benefits*
    ROI =                                    X 100%
               Program Costs


*Net Program Benefits = Program Benefits – Program Costs


                                                                        6
Balanced Scorecard
                                            Source:. Kaplan and
                                            Norton. The Balanced
                                            Scorecard. Boston:
                                            HBS Press, 1996.
                 Financial
                Perspective


                  VISION
   Customer          &         Process
  Perspective   STRATEGY      Perspective


                 Learning
                     &
                  Growth
                Perspective
                                                           7
Balanced Scorecard
                                                  Source: David P. Norton
                                                  Balanced Scorecard
  Balanced Scorecards tell you …..                Report. “Use Strategy
                                                  Maps to Communicate
  the knowledge, skills and systems that          Your Strategy.” Page 169
  your employees will need (their learning
  and growth) …. to innovate and build the
  right strategic capabilities and efficiencies
  (the internal processes) ……that deliver
  specific value to the market (customers),
  ……which will eventually lead to higher
  shareholder value (the financials).


                           Financial
                 Vision
                   &
                Strategy
                           Process
                           Learning & Growth
                           Customer


                                                                  8
McBassi Methodology
• Human Capital Capability Scorecard™— predicts an
  organization’s ability to achieve future business results
  by analyzing data on an array of human capital
  indicators.

• Generates prioritized, fact-based recommendations for
  improving business results through more effective
  development and management of employees.

• Statistically analyzes the relationship between HCCS
  scores (by P&L center, branch, etc.) to identify those
  factors that are the most powerful predictors of an
  organization’s performance

• Serves as a blueprint for creating employee investment
  strategies, and a baseline to evaluate the effectiveness
  of these strategies.
                                                              9
ABA CLO Summit Application

  We modified the Human Capital Capability Scorecard™
  and our data collection to those elements with both of the
  following characteristics:
      - Most relevant to employee development, and
      - Could be provided by a single individual within
        the organization


                                                               10
ABA CLO Summit Results

•   The evidence clearly points to a positive
    relationship between human capital (learning)
    practices and investments, and financial returns.

•   This relationship is most consistent for the
    measure that captures training and development
    expenditures per employee.

•   The financial outcome most consistently
    associated with an array of human capital
    measures is net income per employee.


                                                        11
ABA CLO Summit Sample Results

                             Median Net Income Per FTE (10/02 to 9/03), by Top Half/Bottom Half on Human Capital Variables

                        $80,000
Median Net Income/FTE


                        $60,000

                        $40,000

                        $20,000

                            $0
                                    Resources: T&D Resources: Employee         Average Systems       Average Workforce        Average Learning
                                  Expenditures Per FTE to Trainer Ratio         Maturity Score       Optimization Score        Capacity Score
                                                                          Human Capital Variable


                                               Institutions in Top Half on HC Variable   Institutions in Bottom Half on HC Variable


                                                                                                                                            12
Conclusion


   There is every reason to believe that
   an institution’s increased focus
   on, and commitment to, human capital
   factors, especially learning and
   development, should lead to improved
   financial performance.

    Which side of the fence are you on?


                                           13
Conclusion


   There is every reason to believe that
   an institution’s increased focus
   on, and commitment to, human capital
   factors, especially learning and
   development, should lead to improved
   financial performance.

    Which side of the fence are you on?


                                           14
Step 1 – identifying critical
            performance gaps
• Gaps is obtained through comparing actual
  against industry standards
• Critical is how material is the impact on the
  corporate objectives.
• Use ROE format as a coporate summary
• Critical is derived from pareto and sensitivity
  analysis
P. 31


Define the Performance Gaps

     Describe Discrepancy

DESIRED PERFORMANCE (Optimals)

- ACTUAL PERFORMANCE (Actuals)

  = POSSIBLE TRAINING NEED
P. 34


                  Is it critical?

•   Why is it important?
•   What if you did nothing?
•   How big is it? (Quantify if possible)
•   Who cares?
•   “Is the cost of the discrepancy high
    enough that it seems worth pursuing
    a solution?”
Step 2 - calculate the KPI of each
      critical performance areas
• Calculate KPIs for actual, standards and
  industry
• Compare KPIs to evaluate true performance.
• The KPI may be used in ROI calcualtion.
Step 3 - Analysing further the critical
           performance gaps
• Is it true performance gaps?
• Is the gap caused by factors other than
  competency.
• Benchmarkings to recognise best practices
• Use input output analysis
• Task and subtask analysis
• Interviews, observations, focus
  groups, documentations
Determine Cause(s)

       Is it a problem of skill
                   or
         a problem of will?

    I don’t wanna!
I don’t wanna!
                                  I don’t know
                                  how.
Yes, it is a skill deficiency

Arrange Formal
                   no        Used to do
    Training
                             it?


                                     yes
Arrange Practice
                        no
                             Used often?


Arrange Feedback
                                    yes
Other questions

 Change the Job
                              Simpler
                               way?
Arrange on-the-job
     training


                          Potential?
Transfer or terminate
If a skill deficiency..

•   Provide training
•   Provide practice
•   Provide feedback
•   Simplify the task
•   Develop a job aid
•   OJT
•   Transfer
•   Terminate
And one last question...


                  Remove
Obstacles?
                  Obstacles
P. 39


 Step 4: To train or not to train?
                             Calculate cost
• First determine cause(s)
• Only then look at              Select best
                                 solution(s)
  possible solutions
• Seek integrated                 Implement
  solution systems that
  get to the root of the
  problem
P. 39


             Cause            Solution
•   If skill or knowledge……….training
•   If lack feedback……………..feedback, standards
•   If not motivated…………….rewards, consequences
•   If unclear expectations…..std, measure, discuss
•   If job environment…………change environment
•   If potential……………………change personnel
EVALUATE PERFORMANCE
 C O M P E T E N C Y

                       LP     HP

                       WP      LP
                        MOTIVATION
Step 5 - calculate the ROI training
• The purpose of this step is to justify the
  training BEFORE the training start.
• Calculate the benefits generated by the
  training divided by the capital employed in the
  training.
• We obtain our ROI figures through the input
  output model.
ROI Calculations
                                                           Source: ROI Institute.
                                                           Measuring the
                                                           ROI of Training and
                                                           Performance
                                                           Improvement Programs.
                               Program Benefits            Arlington, VA: ASTD,
 Benefit-Cost Ratio =                                      2004. Page 2.9.
                               Program Costs


               Net Program Benefits*
    ROI =                                    X 100%
               Program Costs


*Net Program Benefits = Program Benefits – Program Costs


                                                                       29
SUMMARY
1. Identify critical performance gaps using some
   benchmarks.
2. Identify key job holders and conduct
   competency profiling.
3. Identify best practices
4. Identify effective training alternatives
5. Use projected ROI to justify training

Evaluate training effectiveness

  • 1.
  • 2.
    What is training? •TRAINING IS TO IMPROVE WORK PERFORMANCE – ON THE JOB TRAINING OR – OFF THE JOB TRAINING
  • 3.
    RETURN ON TRAINING IMPROVEMENTVALUE TRAINING INVESTMENT REDUCE INVESTMENTS CAPITAL INCREASE OPPORTUNITY COSTS REVENUE REDUCE ACTUAL COSTS COSTS
  • 4.
    RETURN ON VALUE OF IMPROVEMENT TRAINING THIS IS A RATIO JUSTIFYING THE INVESTMENT ON TRAINING TRAINING INVESTMENT
  • 5.
    Combined Evaluative Approach Source: Jack J. Phillips. What was the return Level 5 Return on Investment. Houston: Gulf on the investment? ROI Publishing Co., 1997. Did it have an impact Level 4 Impact on the business? Did they apply it on Level 3 Application the job? Did they learn what Level 2 Learning was required? Level 1 Did they like it? Reaction 5
  • 6.
    ROI Calculations Source: ROI Institute. Measuring the ROI of Training and Performance Improvement Programs. Program Benefits Arlington, VA: ASTD, Benefit-Cost Ratio = 2004. Page 2.9. Program Costs Net Program Benefits* ROI = X 100% Program Costs *Net Program Benefits = Program Benefits – Program Costs 6
  • 7.
    Balanced Scorecard Source:. Kaplan and Norton. The Balanced Scorecard. Boston: HBS Press, 1996. Financial Perspective VISION Customer & Process Perspective STRATEGY Perspective Learning & Growth Perspective 7
  • 8.
    Balanced Scorecard Source: David P. Norton Balanced Scorecard Balanced Scorecards tell you ….. Report. “Use Strategy Maps to Communicate the knowledge, skills and systems that Your Strategy.” Page 169 your employees will need (their learning and growth) …. to innovate and build the right strategic capabilities and efficiencies (the internal processes) ……that deliver specific value to the market (customers), ……which will eventually lead to higher shareholder value (the financials). Financial Vision & Strategy Process Learning & Growth Customer 8
  • 9.
    McBassi Methodology • HumanCapital Capability Scorecard™— predicts an organization’s ability to achieve future business results by analyzing data on an array of human capital indicators. • Generates prioritized, fact-based recommendations for improving business results through more effective development and management of employees. • Statistically analyzes the relationship between HCCS scores (by P&L center, branch, etc.) to identify those factors that are the most powerful predictors of an organization’s performance • Serves as a blueprint for creating employee investment strategies, and a baseline to evaluate the effectiveness of these strategies. 9
  • 10.
    ABA CLO SummitApplication We modified the Human Capital Capability Scorecard™ and our data collection to those elements with both of the following characteristics: - Most relevant to employee development, and - Could be provided by a single individual within the organization 10
  • 11.
    ABA CLO SummitResults • The evidence clearly points to a positive relationship between human capital (learning) practices and investments, and financial returns. • This relationship is most consistent for the measure that captures training and development expenditures per employee. • The financial outcome most consistently associated with an array of human capital measures is net income per employee. 11
  • 12.
    ABA CLO SummitSample Results Median Net Income Per FTE (10/02 to 9/03), by Top Half/Bottom Half on Human Capital Variables $80,000 Median Net Income/FTE $60,000 $40,000 $20,000 $0 Resources: T&D Resources: Employee Average Systems Average Workforce Average Learning Expenditures Per FTE to Trainer Ratio Maturity Score Optimization Score Capacity Score Human Capital Variable Institutions in Top Half on HC Variable Institutions in Bottom Half on HC Variable 12
  • 13.
    Conclusion There is every reason to believe that an institution’s increased focus on, and commitment to, human capital factors, especially learning and development, should lead to improved financial performance. Which side of the fence are you on? 13
  • 14.
    Conclusion There is every reason to believe that an institution’s increased focus on, and commitment to, human capital factors, especially learning and development, should lead to improved financial performance. Which side of the fence are you on? 14
  • 15.
    Step 1 –identifying critical performance gaps • Gaps is obtained through comparing actual against industry standards • Critical is how material is the impact on the corporate objectives. • Use ROE format as a coporate summary • Critical is derived from pareto and sensitivity analysis
  • 16.
    P. 31 Define thePerformance Gaps Describe Discrepancy DESIRED PERFORMANCE (Optimals) - ACTUAL PERFORMANCE (Actuals) = POSSIBLE TRAINING NEED
  • 17.
    P. 34 Is it critical? • Why is it important? • What if you did nothing? • How big is it? (Quantify if possible) • Who cares? • “Is the cost of the discrepancy high enough that it seems worth pursuing a solution?”
  • 18.
    Step 2 -calculate the KPI of each critical performance areas • Calculate KPIs for actual, standards and industry • Compare KPIs to evaluate true performance. • The KPI may be used in ROI calcualtion.
  • 19.
    Step 3 -Analysing further the critical performance gaps • Is it true performance gaps? • Is the gap caused by factors other than competency. • Benchmarkings to recognise best practices • Use input output analysis • Task and subtask analysis • Interviews, observations, focus groups, documentations
  • 20.
    Determine Cause(s) Is it a problem of skill or a problem of will? I don’t wanna! I don’t wanna! I don’t know how.
  • 21.
    Yes, it isa skill deficiency Arrange Formal no Used to do Training it? yes Arrange Practice no Used often? Arrange Feedback yes
  • 22.
    Other questions Changethe Job Simpler way? Arrange on-the-job training Potential? Transfer or terminate
  • 23.
    If a skilldeficiency.. • Provide training • Provide practice • Provide feedback • Simplify the task • Develop a job aid • OJT • Transfer • Terminate
  • 24.
    And one lastquestion... Remove Obstacles? Obstacles
  • 25.
    P. 39 Step4: To train or not to train? Calculate cost • First determine cause(s) • Only then look at Select best solution(s) possible solutions • Seek integrated Implement solution systems that get to the root of the problem
  • 26.
    P. 39 Cause Solution • If skill or knowledge……….training • If lack feedback……………..feedback, standards • If not motivated…………….rewards, consequences • If unclear expectations…..std, measure, discuss • If job environment…………change environment • If potential……………………change personnel
  • 27.
    EVALUATE PERFORMANCE CO M P E T E N C Y LP HP WP LP MOTIVATION
  • 28.
    Step 5 -calculate the ROI training • The purpose of this step is to justify the training BEFORE the training start. • Calculate the benefits generated by the training divided by the capital employed in the training. • We obtain our ROI figures through the input output model.
  • 29.
    ROI Calculations Source: ROI Institute. Measuring the ROI of Training and Performance Improvement Programs. Program Benefits Arlington, VA: ASTD, Benefit-Cost Ratio = 2004. Page 2.9. Program Costs Net Program Benefits* ROI = X 100% Program Costs *Net Program Benefits = Program Benefits – Program Costs 29
  • 30.
    SUMMARY 1. Identify criticalperformance gaps using some benchmarks. 2. Identify key job holders and conduct competency profiling. 3. Identify best practices 4. Identify effective training alternatives 5. Use projected ROI to justify training