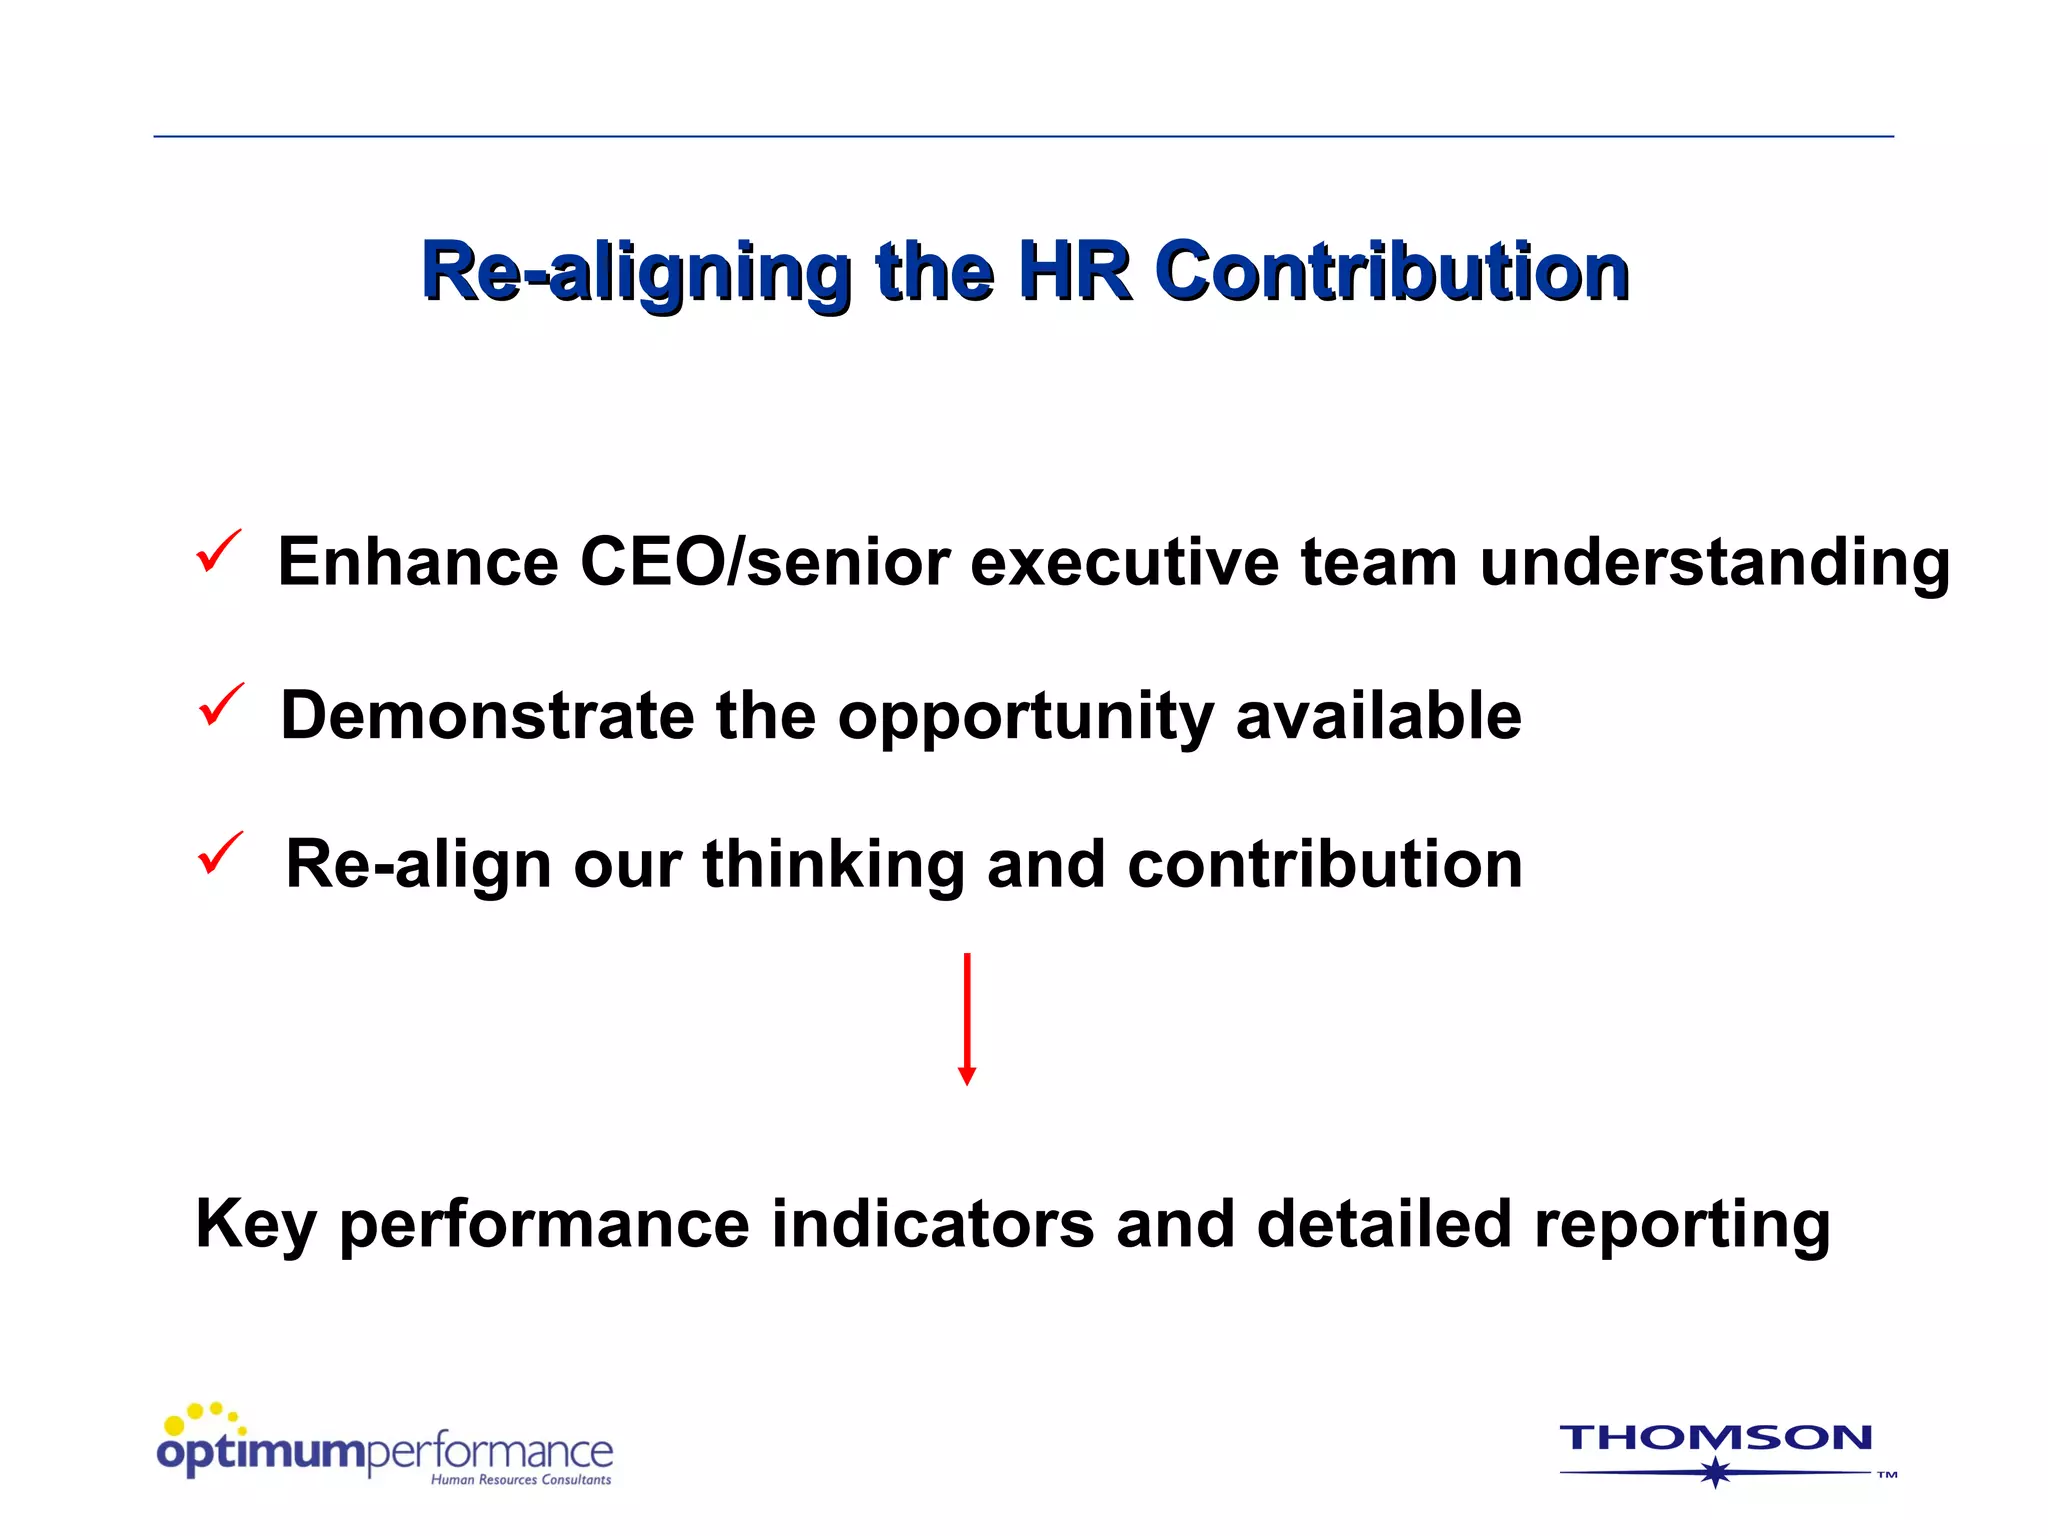
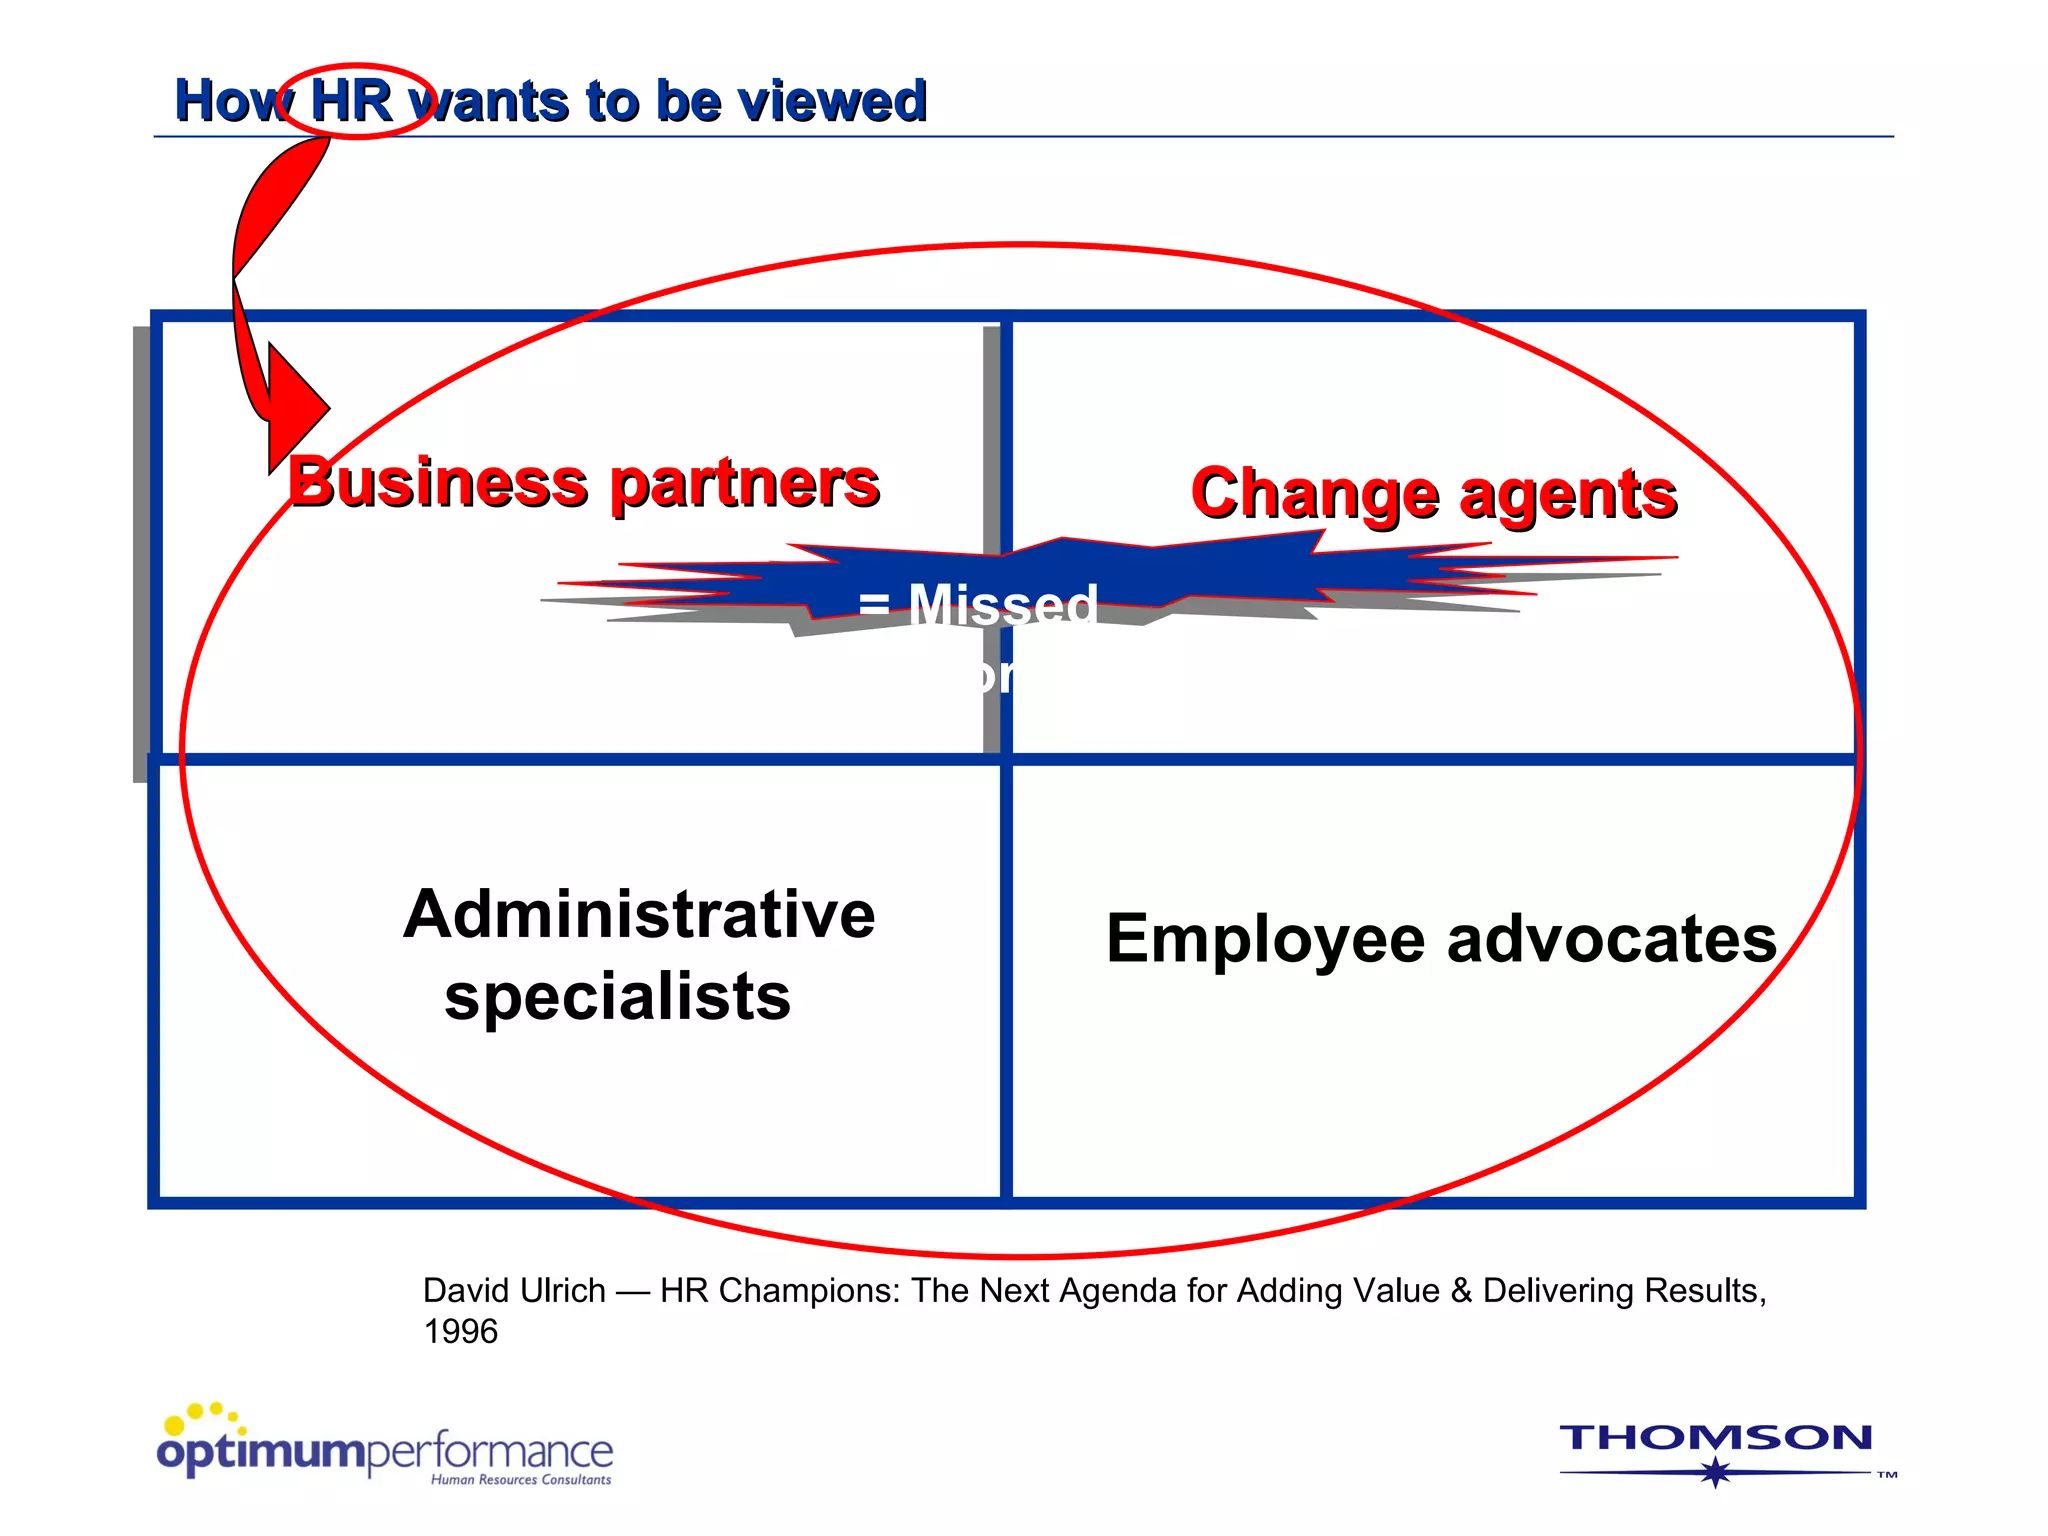
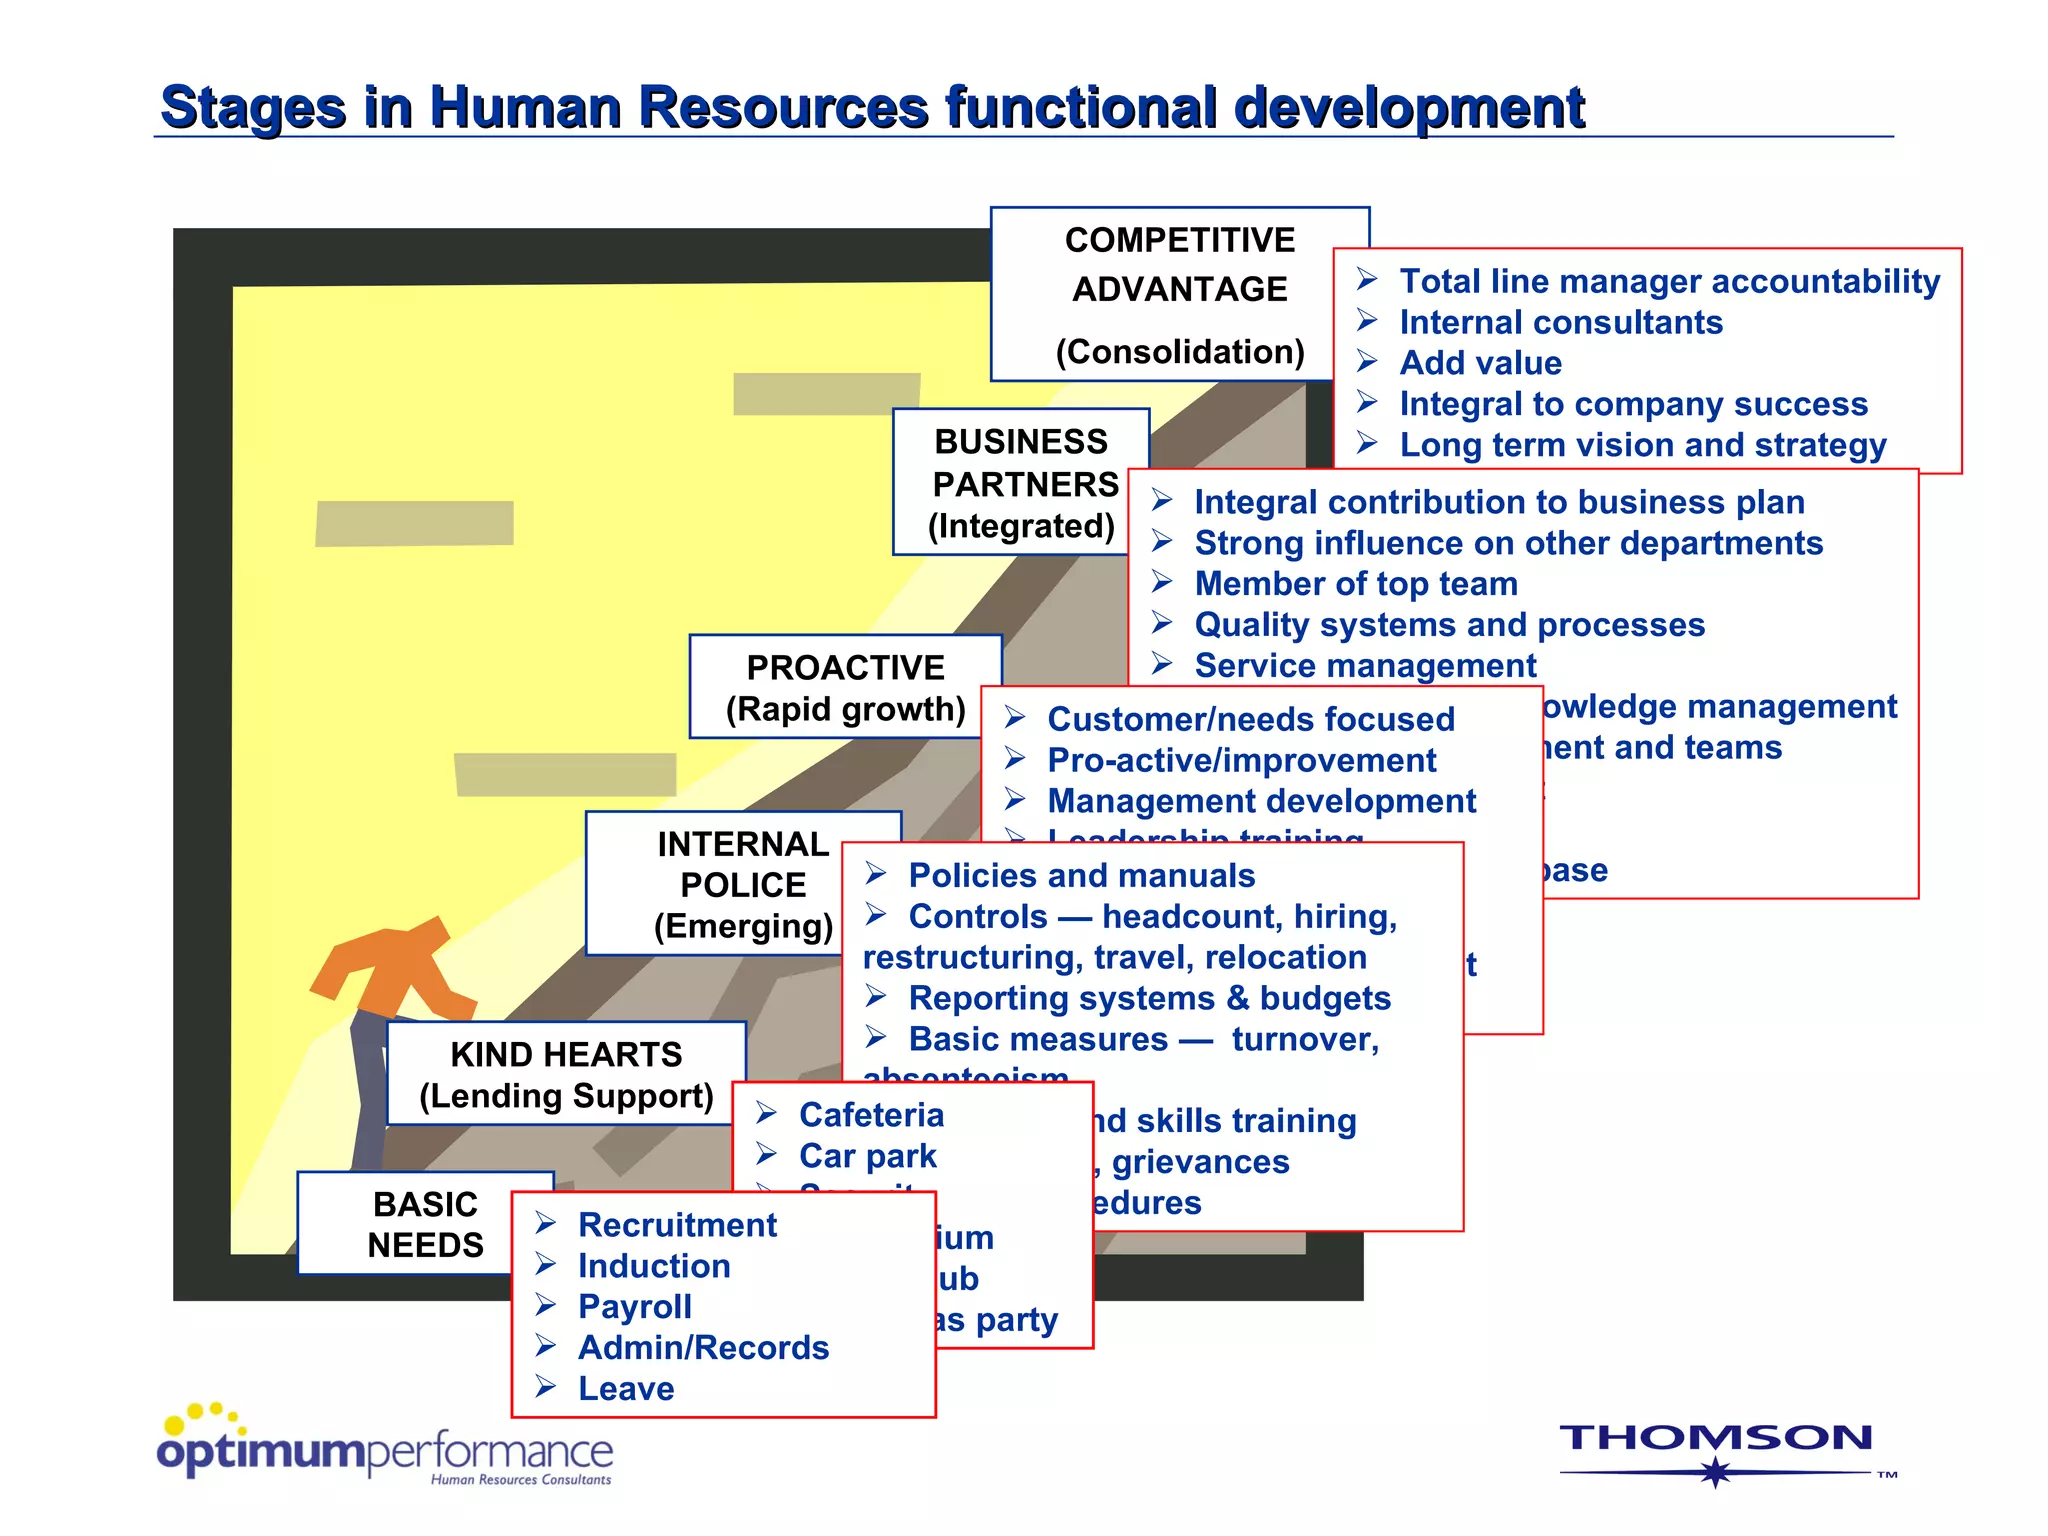
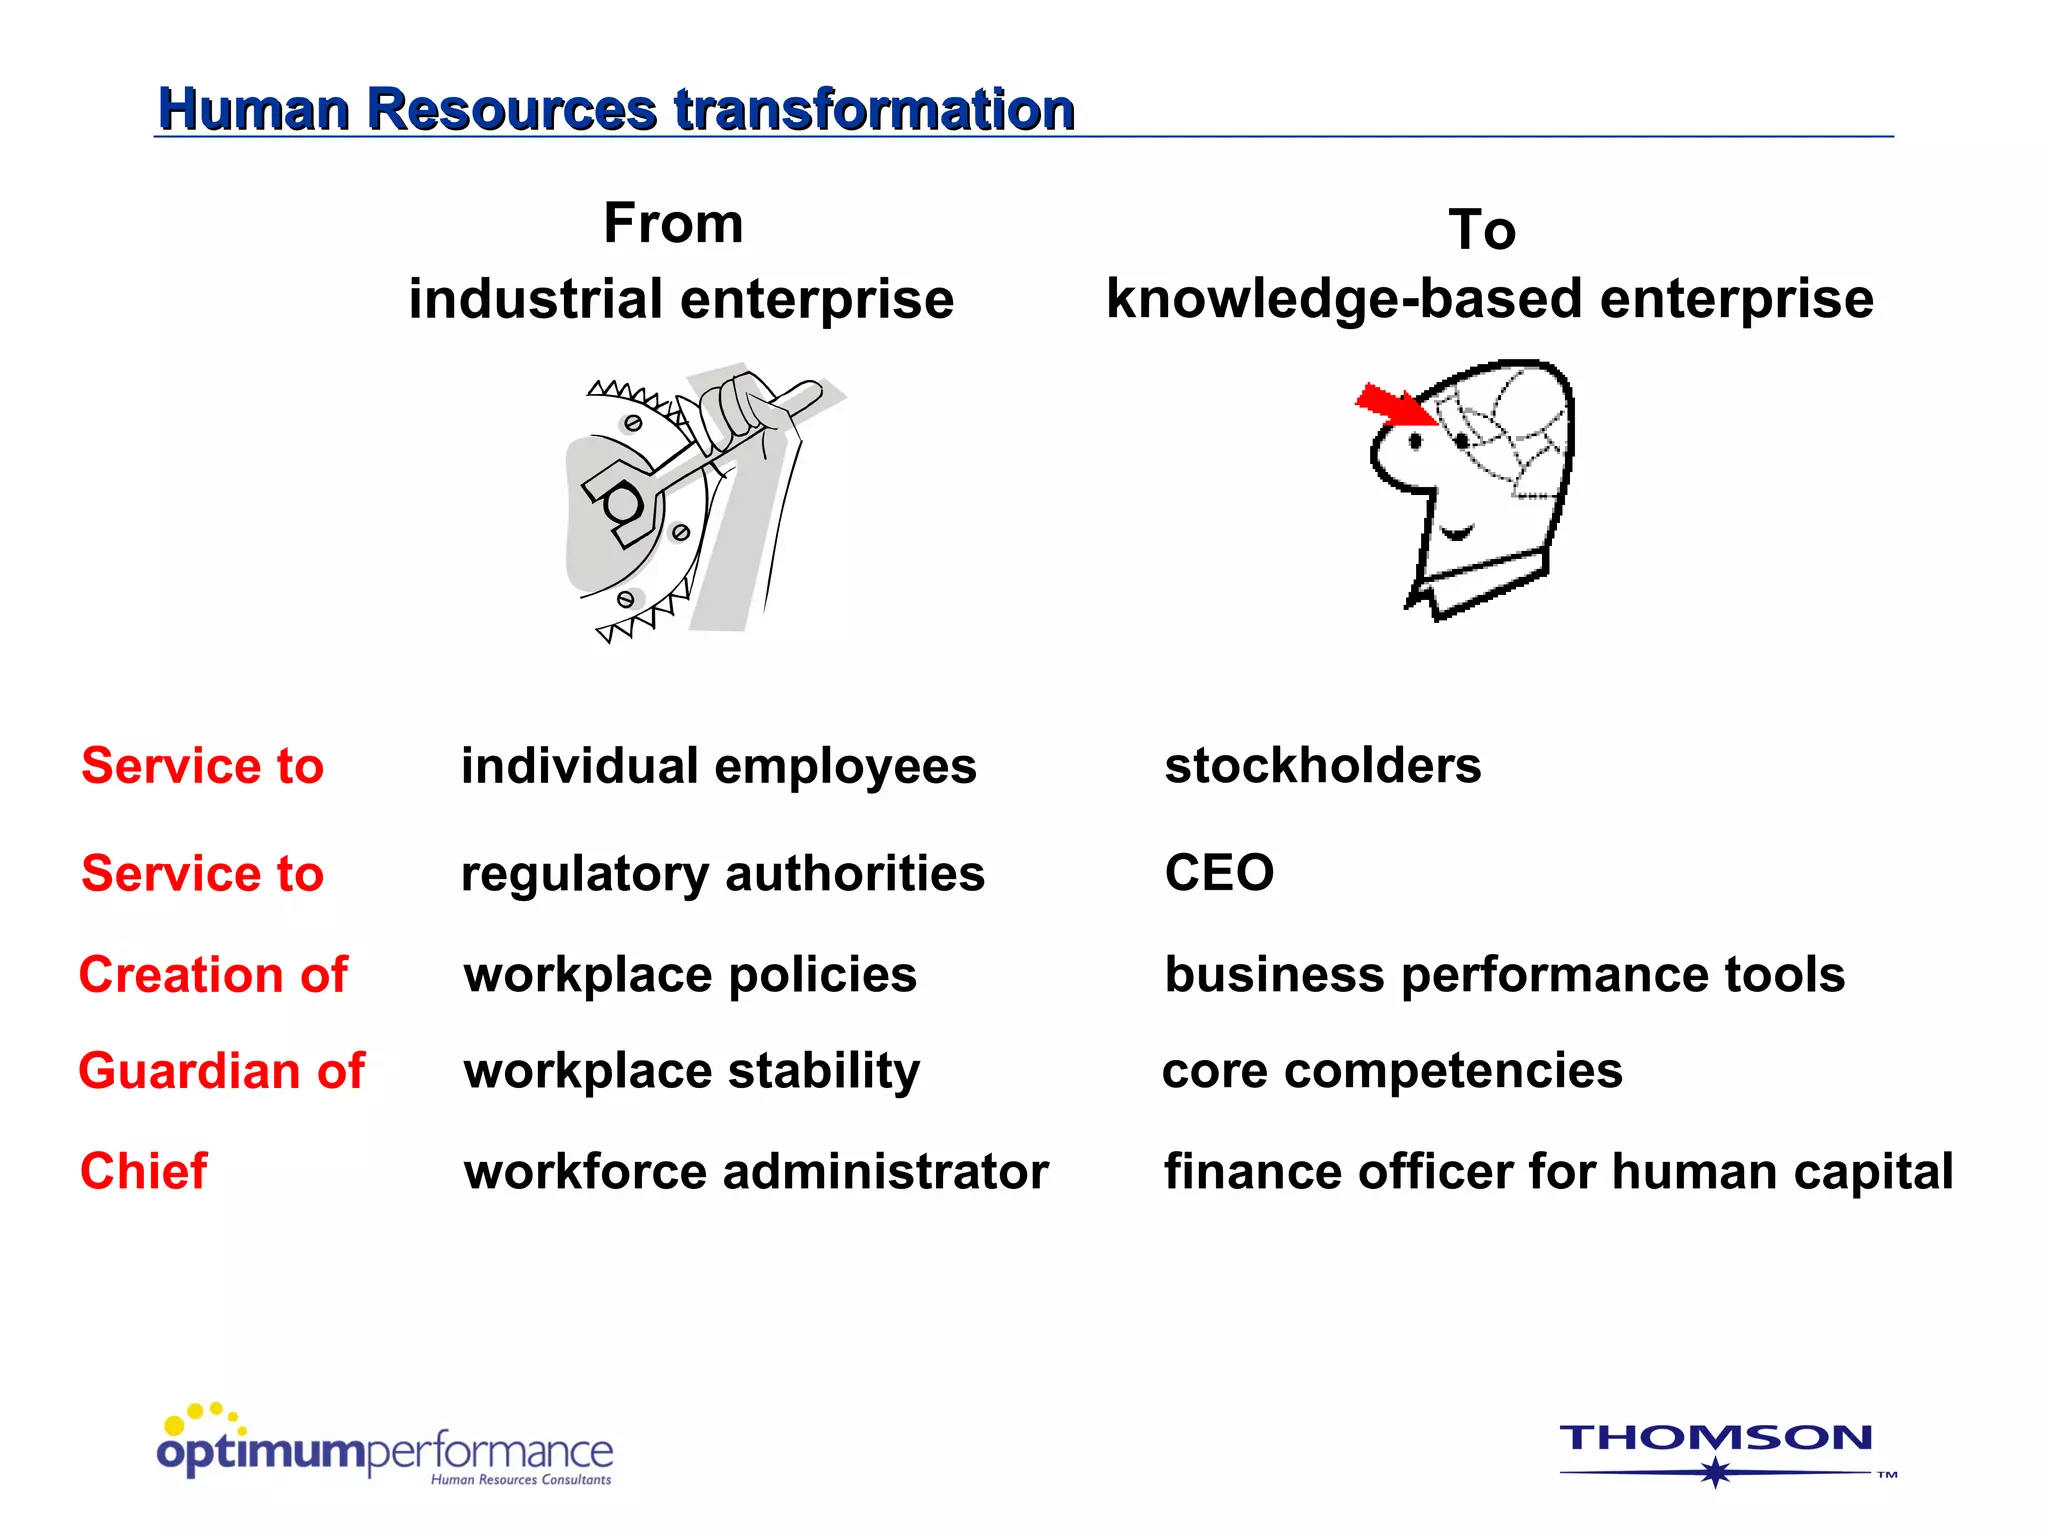
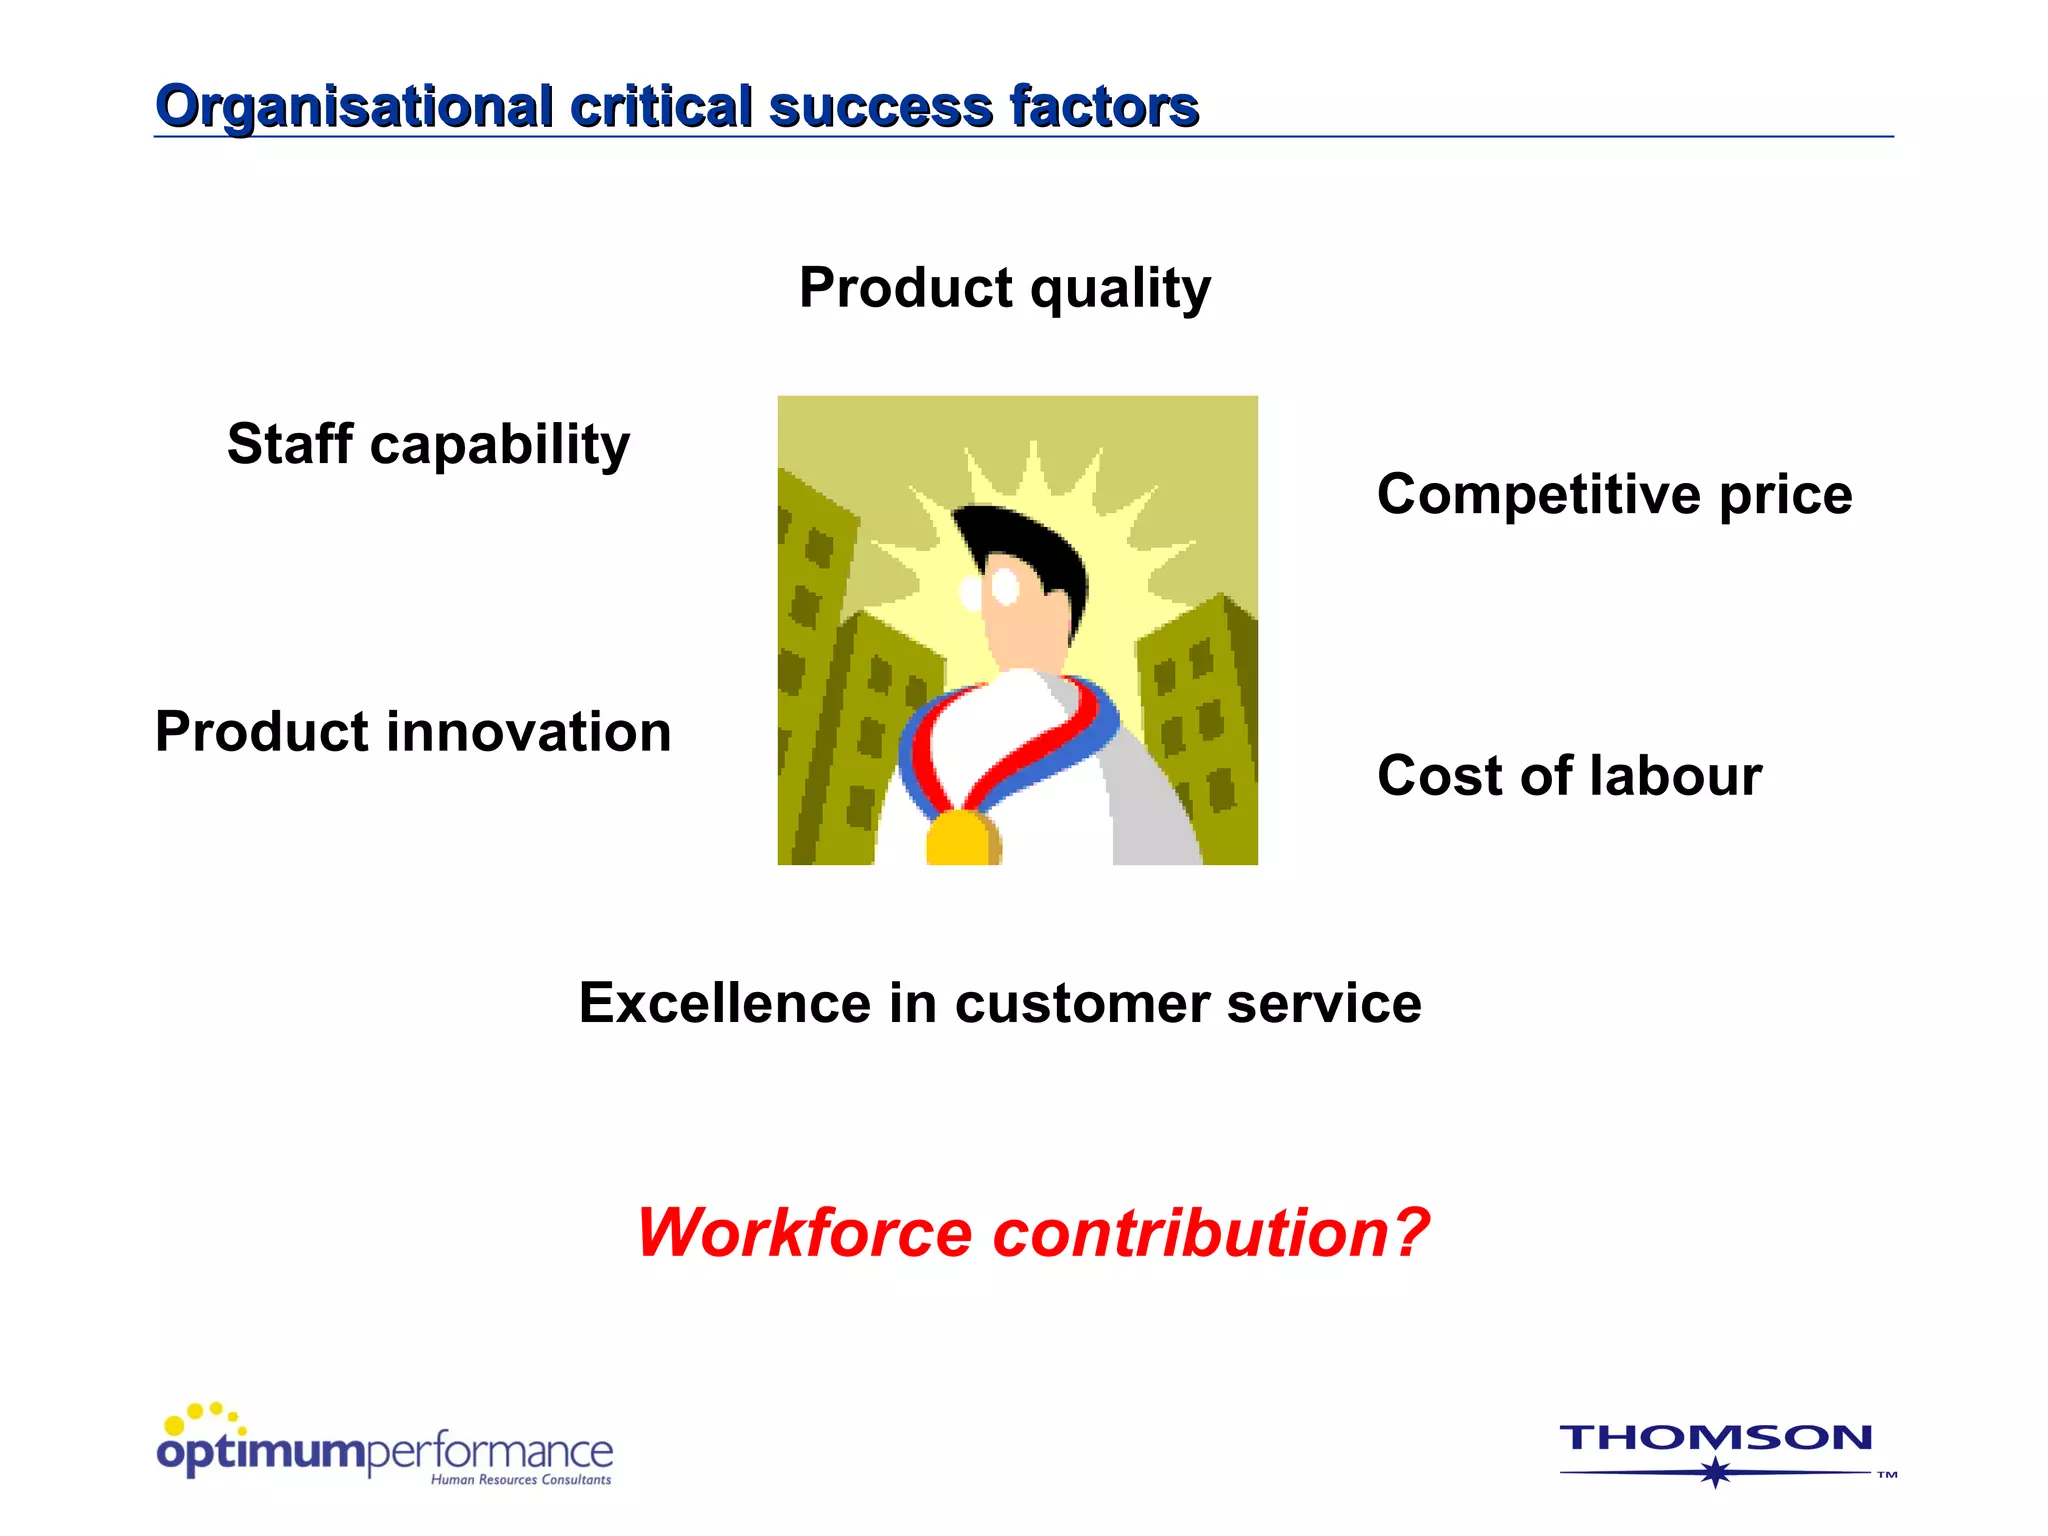
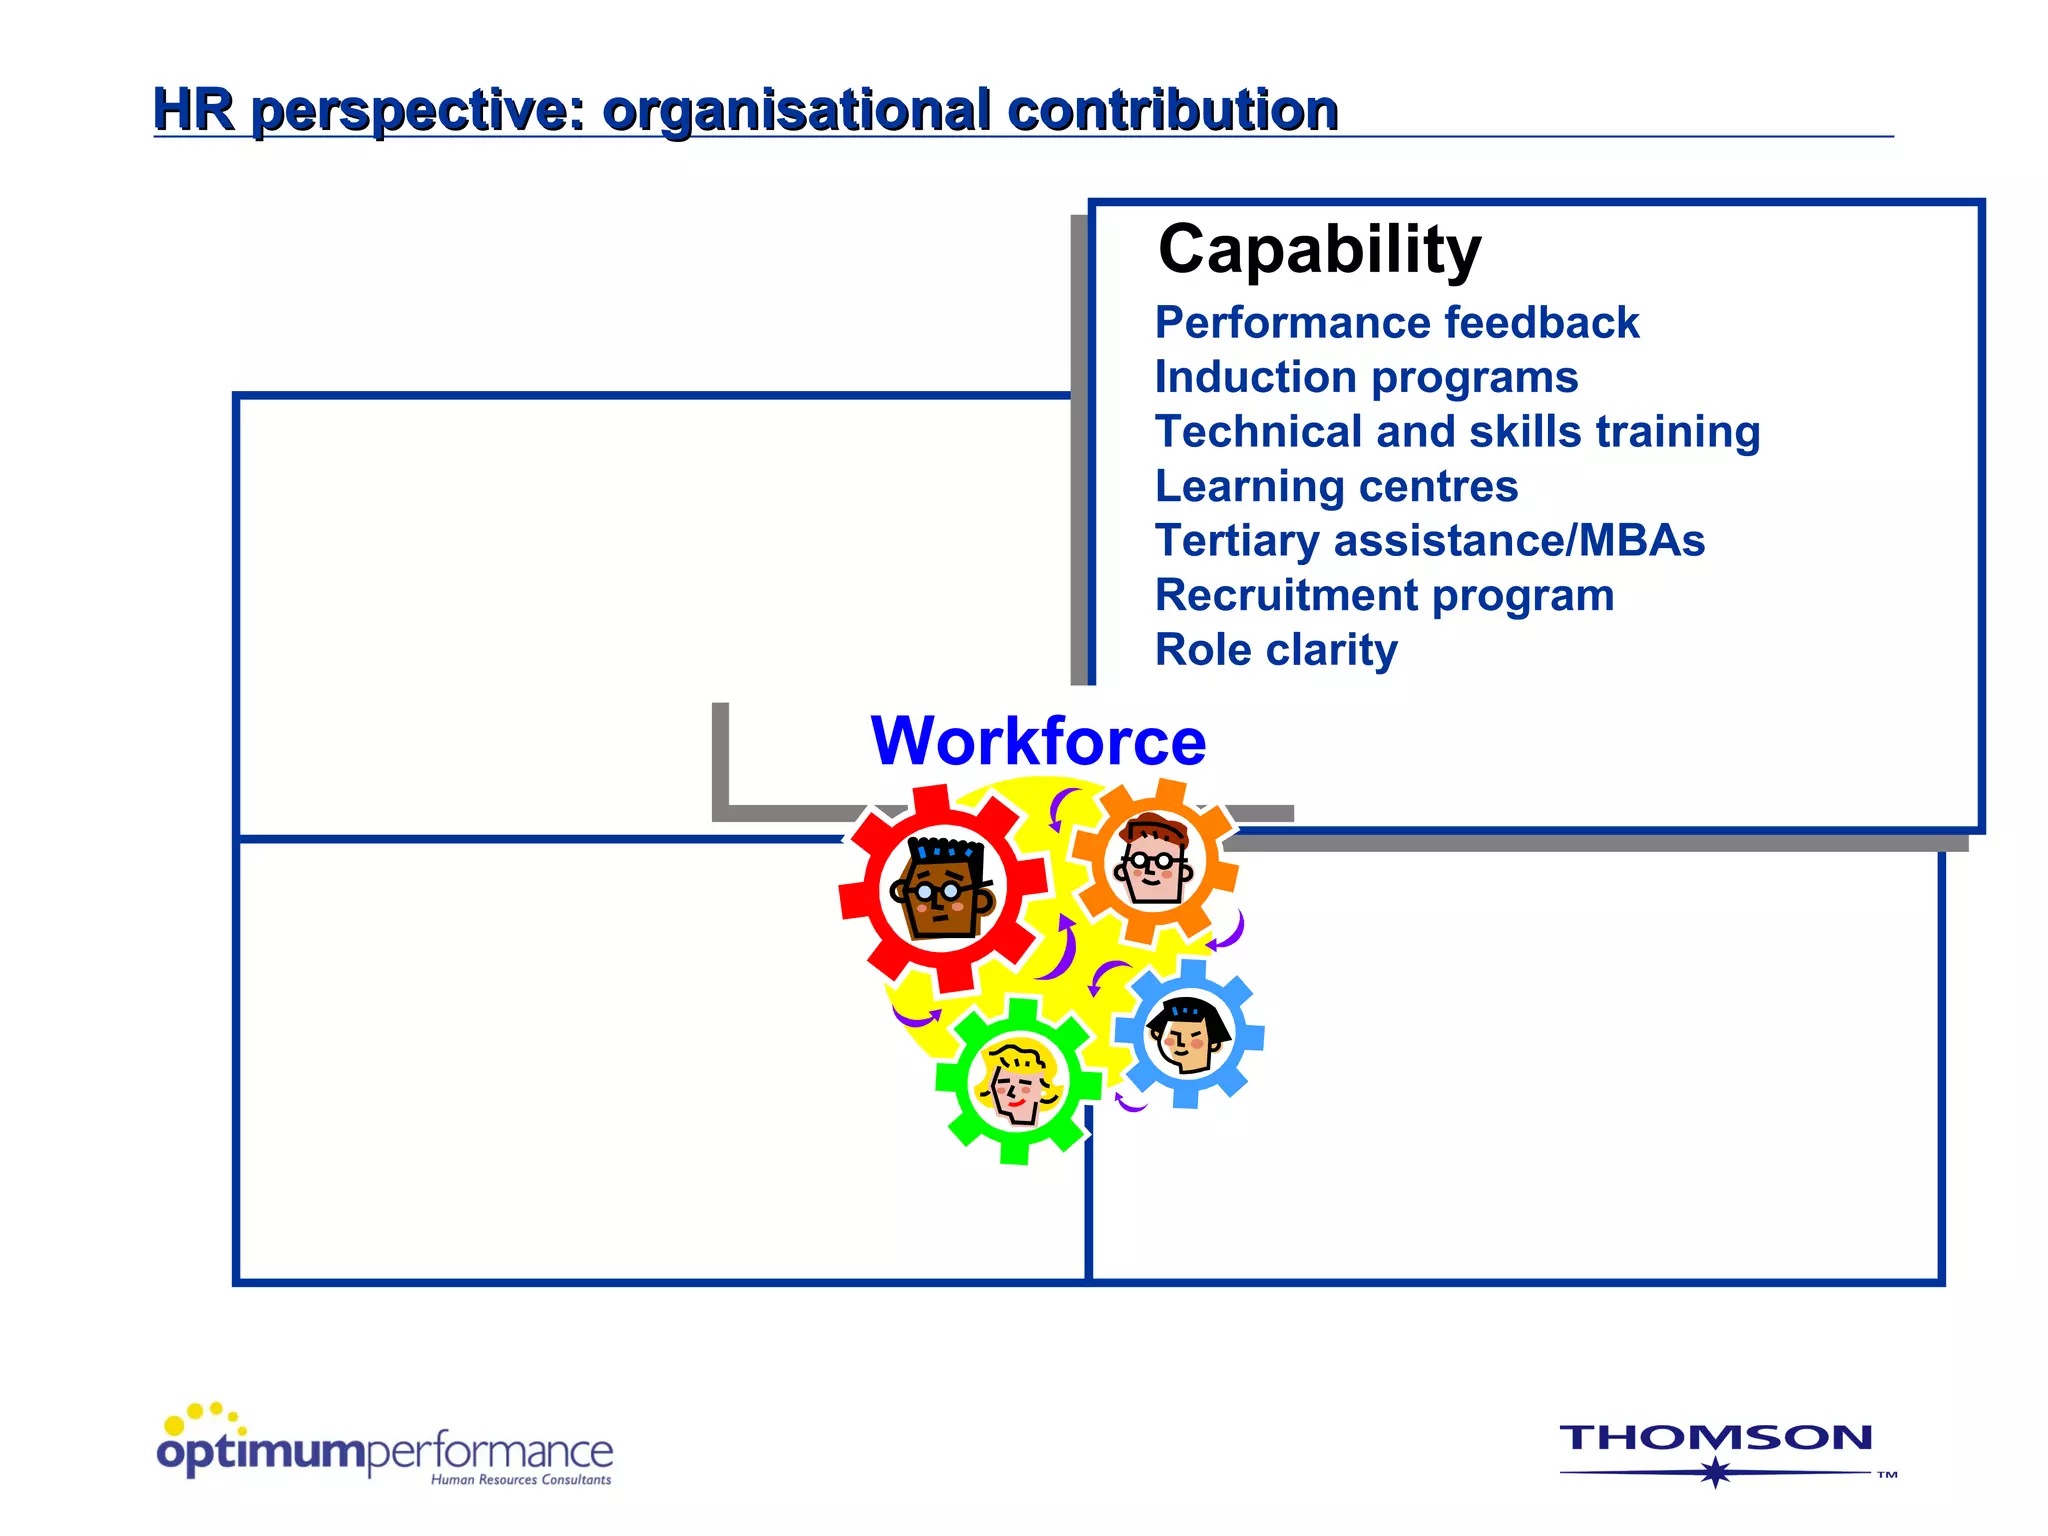
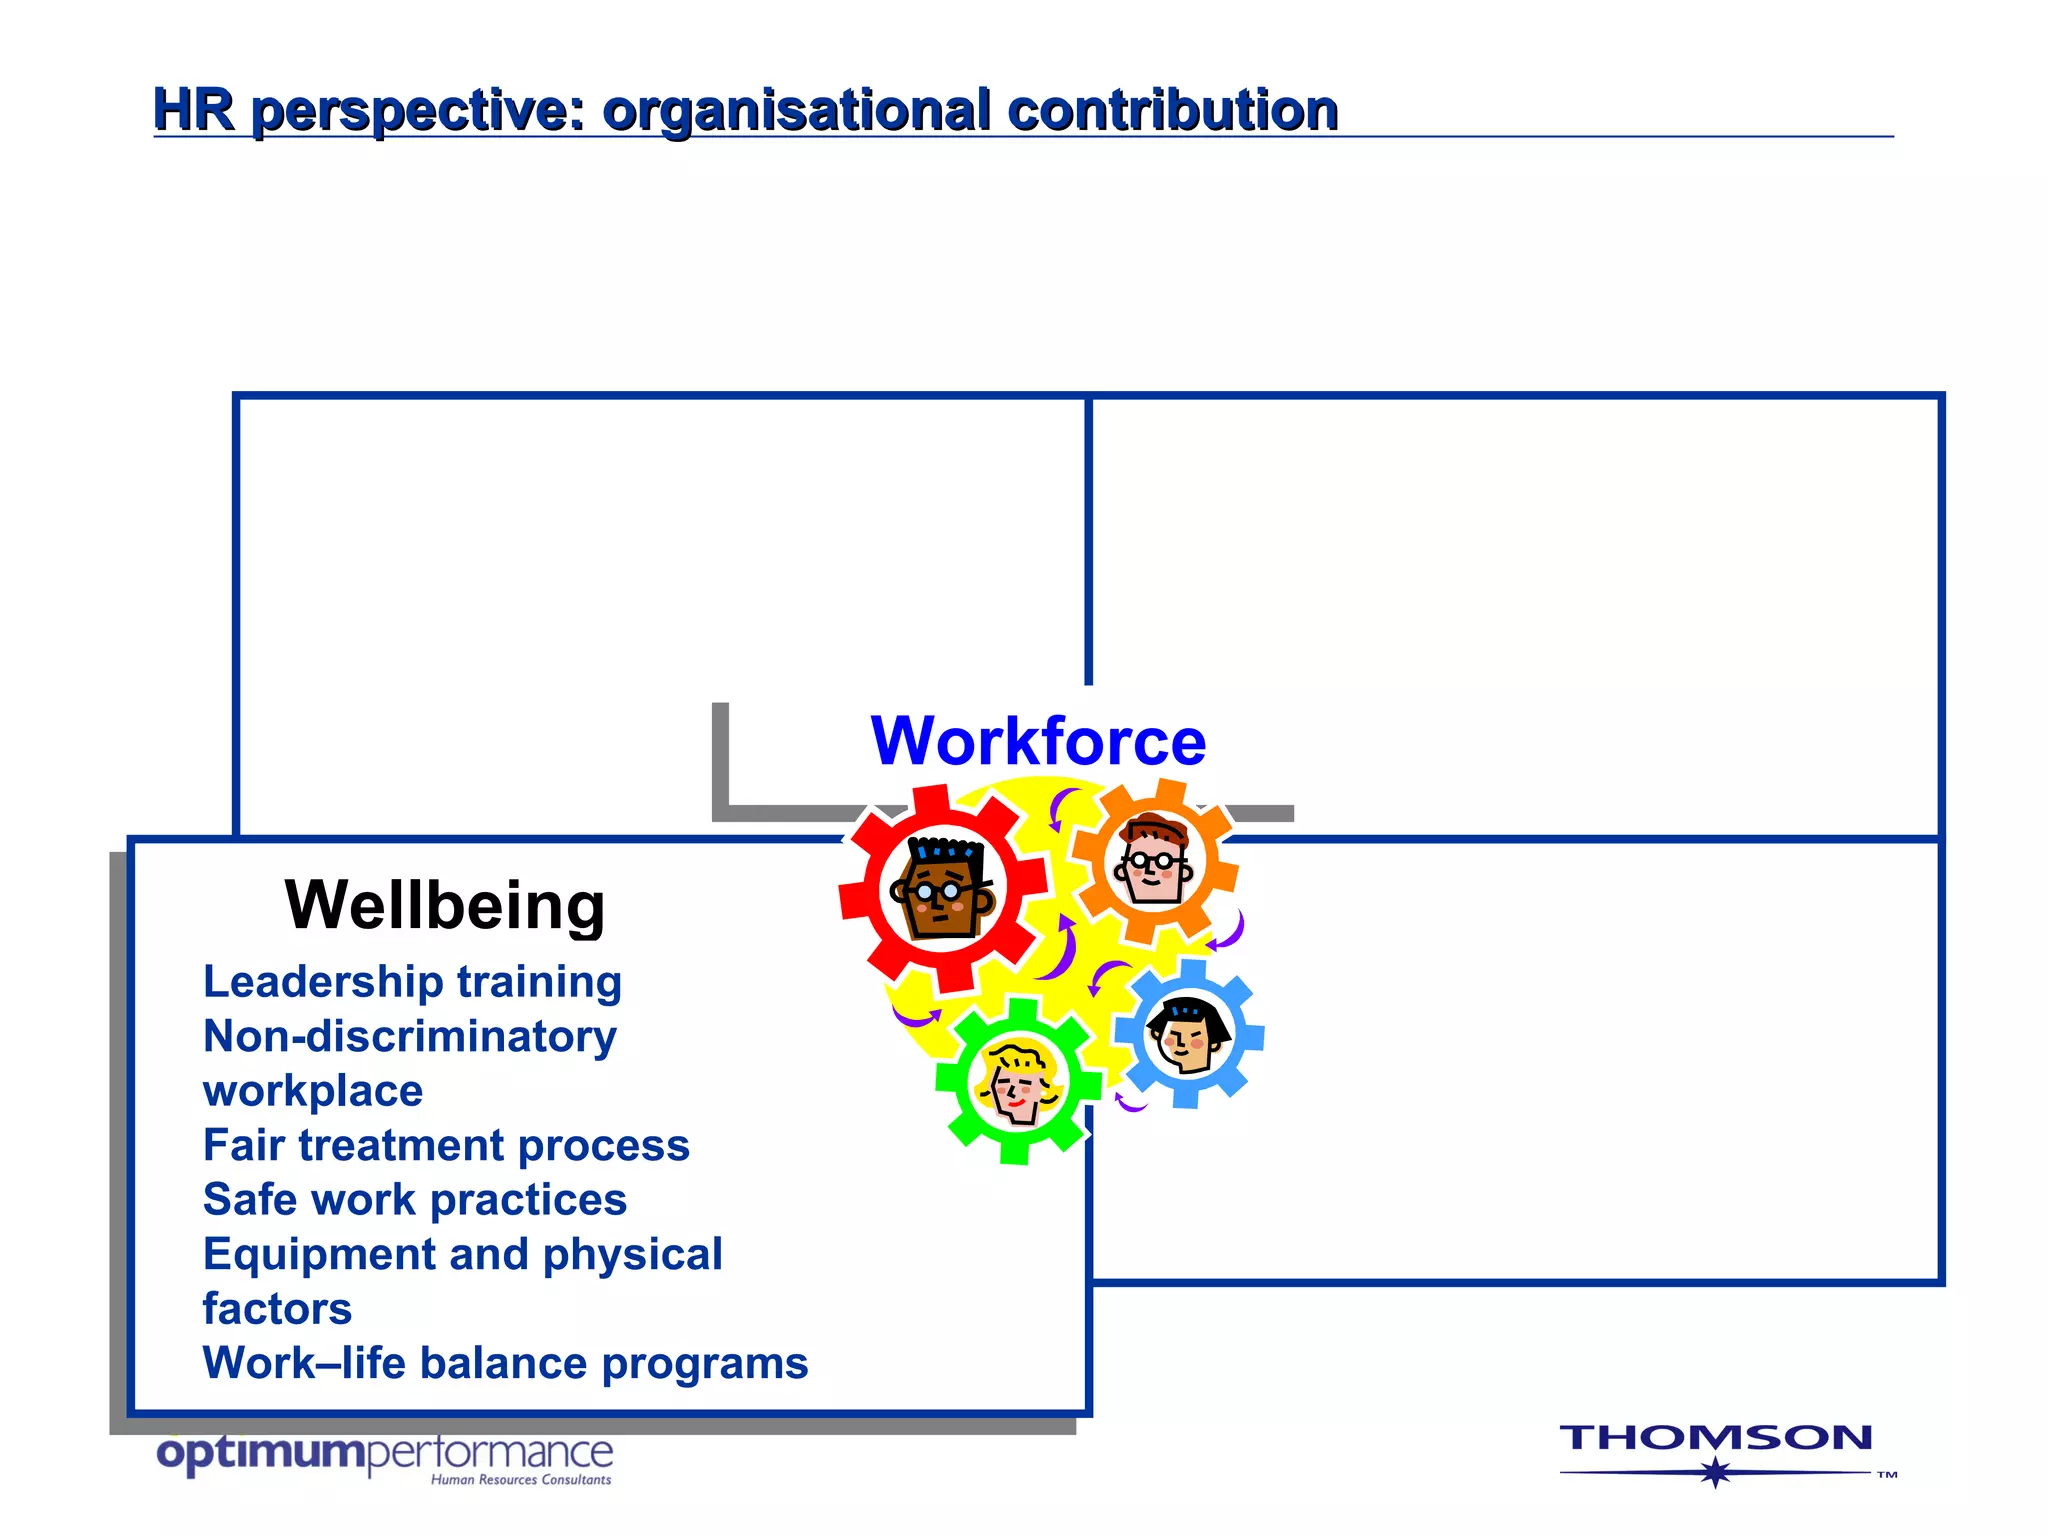
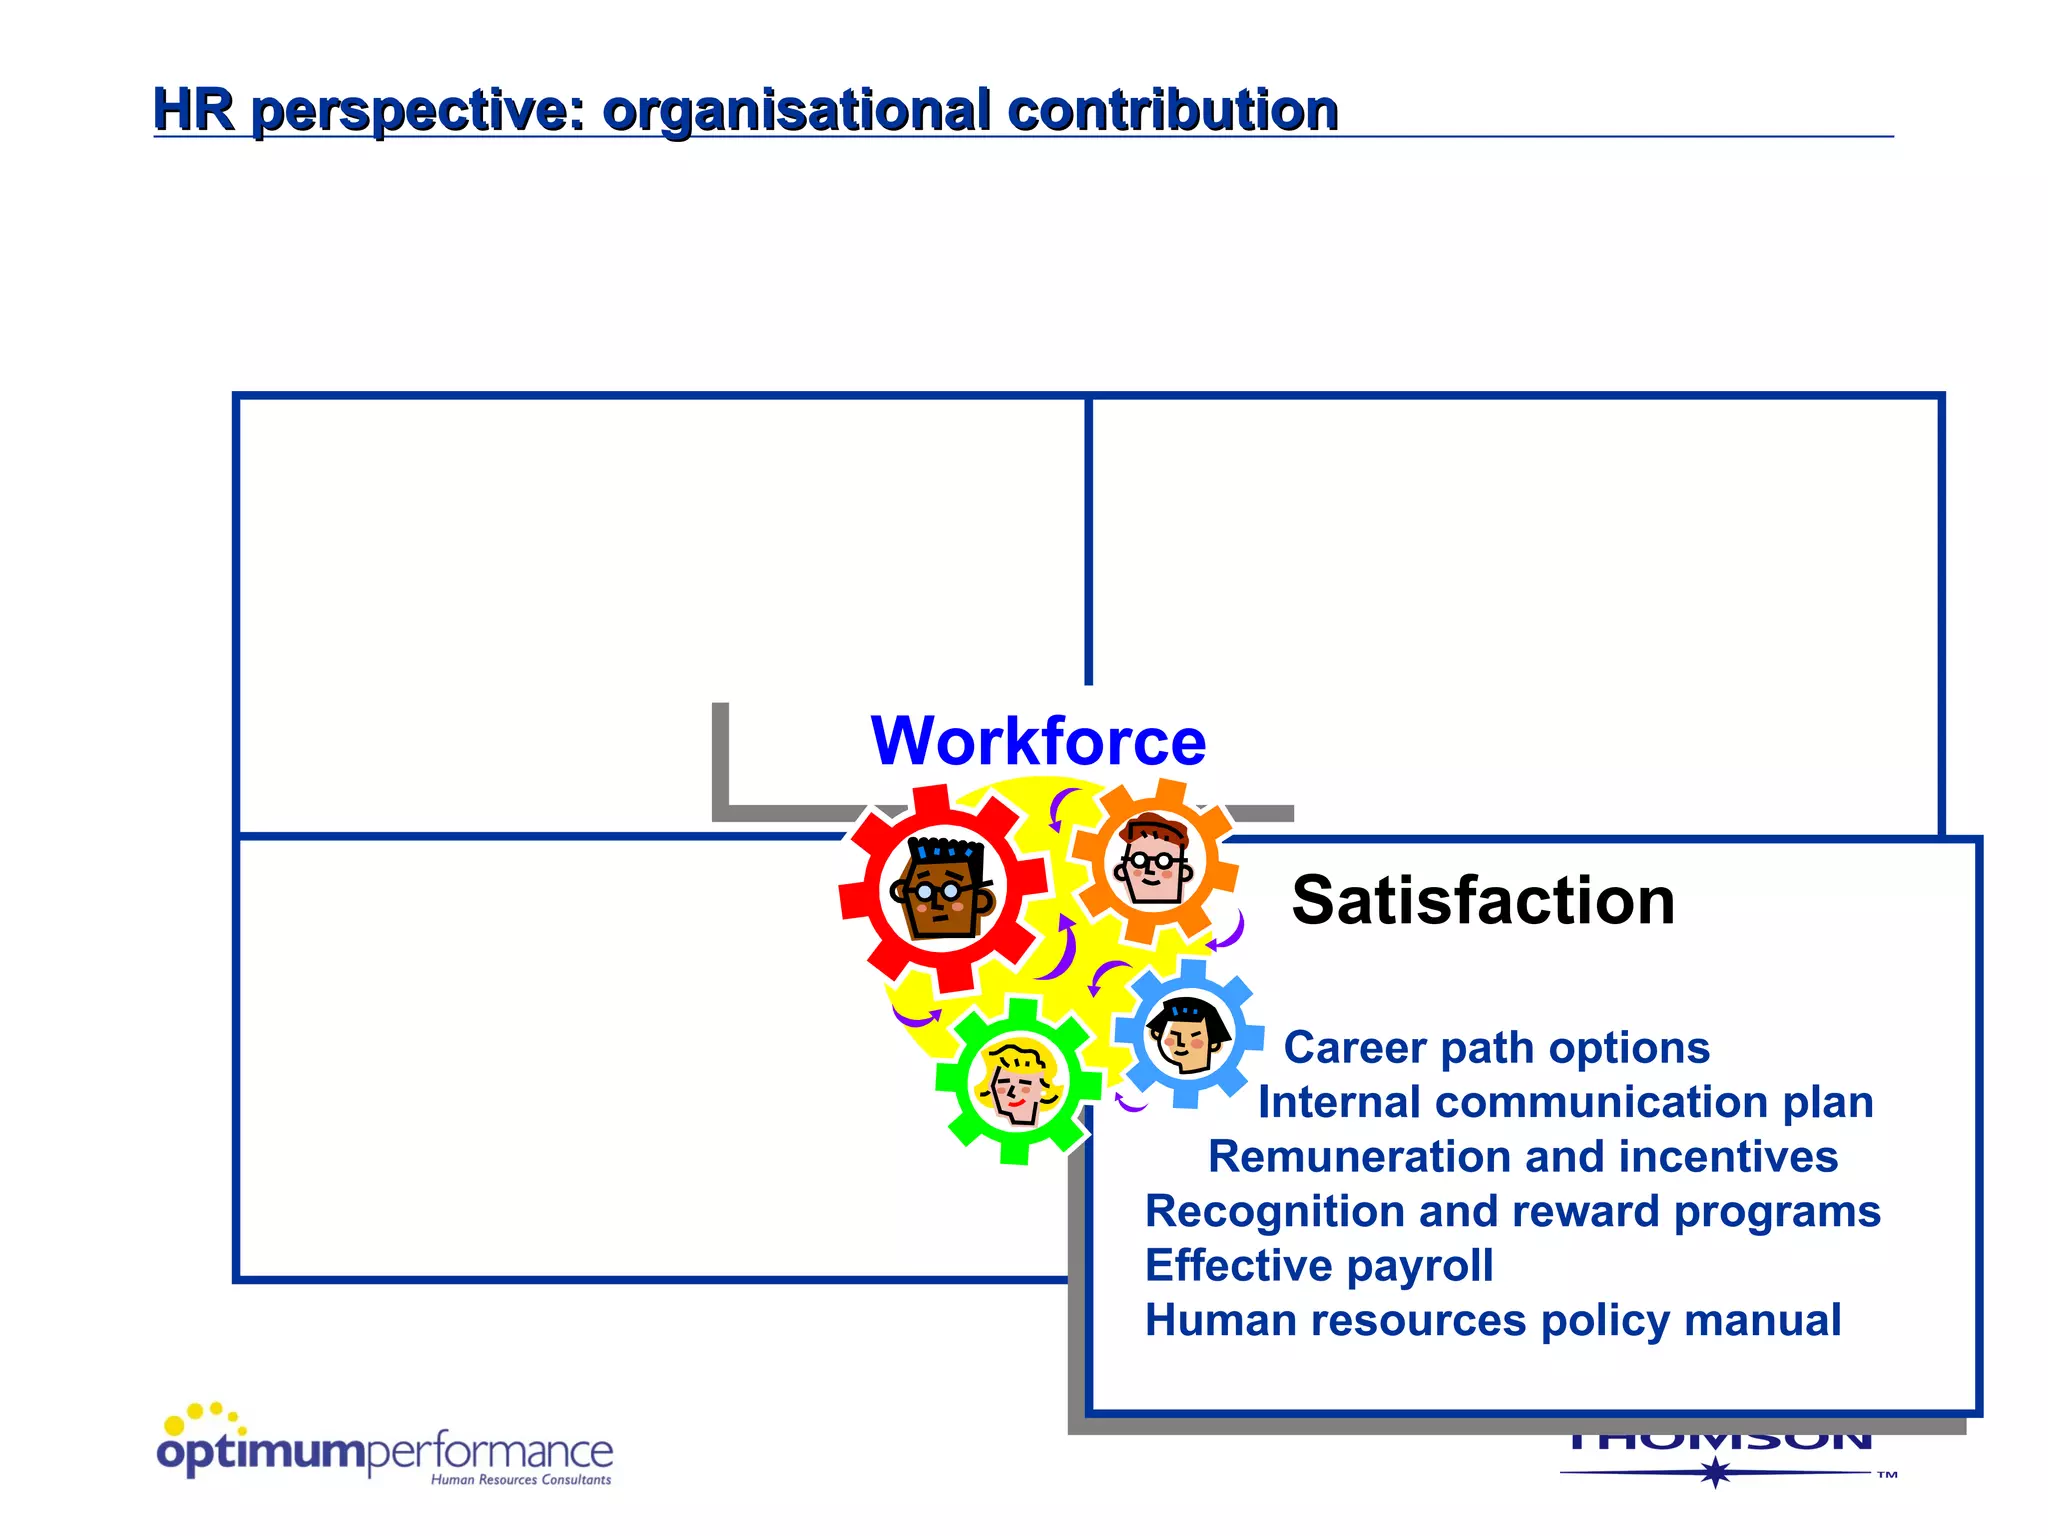
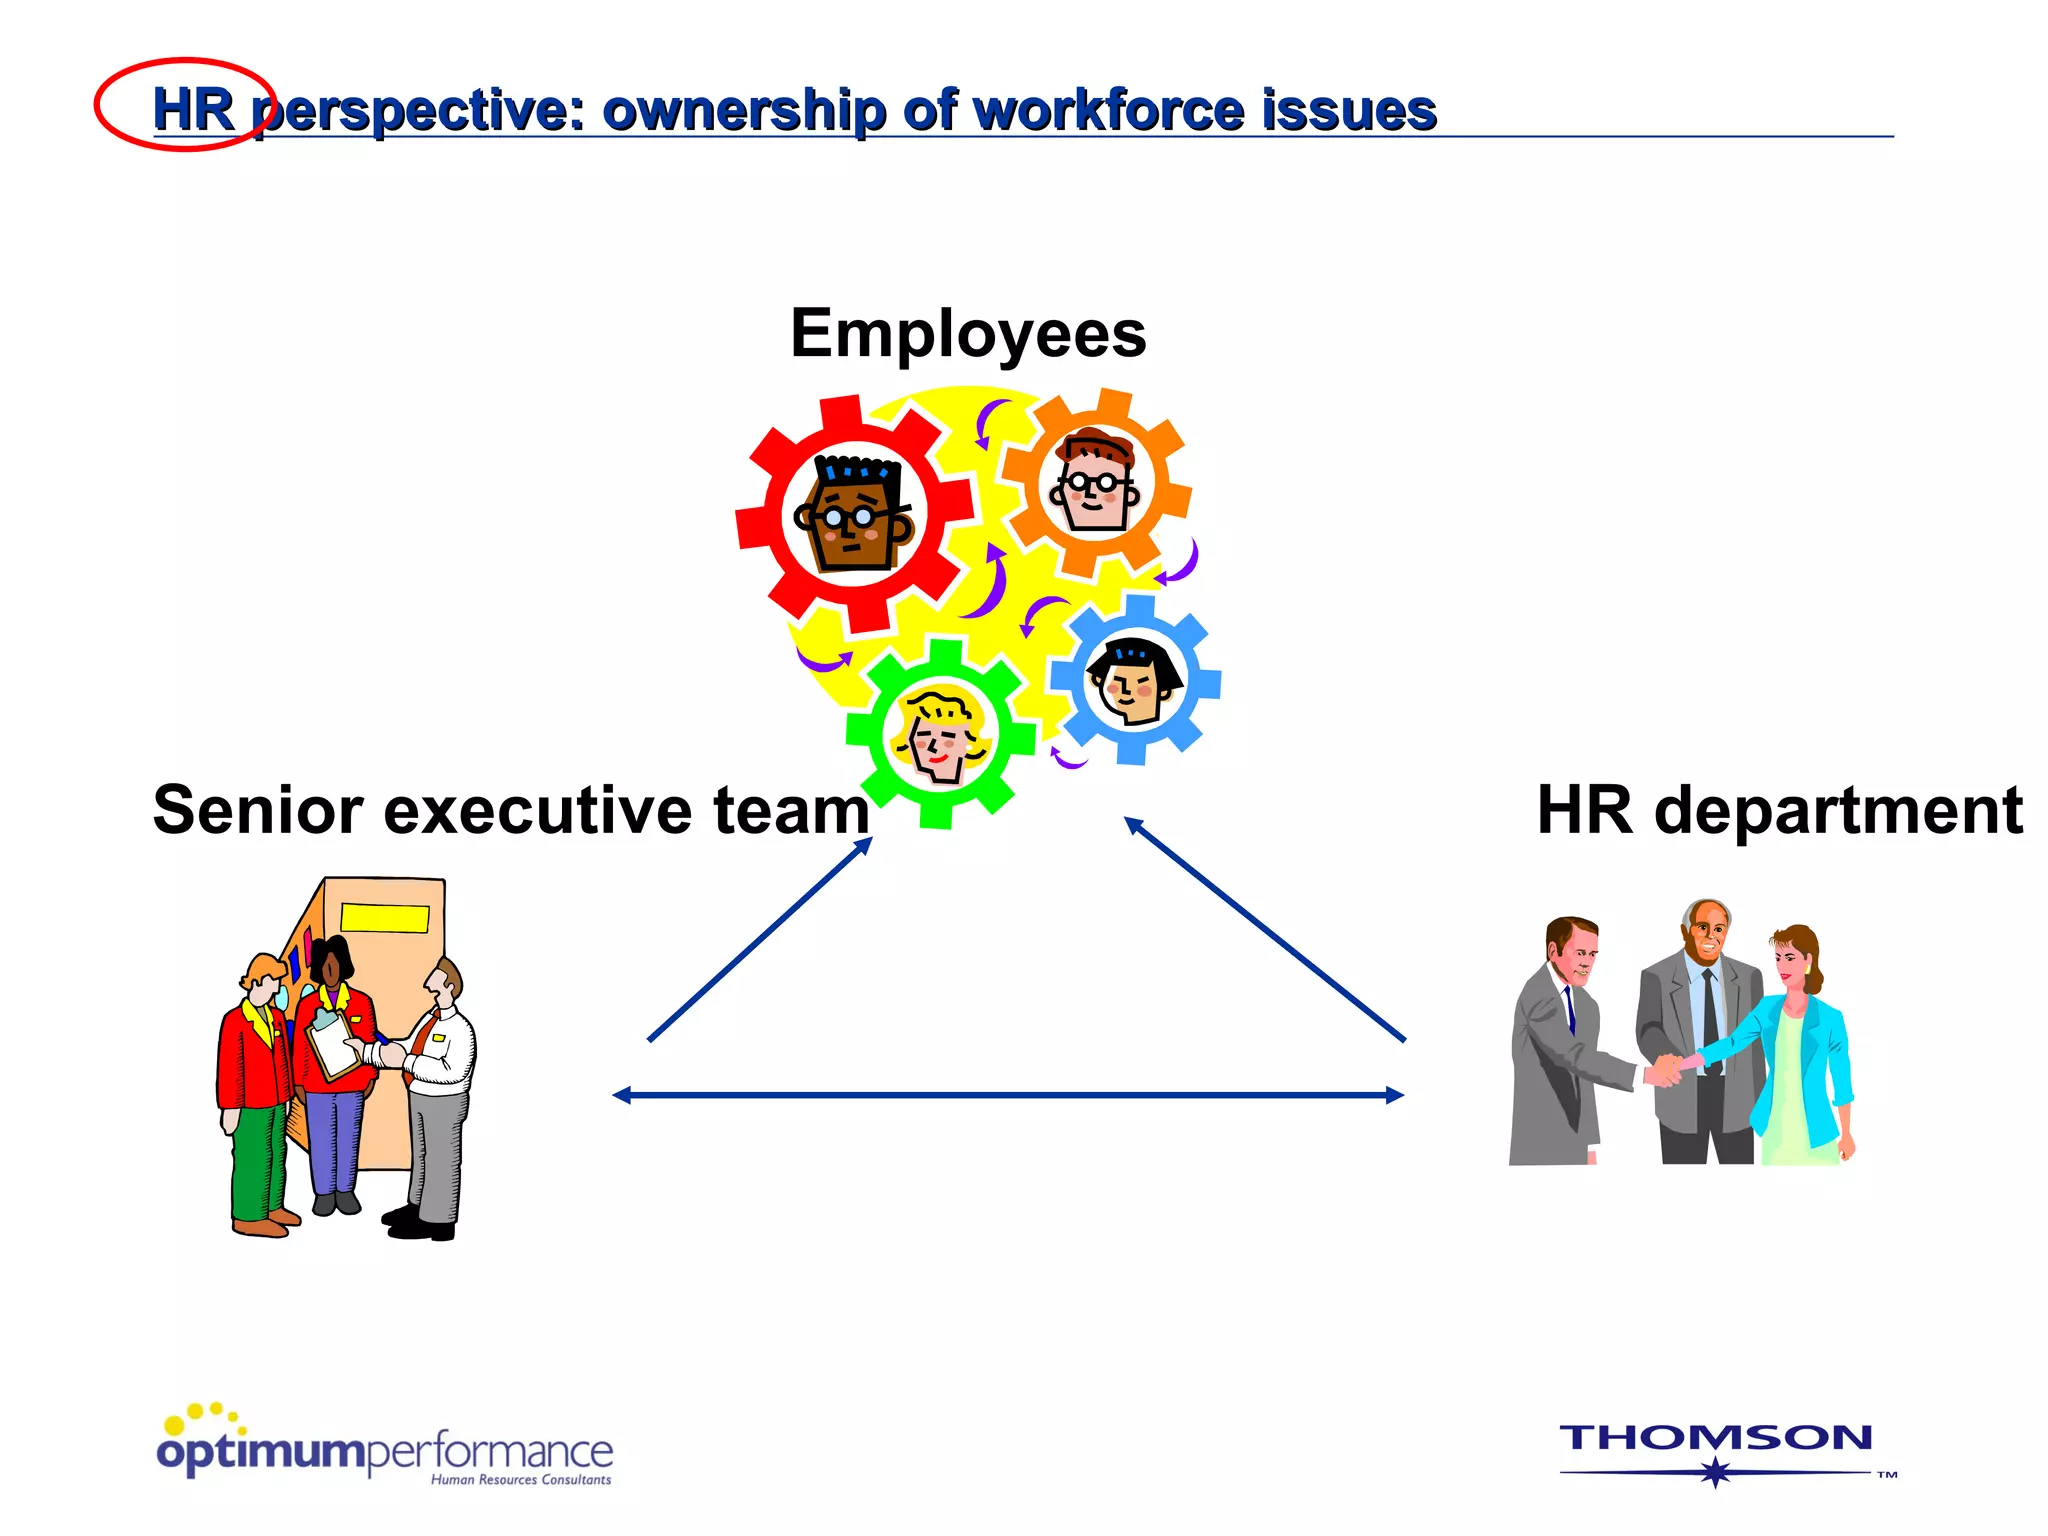
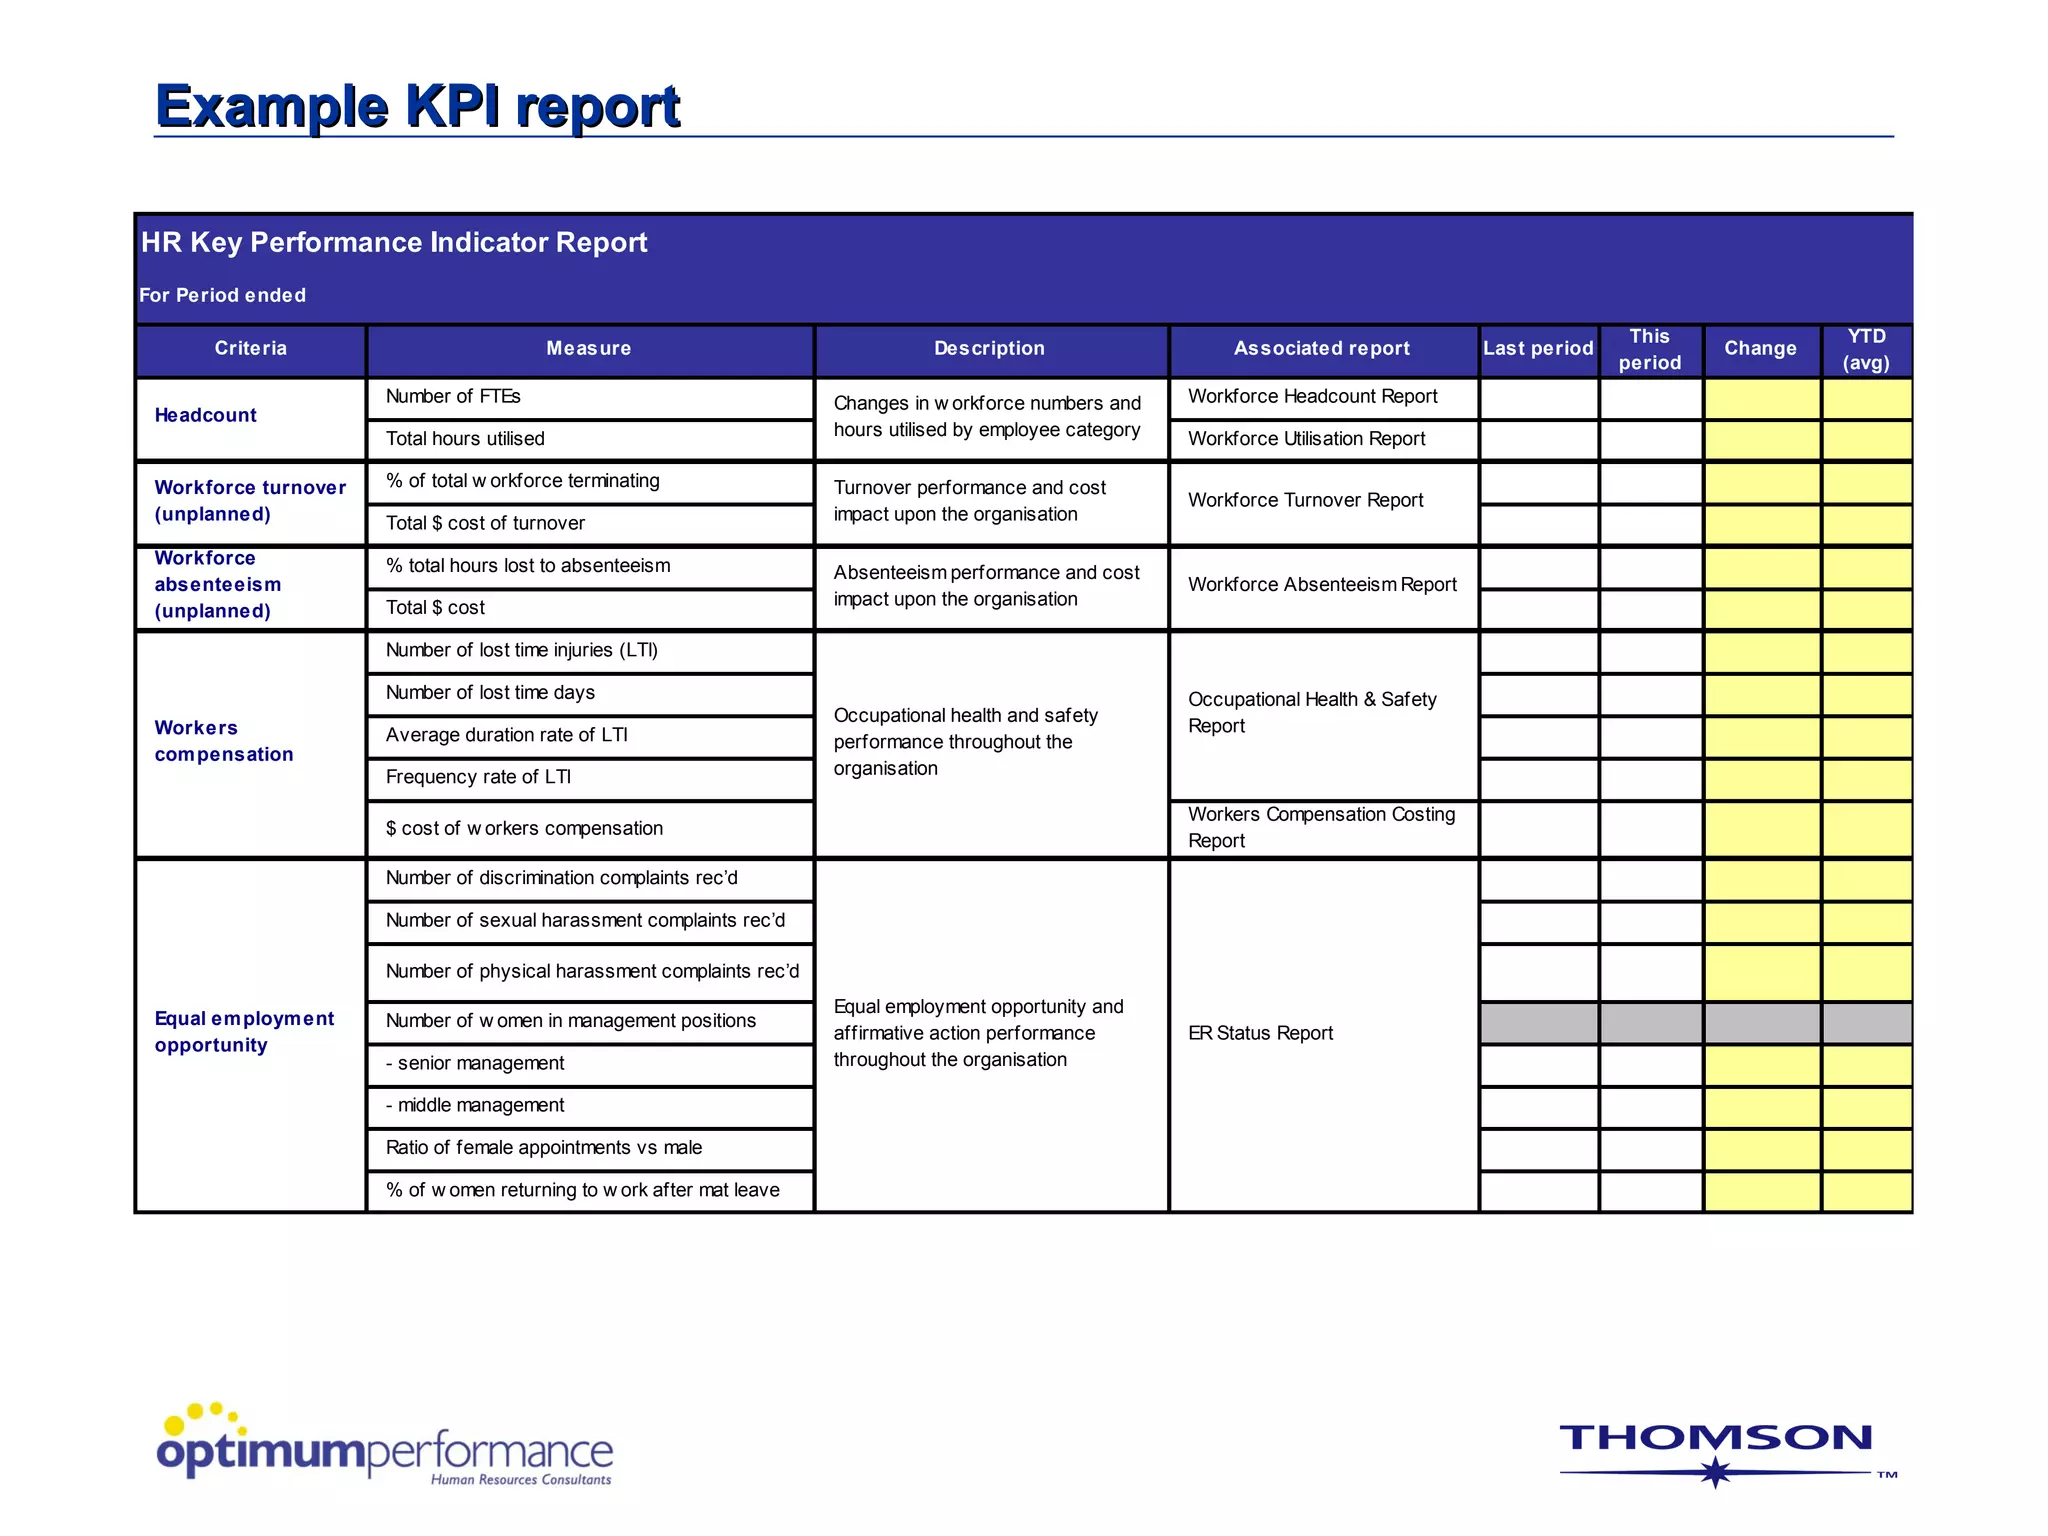
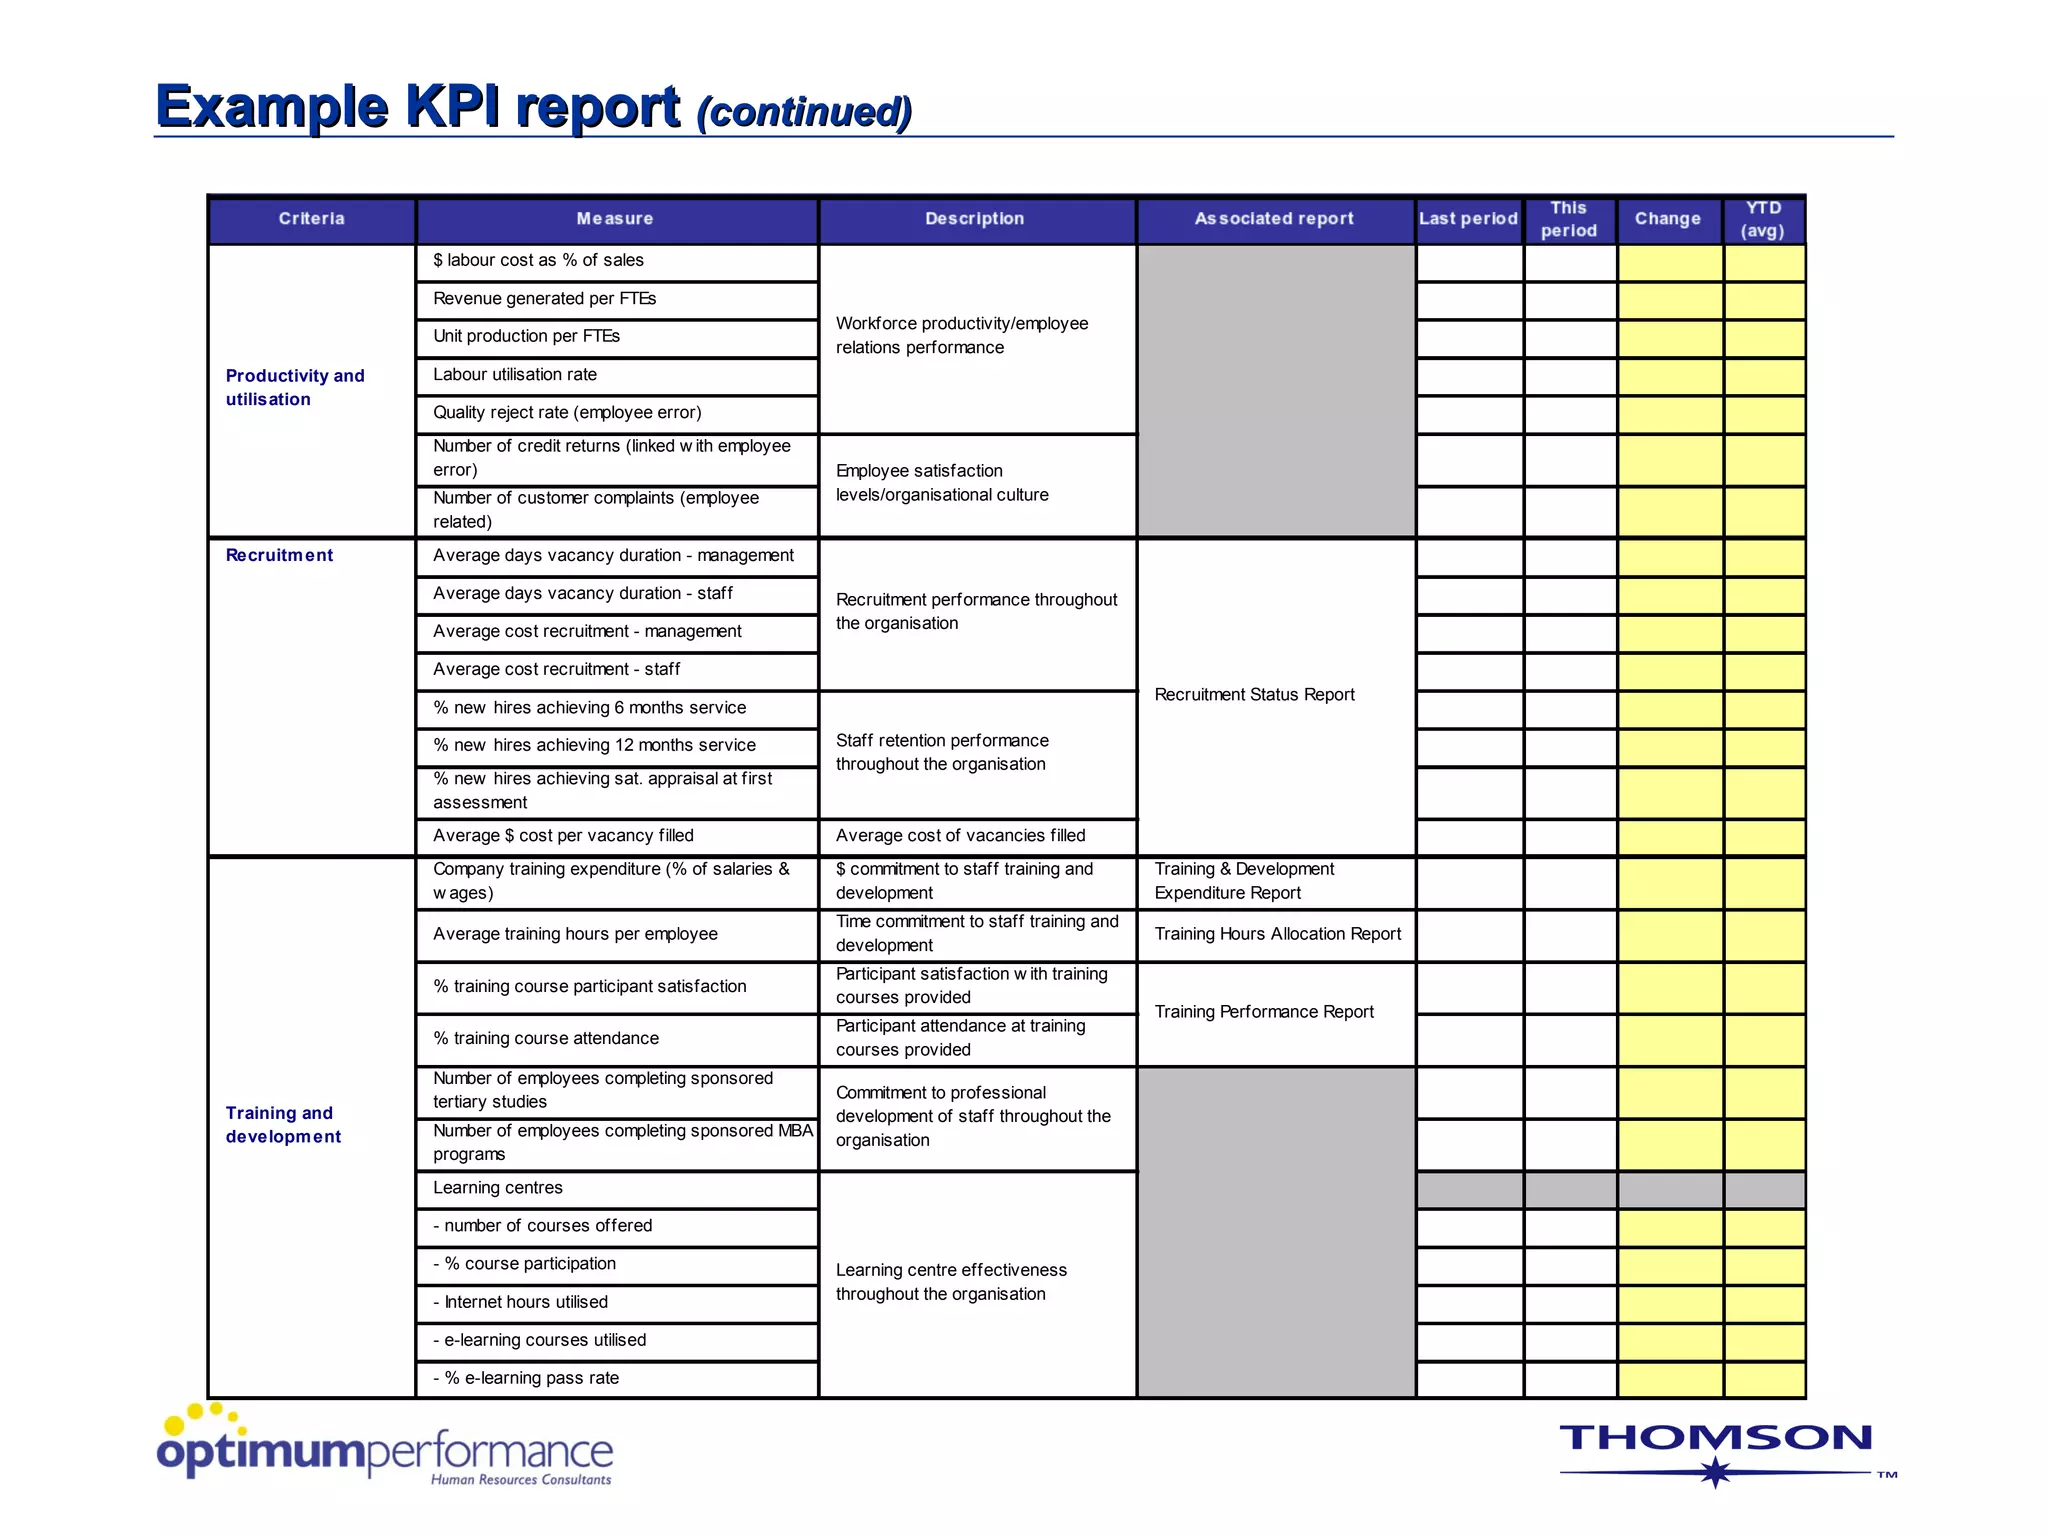
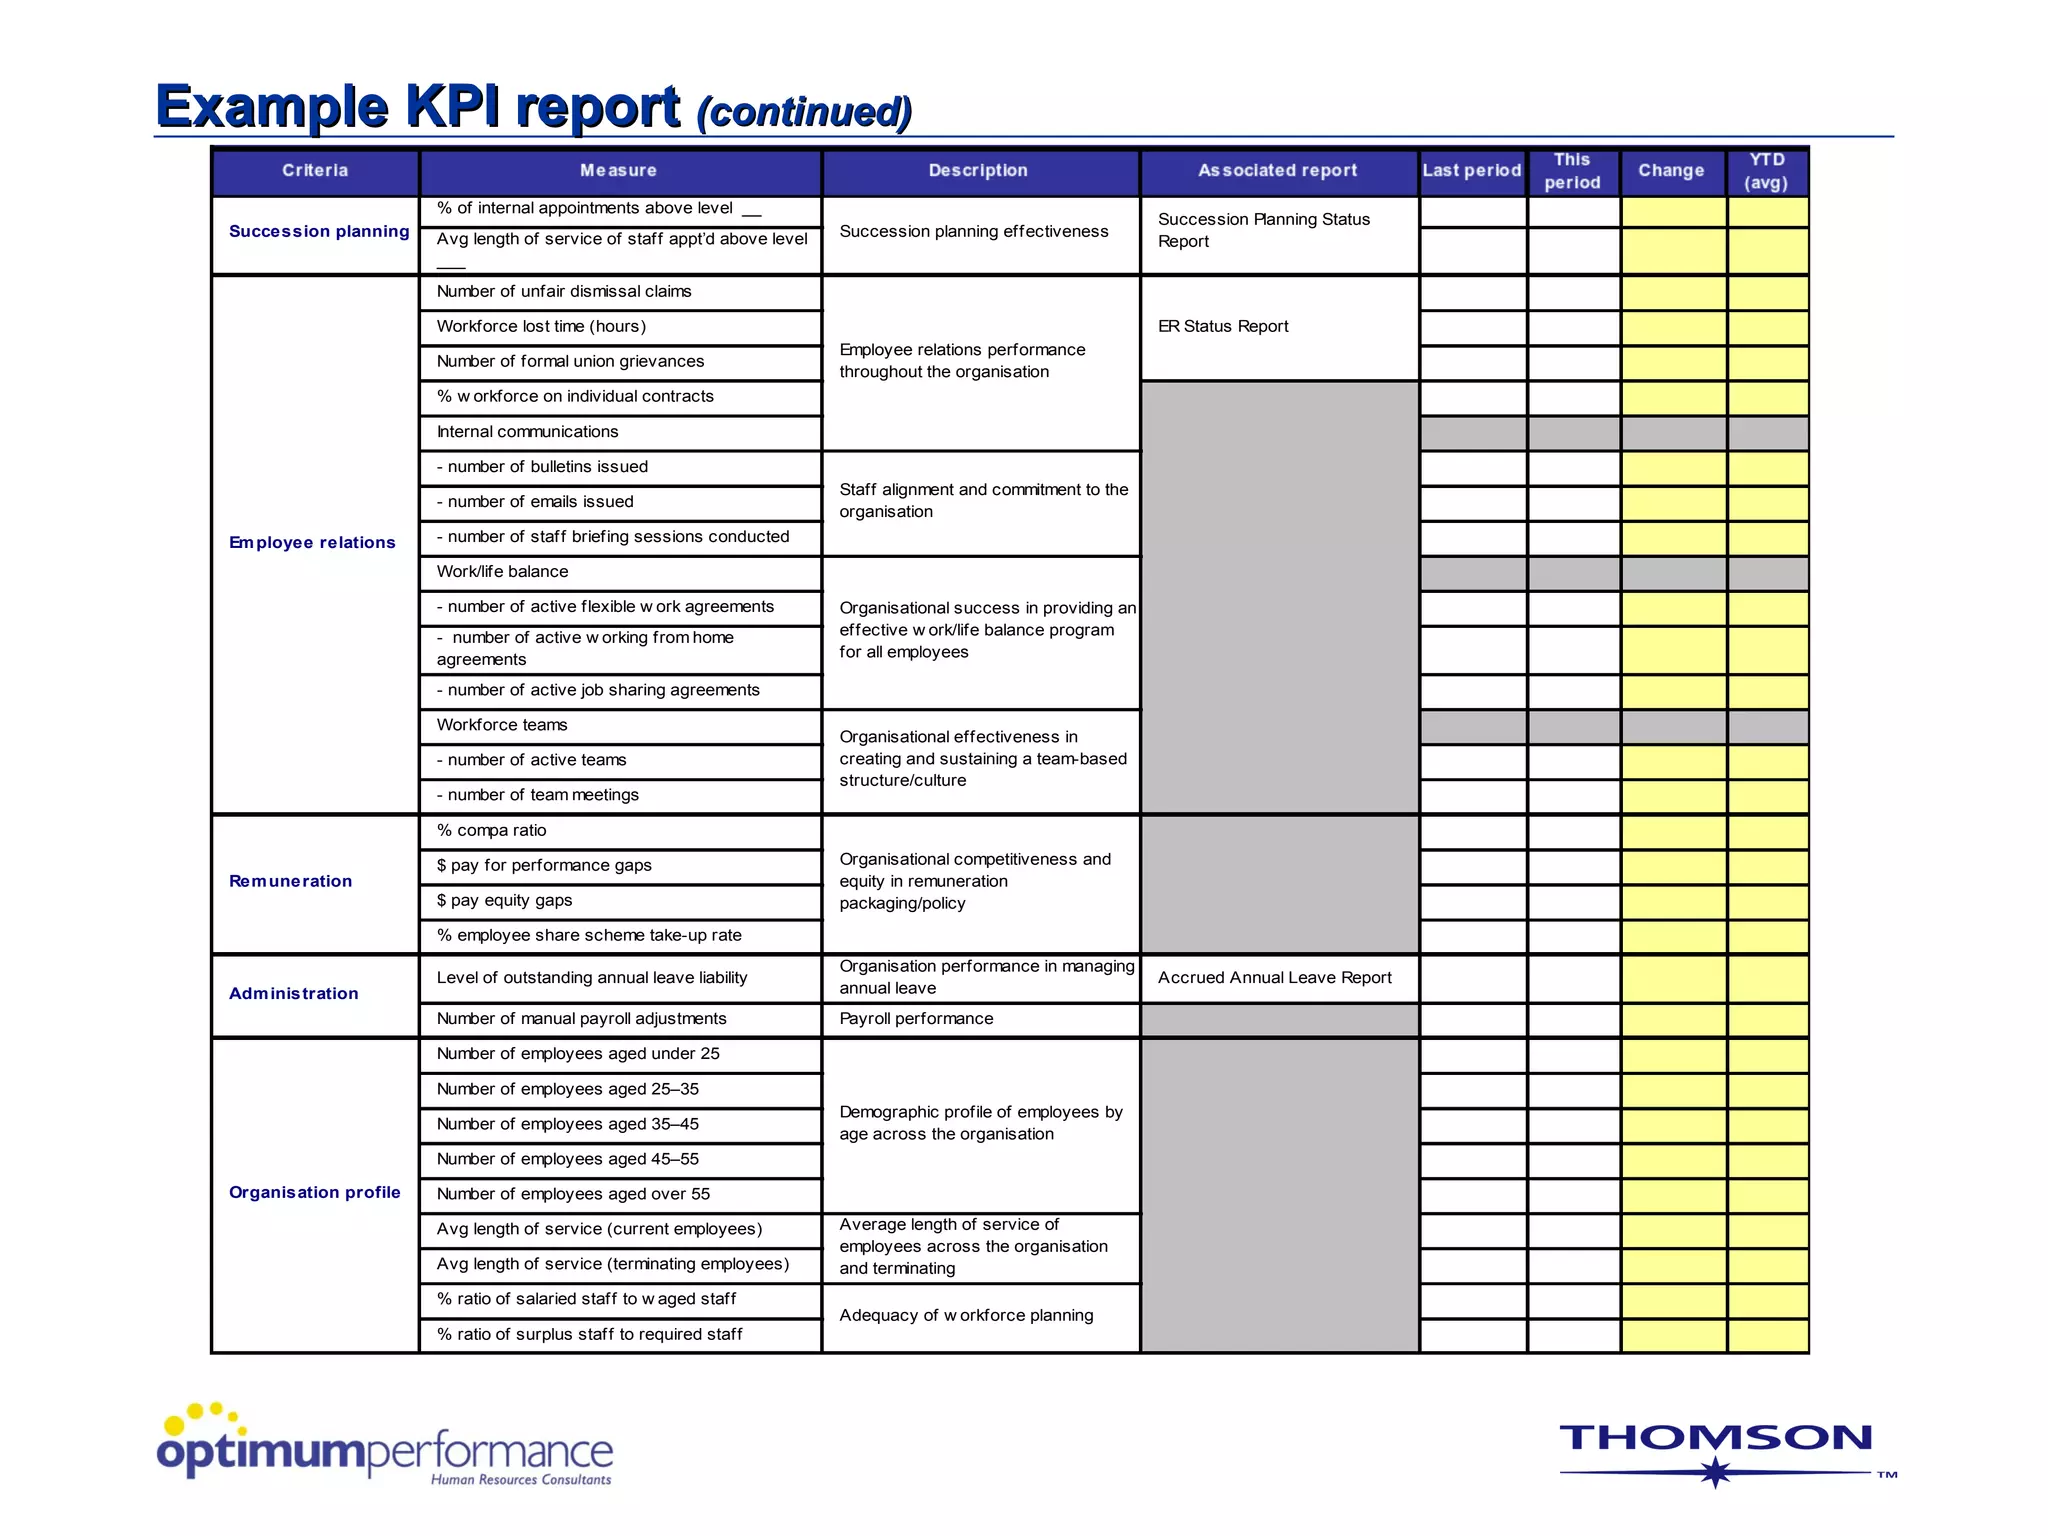
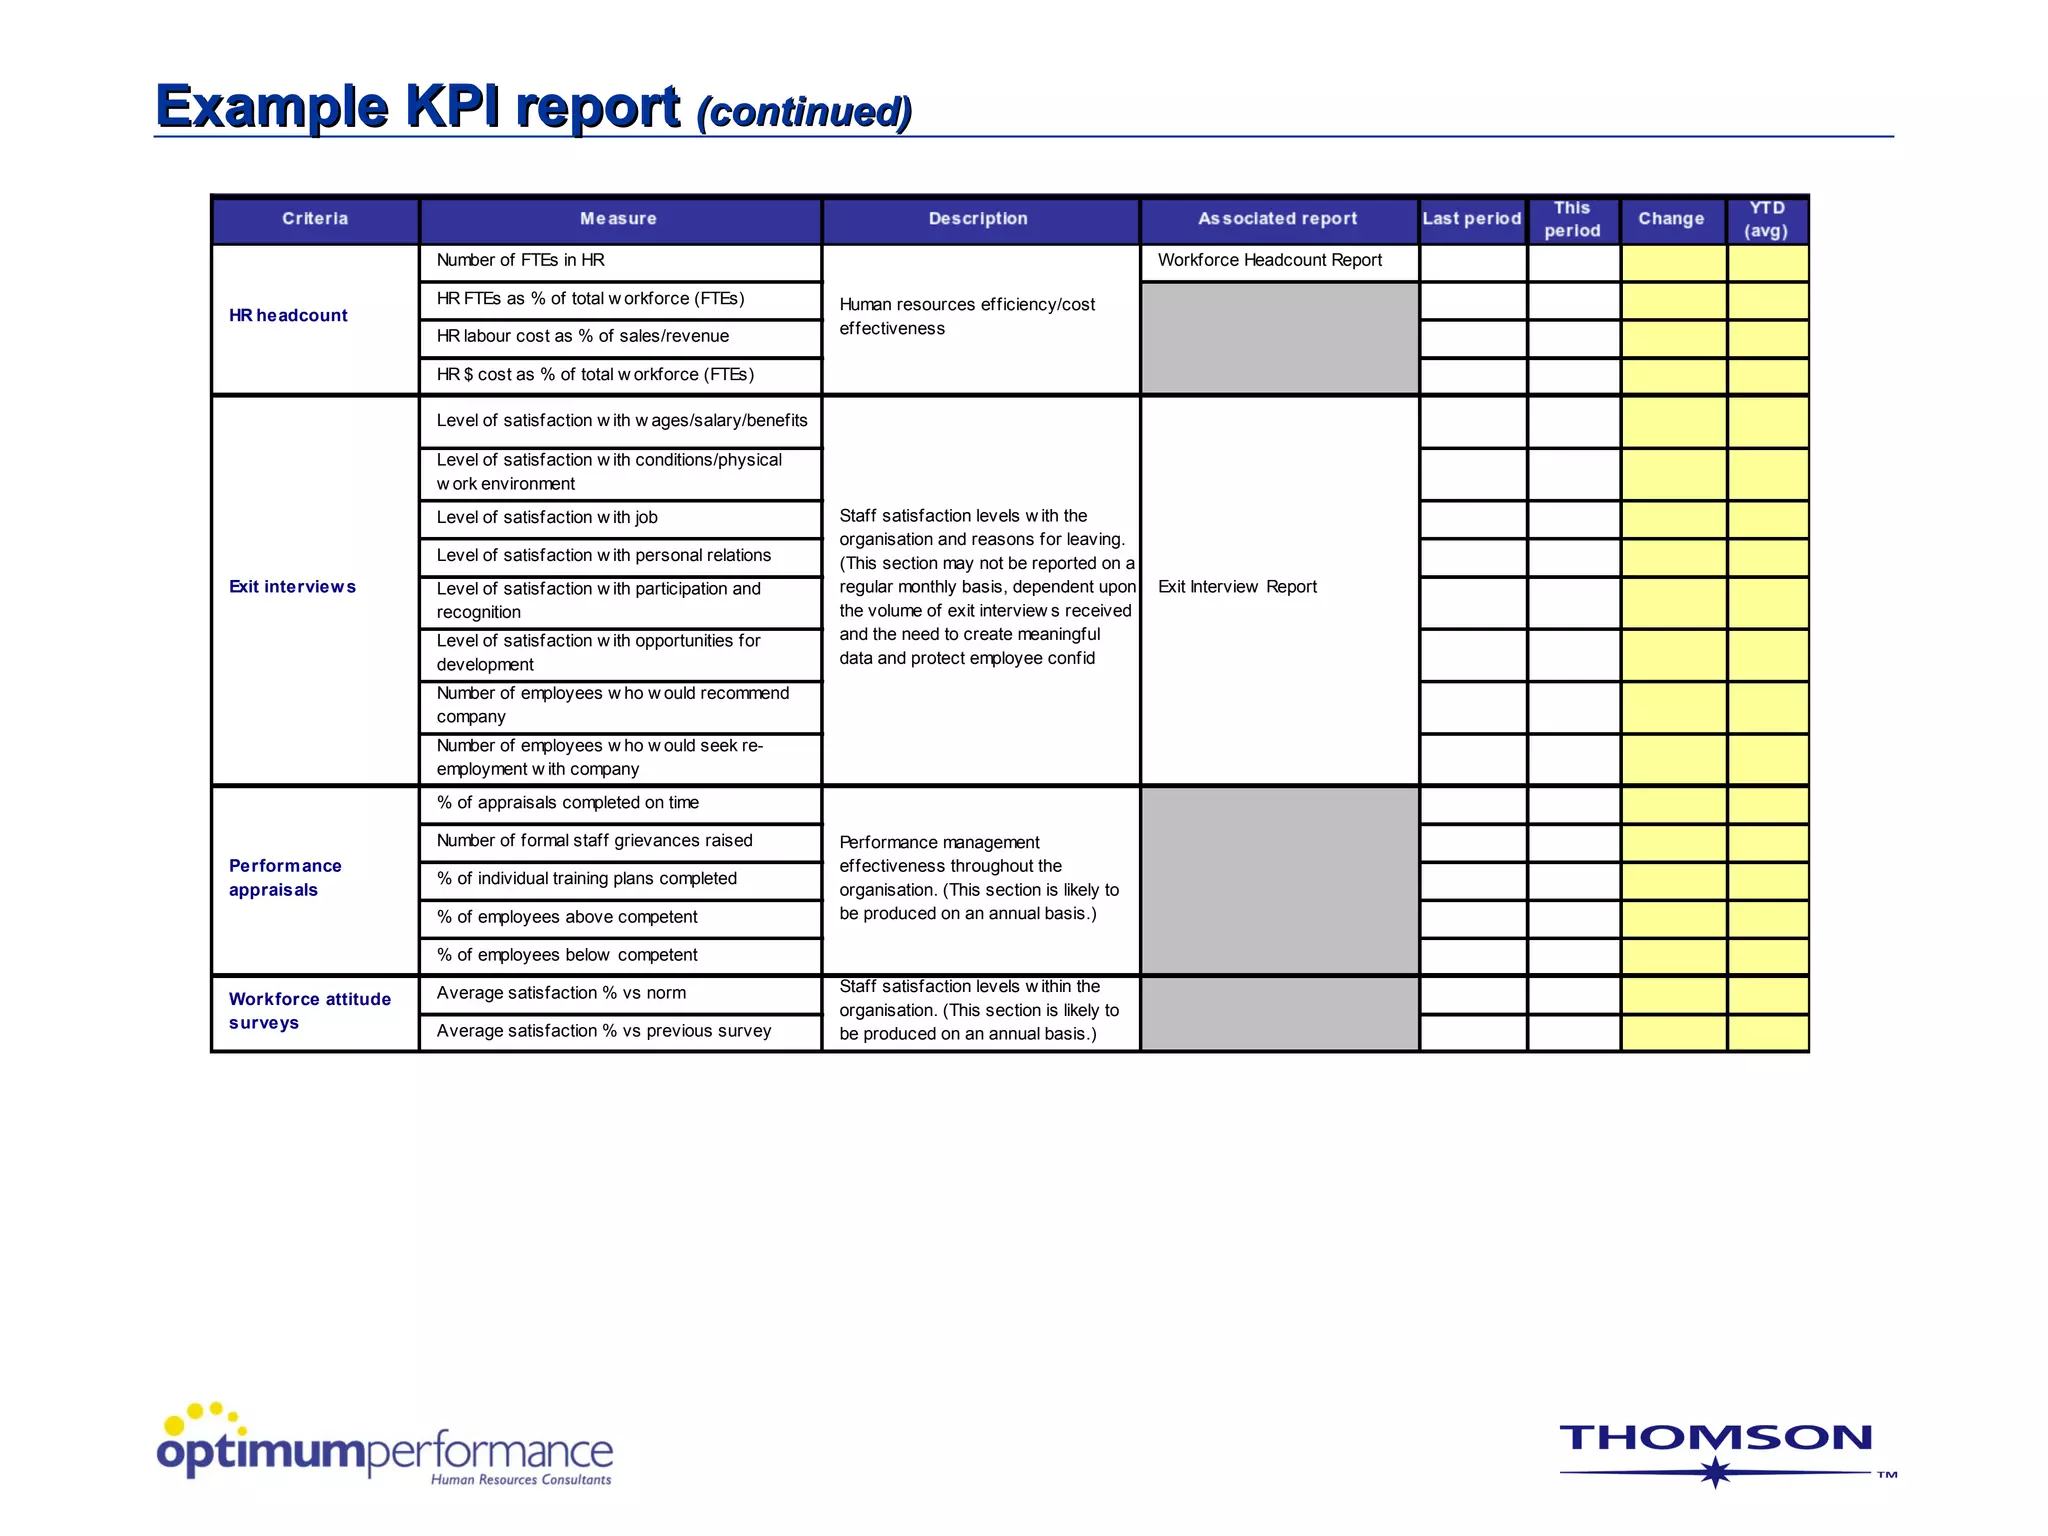
SlideShare a Scribd company logo
Introducing HR Measurement and
            Reporting
 Ensuring Executive Alignment and
          Understanding
Critical Question


Why would we want to measure human
resources…what value does it add?
Re-aligning the HR Contribution


 Enhance CEO/senior executive team understanding

 Demonstrate the opportunity available

 Re-align our thinking and contribution


Key performance indicators and detailed reporting
How CEOs and senior executives often view HR


   Business partners                                   Change agents


       Administrative                            Employee advocates
        specialists


       David Ulrich — HR Champions: The Next Agenda for Adding Value & Delivering Results, 1996
How HR wants to be viewed


   Business partners                                   Change agents


       Administrative                             Employee advocates
        specialists


        David Ulrich — HR Champions: The Next Agenda for Adding Value & Delivering Results, 1996
How HR wants to be viewed


   Business partners                                   Change agents
                                  = Missed
                                  opportunity!


       Administrative                             Employee advocates
        specialists


        David Ulrich — HR Champions: The Next Agenda for Adding Value & Delivering Results,
        1996
Stages in Human Resources functional development

                                               COMPETITIVE
                                               ADVANTAGE           Total line manager accountability
                                                                   Internal consultants
                                              (Consolidation)      Add value
                                                                   Integral to company success
                                       BUSINESS                    Long term vision and strategy
                                       PARTNERS  Integral contribution to business plan
                                      (Integrated)  Strong influence on other departments
                                                      Member of top team
                                                      Quality systems and processes
                           PROACTIVE                  Service management
                                                      Intellectual capital/knowledge management
                          (Rapid growth)  Customer/needs focused
                                                      Workforce empowerment and teams
                                            Pro-active/improvement
                                                      Return on investment
                                            Management development
                                                      Cost/benefit
                                            Leadership training analysis
                     INTERNAL
                                                      Comprehensive database
                                   Policies Succession planning
                                            and manuals
                       POLICE
                     (Emerging)  ControlsWorkforce planning
                                            — headcount, hiring,
                                  restructuring, travel, relocation
                                            Performance management
                                   Reporting systems & budgets
                                            Workforce productivity
                                   Basic measures — turnover,
          KIND HEARTS
        (Lending Support)        absenteeism
                              Cafeteria
                                   Technical and skills training
                             Car  IR disputes, grievances
                                  park
      BASIC                  Security
                                   OH&S procedures
                Recruitment Gymnasium
                            
      NEEDS
                Induction  Social club
                Payroll     Christmas party
                Admin/Records
                Leave
Human Resources transformation

                     From                            To
              industrial enterprise       knowledge-based enterprise


Service to      individual employees       stockholders

Service to      regulatory authorities     CEO
Creation of     workplace policies         business performance tools
Guardian of     workplace stability        core competencies
Chief           workforce administrator    finance officer for human capital
The global marketplace


  Emphasis on product             Squeeze on
      innovation                    margins


                                           Tighter cost
     Price                                    control
   sensitivity

                                        Shorter
        Enhanced                       lead times
     customer service


                 Workforce contribution?
Organisational critical success factors


                         Product quality

  Staff capability
                                           Competitive price


Product innovation
                                           Cost of labour


               Excellence in customer service


                     Workforce contribution?
CEO/senior executive team recognition...


To capitalise on workforce potential
The Human Resources contribution...


To optimise workforce performance
Search for the ‘Holy Grail’ of HR management

                    Theory X & Y       Hygiene and Motivators                      Emotional Intelligence


                                                      ?
   Management by Objectives
                                   Matrix      Kaizen        Empowerment
                Management Science
                                        MBWA           Customer Service    EVA
     Work Simplification
                                     Self-Directed Teams
                Hierarchy of Needs                           Benchmarking
                                               Excellence
     Plan-Organize-Direct-Control                                          Delayering
                                       Corporate Culture      7 Habits
Managerial Grid    Intrapreneuring Diversification
                                                                    Balanced Scorecard
                                                      Downsizing
       Human Relations       Organization Renewal
                                                              TQM      Work-life Balance
                                    Quality Circles
     Portfolio Management                               Continuous Improvement
                             Relationship
            Value Chain      Marketing
                              Change Management        Reengineering       Rightsizing
   Decision Tree
                     One Minute Managing


               0s              0s     60
                                           s          0s          0s          0s              0s     w
           4            19
                           5
                                    19         19
                                                  7
                                                           19
                                                              8
                                                                       19
                                                                          9            20
                                                                                          0        No
        19
Dilbert’s version of HRM!
HR perspective: organisational contribution


       Productivity                       Capability


                         Workforce


       Wellbeing                          Satisfaction
HR perspective: organisational contribution

Productivity
Labour costs
Labour mix and utilisation
Staff rostering and utilisation
New technology application
Cross-functional project teams
Employee participation/teams
Workforce forecasting
                                  Workforce
HR perspective: organisational contribution

                                    Capability
                                    Performance feedback
                                    Induction programs
                                    Technical and skills training
                                    Learning centres
                                    Tertiary assistance/MBAs
                                    Recruitment program
                                    Role clarity

                         Workforce
HR perspective: organisational contribution


                              Workforce

    Wellbeing
 Leadership training
 Non-discriminatory
 workplace
 Fair treatment process
 Safe work practices
 Equipment and physical
 factors
 Work–life balance programs
HR perspective: organisational contribution


                         Workforce

                                         Satisfaction

                                          Career path options
                                        Internal communication plan
                                      Remuneration and incentives
                                   Recognition and reward programs
                                   Effective payroll
                                   Human resources policy manual
CEO/senior executive perspective: ownership of workforce issues


                        Employees


   Senior executive team                          HR department
HR perspective: senior executive team accountabilities


                         Senior executive team


       Budget centres
                                          Hiring and firing

 Organisational charts
                                        Pay and promotions
HR perspective: ownership of workforce issues


                      Employees


Senior executive team                           HR department
Human Resources
Key Performance Indicators
HR Key performance indicators


Objectives and purpose

To highlight to the senior executive team:
• areas where the organisation is performing well
• areas where intervention is required
HR key performance indicators


Key principles

 One page, once per month
 Measuring organisational performance, not
  that of the HR Department
 Must be ‘big ticket items’ (business-linked)
 Must be user friendly and easy to understand
 Supported by detailed tables and/or graphs
HR key performance indicators


Key principles (continued)

  Contain credible/reliable information (start off
   slowly...be willing to amend/change)
  Progressively introduce agreed targets (internal,
   then external)
  Must become institutionalised within the senior
   management team
  HR team must be fully conversant
Example KPI report

HR Key Performance Indicator Report
For Period ended

                                                                                                                                                           This              YTD
       Criteria                              Measure                              Description                     Associated report         Last period            Change
                                                                                                                                                          period            (avg)
                      Number of FTEs                                   Changes in w orkforce numbers and     Workforce Headcount Report
 Headcount
                      Total hours utilised                             hours utilised by employee category   Workforce Utilisation Report

 Workforce turnover   % of total w orkforce terminating                Turnover performance and cost
                                                                                                             Workforce Turnover Report
 (unplanned)          Total $ cost of turnover                         impact upon the organisation

 Workforce            % total hours lost to absenteeism                Absenteeism performance and cost
 absenteeism                                                                                                 Workforce Absenteeism Report
                      Total $ cost                                     impact upon the organisation
 (unplanned)

                      Number of lost time injuries (LTI)

                      Number of lost time days                                                               Occupational Health & Safety
                                                                       Occupational health and safety
 Workers              Average duration rate of LTI                                                           Report
                                                                       performance throughout the
 com pensation
                      Frequency rate of LTI                            organisation

                                                                                                             Workers Compensation Costing
                      $ cost of w orkers compensation
                                                                                                             Report
                      Number of discrimination complaints rec’d

                      Number of sexual harassment complaints rec’d

                      Number of physical harassment complaints rec’d
                                                                       Equal employment opportunity and
 Equal em ploym ent   Number of w omen in management positions
                                                                       affirmative action performance        ER Status Report
 opportunity
                      - senior management                              throughout the organisation

                      - middle management

                      Ratio of female appointments vs male

                      % of w omen returning to w ork after mat leave
Example KPI report (continued)

                     $ labour cost as % of sales

                     Revenue generated per FTEs
                                                                       Workforce productivity/employee
                     Unit production per FTEs
                                                                       relations performance
  Productivity and   Labour utilisation rate
  utilisation
                     Quality reject rate (employee error)
                     Number of credit returns (linked w ith employee
                     error)                                            Employee satisfaction
                     Number of customer complaints (employee           levels/organisational culture
                     related)
  Recruitm ent       Average days vacancy duration - management

                     Average days vacancy duration - staff             Recruitment performance throughout
                     Average cost recruitment - management             the organisation

                     Average cost recruitment - staff
                                                                                                                 Recruitment Status Report
                     % new hires achieving 6 months service

                     % new hires achieving 12 months service           Staff retention performance
                                                                       throughout the organisation
                     % new hires achieving sat. appraisal at first
                     assessment
                     Average $ cost per vacancy filled                 Average cost of vacancies filled
                     Company training expenditure (% of salaries &     $ commitment to staff training and        Training & Development
                     w ages)                                           development                               Expenditure Report
                                                                       Time commitment to staff training and
                     Average training hours per employee                                                         Training Hours Allocation Report
                                                                       development
                                                                       Participant satisfaction w ith training
                     % training course participant satisfaction
                                                                       courses provided
                                                                                                                 Training Performance Report
                                                                       Participant attendance at training
                     % training course attendance
                                                                       courses provided
                     Number of employees completing sponsored
                                                                       Commitment to professional
                     tertiary studies
  Training and                                                         development of staff throughout the
  developm ent       Number of employees completing sponsored MBA
                                                                       organisation
                     programs
                     Learning centres

                     - number of courses offered

                     - % course participation                          Learning centre effectiveness
                     - Internet hours utilised                         throughout the organisation

                     - e-learning courses utilised

                     - % e-learning pass rate
Example KPI report (continued)
                         % of internal appointments above level __
                                                                                                                       Succession Planning Status
  Succession planning    Avg length of service of staf f appt’d above level   Succession planning eff ectiveness
                                                                                                                       Report
                         ___
                         Number of unfair dismissal claims

                         Workforce lost time (hours)                                                                   ER Status Report
                                                                              Employee relations performance
                         Number of formal union grievances
                                                                              throughout the organisation
                         % w orkforce on individual contracts

                         Internal communications

                         - number of bulletins issued
                                                                              Staff alignment and commitment to the
                         - number of emails issued
                                                                              organisation
  Em ployee relations    - number of staf f brief ing sessions conducted

                         Work/life balance

                         - number of active f lexible w ork agreements        Organisational success in providing an
                         - number of active w orking from home                ef fective w ork/life balance program
                         agreements                                           for all employees

                         - number of active job sharing agreements

                         Workforce teams
                                                                              Organisational effectiveness in
                         - number of active teams                             creating and sustaining a team-based
                                                                              structure/culture
                         - number of team meetings

                         % compa ratio

                         $ pay for performance gaps                           Organisational competitiveness and
  Rem une ration                                                              equity in remuneration
                         $ pay equity gaps                                    packaging/policy
                         % employee share scheme take-up rate
                                                                              Organisation performance in managing
                         Level of outstanding annual leave liability                                                   Accrued Annual Leave Report
  Adm inis tration                                                            annual leave
                         Number of manual payroll adjustments                 Payroll performance

                         Number of employees aged under 25

                         Number of employees aged 25–35
                                                                              Demographic profile of employees by
                         Number of employees aged 35–45
                                                                              age across the organisation
                         Number of employees aged 45–55

  Organisation profile   Number of employees aged over 55

                         Avg length of service (current employees)            Average length of service of
                                                                              employees across the organisation
                         Avg length of service (terminating employees)        and terminating
                         % ratio of salaried staf f to w aged staf f
                                                                              Adequacy of w orkforce planning
                         % ratio of surplus staf f to required staff
Example KPI report (continued)

                       Number of FTEs in HR                                                                            Workforce Headcount Report

                       HR FTEs as % of total w orkforce (FTEs)              Human resources efficiency/cost
  HR headcount
                       HR labour cost as % of sales/revenue                 effectiveness

                       HR $ cost as % of total w orkforce (FTEs)

                       Level of satisfaction w ith w ages/salary/benefits

                       Level of satisfaction w ith conditions/physical
                       w ork environment
                       Level of satisfaction w ith job                      Staff satisfaction levels w ith the
                                                                            organisation and reasons for leaving.
                       Level of satisfaction w ith personal relations       (This section may not be reported on a
  Exit interview s     Level of satisfaction w ith participation and        regular monthly basis, dependent upon      Exit Interview Report
                       recognition                                          the volume of exit interview s received
                       Level of satisfaction w ith opportunities for        and the need to create meaningful
                       development                                          data and protect employee confid

                       Number of employees w ho w ould recommend
                       company
                       Number of employees w ho w ould seek re-
                       employment w ith company
                       % of appraisals completed on time

                       Number of formal staff grievances raised             Performance management
  Perform ance                                                              effectiveness throughout the
                       % of individual training plans completed
  appraisals                                                                organisation. (This section is likely to
                       % of employees above competent                       be produced on an annual basis.)

                       % of employees below competent

                       Average satisfaction % vs norm                       Staff satisfaction levels w ithin the
  Workforce attitude
                                                                            organisation. (This section is likely to
  surveys              Average satisfaction % vs previous survey            be produced on an annual basis.)
Example headcount report
WORKFORCE HEADCOUNT REPORT
Period ending:


                                                              Headcount at end of last         Variation on last period                                              Variation on budget
                           Headcount at end of this period                                                                           Budgeted headcount
Departm ent                                                          period                            ( + or - )                                                           ( + or - )

                             FT     PT   Cas   Con    O/T    FT   PT    Cas   Con   O/T   FT       PT    Cas    Con       O/T   FT     PT   Cas   Con     O/T   FT    PT    Cas   Con

                 M'gment

                 Staff

                 Total

                 M'gment

                 Staff

                 Total

                 M'gment

                 Staff

                 Total

                 M'gment

                 Staff

                 Total

                 M'gment

                 Staff

                 Total

                 M'gment

                 Staff

                 Total
Example workforce utilisation report
WORKFORCE UTILISATION REPORT
Period ending:


                                                                 Variation on last
                            Hours utilised last   Hours utilised this                               Variation on budget
                                                                      period       Budgeted hours
Departm ent                      period                period                                              ( + or - )
                                                                     ( + or - )
                           FT PT Cas Con O/T FT PT Cas Con O/T FT PT Cas Con O/T FT PT Cas Con O/T FT PT Cas Con O/T

                 M'gment

                 Staff

                 Total

                 M'gment

                 Staff

                 Total

                 M'gment

                 Staff

                 Total

                 M'gment

                 Staff

                 Total

                 M'gment

                 Staff

                 Total

Total com pany
Example workforce turnover report
WORKFORCE TURNOVER REPORT
Period ending:

Summary results                               Current Period                       Year-to-date
Total management cost                     $                                    $
Total staff cost                          $                                    $
Total company cost                        $                                    $

                                                                       This period                                                  Year-to-date

                                                  Avg                                             Total cost for      Avg          Total                  Total cost
                                  $ Cost of                    Term inations       Turnover %                                                  Turnover
Departm ent                                    headcount                                             period        headcount   term inations                 YTD
                                  Turnover                      for period          for period                                                  % YTD
                                               for period                                                $            YTD          YTD                        $

                        M'gment

                        Staff

                        Total

                        M'gment

                        Staff

                        Total

                        M'gment

                        Staff

                        Total

                        M'gment

                        Staff

                        Total

                        M'gment

                        Staff

                        Total

Total com pany
Example workforce absenteeism report
WORKFORCE ABSENTEEISM REPORT (Unplanned Absenteeism)
Period ending:

Input values                                                                                                           Summary results                             Current Period                 Year to Date

Management standard hours per day                                                                                      Total management cost                  $                               $
Staff standard hours per day                                                                                           Total staff cost                       $                               $
                                                                                                                       Total company cost                     $                               $

                                                                                            Current period                                                                Year-to-date

                                                                                      Paid leave                  Total unplanned                                   Paid leave      Unpaid            Total unplanned
Department                                                 Total hours   Sick leave              Unpaid leave                             Total hours Sick leave
                                              $ Cost per                               (other)                     absenteeism                                       (other)         leave             absenteeism
                                                             available                                                                    available for
                                                 day
                                                            for period                                                            Cost        YTD                                                                  Cost
                                                                         Hrs    %     Hrs      %    Hrs      %   Hrs     %                              Hrs %       Hrs    %        Hrs   %        Hrs      %
                                                                                                                                   $                                                                                $
                                    M'gment

                                    Staff

                                    Total

                                    M'gment

                                    Staff

                                    Total

                                    M'gment

                                    Staff

                                    Total

                                    M'gment

                                    Staff

                                    Total

Total company
Instructions


 Please note, this slide does not form part of the presentation. It is included for user guidance only.

 This Powerpoint presentation contains instructional notes that support each slide. The presentation should
 open at the ‘Notes page view’ (that is, you should be able to see Powerpoint slides and notes below the slides).
 If you cannot see the Notes, select View/Notes Pages from the Toolbar.


 In the Notes Page view, you can move through the Powerpoint presentation by using the ‘page up’ and ‘page
 down’ keys on your keyboard or by clicking on the double arrows at the bottom right of your screen.

 To hide the Notes pages and view only the Powerpoint slides, select View/Slide show from the Toolbar. Either
 click on the double arrows or use the ‘page down’ key to advance to each new slide.

More Related Content

What's hot

1. strategic talent management
1. strategic talent management1. strategic talent management
1. strategic talent management
Bima Hermastho
 
Strategic Performance Management
Strategic Performance ManagementStrategic Performance Management
Strategic Performance Management
Elijah Ezendu
 
Competency framework
Competency frameworkCompetency framework
Competency framework
guest8eb6ae
 
Learning and Development standards 30 may 2018
Learning and Development standards 30 may 2018Learning and Development standards 30 may 2018
Learning and Development standards 30 may 2018
SABPP
 
Human resource manager performance appraisal
Human resource manager performance appraisalHuman resource manager performance appraisal
Human resource manager performance appraisal
evansaaron775
 
Hay jobs evaluation
Hay jobs evaluationHay jobs evaluation
Hay jobs evaluation
HR Association
 
HR SCORECARD Human Resource Scorecard PPT Slides
HR SCORECARD Human Resource Scorecard PPT SlidesHR SCORECARD Human Resource Scorecard PPT Slides
HR SCORECARD Human Resource Scorecard PPT Slides
Yodhia Antariksa
 
Job Analysis_Evaluation_Grading_Process and Tools
Job Analysis_Evaluation_Grading_Process and ToolsJob Analysis_Evaluation_Grading_Process and Tools
Job Analysis_Evaluation_Grading_Process and Tools
Charles Cotter, PhD
 
Job evaluation-hay-guidance
Job evaluation-hay-guidanceJob evaluation-hay-guidance
Job evaluation-hay-guidance
SharifHossain74
 
Hay Group
Hay GroupHay Group
Hay summary
Hay summaryHay summary
Job evaluation and grading – process and systems
Job evaluation and grading  – process and systemsJob evaluation and grading  – process and systems
Job evaluation and grading – process and systems
Charles Cotter, PhD
 
HR Challenges and HR Strategic Answers
HR Challenges and HR Strategic AnswersHR Challenges and HR Strategic Answers
HR Challenges and HR Strategic Answers
CreativeHRM
 
Set Your KPI’s
Set Your KPI’sSet Your KPI’s
Set Your KPI’s
todkaz
 
10 Things HR Can Do to Help Align an Organization’s Goals
10 Things HR Can Do to Help Align an Organization’s Goals10 Things HR Can Do to Help Align an Organization’s Goals
10 Things HR Can Do to Help Align an Organization’s Goals
Human Capital Media
 
Performance management
Performance management Performance management
Performance management
vildan esenyel
 
A New Blueprint for HR
A New Blueprint for HRA New Blueprint for HR
A New Blueprint for HR
accenture
 
Hr Competencies Presentation
Hr Competencies PresentationHr Competencies Presentation
Hr Competencies Presentation
Geoff Verschoor
 
Talent Acquisition Plan
Talent Acquisition PlanTalent Acquisition Plan
Talent Acquisition Plan
Dave Anderson
 
Overview of HR Shared Services
Overview of HR Shared ServicesOverview of HR Shared Services
Overview of HR Shared Services
William Chin
 

What's hot (20)

1. strategic talent management
1. strategic talent management1. strategic talent management
1. strategic talent management
 
Strategic Performance Management
Strategic Performance ManagementStrategic Performance Management
Strategic Performance Management
 
Competency framework
Competency frameworkCompetency framework
Competency framework
 
Learning and Development standards 30 may 2018
Learning and Development standards 30 may 2018Learning and Development standards 30 may 2018
Learning and Development standards 30 may 2018
 
Human resource manager performance appraisal
Human resource manager performance appraisalHuman resource manager performance appraisal
Human resource manager performance appraisal
 
Hay jobs evaluation
Hay jobs evaluationHay jobs evaluation
Hay jobs evaluation
 
HR SCORECARD Human Resource Scorecard PPT Slides
HR SCORECARD Human Resource Scorecard PPT SlidesHR SCORECARD Human Resource Scorecard PPT Slides
HR SCORECARD Human Resource Scorecard PPT Slides
 
Job Analysis_Evaluation_Grading_Process and Tools
Job Analysis_Evaluation_Grading_Process and ToolsJob Analysis_Evaluation_Grading_Process and Tools
Job Analysis_Evaluation_Grading_Process and Tools
 
Job evaluation-hay-guidance
Job evaluation-hay-guidanceJob evaluation-hay-guidance
Job evaluation-hay-guidance
 
Hay Group
Hay GroupHay Group
Hay Group
 
Hay summary
Hay summaryHay summary
Hay summary
 
Job evaluation and grading – process and systems
Job evaluation and grading  – process and systemsJob evaluation and grading  – process and systems
Job evaluation and grading – process and systems
 
HR Challenges and HR Strategic Answers
HR Challenges and HR Strategic AnswersHR Challenges and HR Strategic Answers
HR Challenges and HR Strategic Answers
 
Set Your KPI’s
Set Your KPI’sSet Your KPI’s
Set Your KPI’s
 
10 Things HR Can Do to Help Align an Organization’s Goals
10 Things HR Can Do to Help Align an Organization’s Goals10 Things HR Can Do to Help Align an Organization’s Goals
10 Things HR Can Do to Help Align an Organization’s Goals
 
Performance management
Performance management Performance management
Performance management
 
A New Blueprint for HR
A New Blueprint for HRA New Blueprint for HR
A New Blueprint for HR
 
Hr Competencies Presentation
Hr Competencies PresentationHr Competencies Presentation
Hr Competencies Presentation
 
Talent Acquisition Plan
Talent Acquisition PlanTalent Acquisition Plan
Talent Acquisition Plan
 
Overview of HR Shared Services
Overview of HR Shared ServicesOverview of HR Shared Services
Overview of HR Shared Services
 

Similar to Hr intro

Red tag
Red tagRed tag
Ebook Employee Engagement Performance Management
Ebook Employee Engagement Performance ManagementEbook Employee Engagement Performance Management
Ebook Employee Engagement Performance Management
Bullseye Performance Management
 
JD Edwards & Peoplesoft 3 _ Linda Hemsworth _ PeopleSoft HCM 9.1 Achieving Ta...
JD Edwards & Peoplesoft 3 _ Linda Hemsworth _ PeopleSoft HCM 9.1 Achieving Ta...JD Edwards & Peoplesoft 3 _ Linda Hemsworth _ PeopleSoft HCM 9.1 Achieving Ta...
JD Edwards & Peoplesoft 3 _ Linda Hemsworth _ PeopleSoft HCM 9.1 Achieving Ta...
InSync2011
 
Chapter 01
Chapter 01Chapter 01
Chapter 01
anshu_10
 
People Performance Practitioners
People Performance Practitioners People Performance Practitioners
People Performance Practitioners
Soumitra Das
 
People performance practitioners
People performance practitionersPeople performance practitioners
People performance practitioners
Soumitra Das
 
HR and Efficency Solutions
HR and Efficency SolutionsHR and Efficency Solutions
HR and Efficency Solutions
baryonssoftsolutions
 
The HRS Approach
The HRS ApproachThe HRS Approach
The HRS Approach
wcaudle
 
Performance management 2013 webinar
Performance management 2013 webinarPerformance management 2013 webinar
Performance management 2013 webinar
Bullseye Performance Management
 
Performance Management: Erik Luts
Performance Management: Erik LutsPerformance Management: Erik Luts
Performance Management: Erik Luts
Vlerick Business School
 
"Views on 2030" by Dr. Robin Mann
"Views on 2030" by Dr. Robin Mann"Views on 2030" by Dr. Robin Mann
"Views on 2030" by Dr. Robin Mann
Dubai Quality Group
 
Services Of Exercise Lean Group
Services Of Exercise Lean GroupServices Of Exercise Lean Group
Services Of Exercise Lean Group
ExerciseLeanLLC
 
Leadership map by Mr Sudhakar Rao at HRRT organised by ISPE & UPES Dehradun
Leadership map by Mr Sudhakar Rao at HRRT organised by ISPE & UPES DehradunLeadership map by Mr Sudhakar Rao at HRRT organised by ISPE & UPES Dehradun
Leadership map by Mr Sudhakar Rao at HRRT organised by ISPE & UPES Dehradun
UPES Dehradun
 
Organisation Change, Management Development & Communications Consulting and T...
Organisation Change, Management Development & Communications Consulting and T...Organisation Change, Management Development & Communications Consulting and T...
Organisation Change, Management Development & Communications Consulting and T...
journal72
 
Enterprise Directions
Enterprise DirectionsEnterprise Directions
Enterprise Directions
Arnaldo Colombo
 
Peoplepro Management Services Pvt. Ltd.
Peoplepro Management Services Pvt. Ltd.Peoplepro Management Services Pvt. Ltd.
Peoplepro Management Services Pvt. Ltd.
anibandha
 
Hr@Brain Tower Middle East
Hr@Brain Tower Middle EastHr@Brain Tower Middle East
Hr@Brain Tower Middle East
britt_thyssen
 
Transformance for high performance
Transformance for high performanceTransformance for high performance
Transformance for high performance
Michael Walters
 
Nividh Hcm Bi
Nividh Hcm BiNividh Hcm Bi
Nividh Hcm Bi
Mahesh Tiwari
 
Apg Capabilities V3
Apg Capabilities V3Apg Capabilities V3
Apg Capabilities V3
MrktPwrPnts
 

Similar to Hr intro (20)

Red tag
Red tagRed tag
Red tag
 
Ebook Employee Engagement Performance Management
Ebook Employee Engagement Performance ManagementEbook Employee Engagement Performance Management
Ebook Employee Engagement Performance Management
 
JD Edwards & Peoplesoft 3 _ Linda Hemsworth _ PeopleSoft HCM 9.1 Achieving Ta...
JD Edwards & Peoplesoft 3 _ Linda Hemsworth _ PeopleSoft HCM 9.1 Achieving Ta...JD Edwards & Peoplesoft 3 _ Linda Hemsworth _ PeopleSoft HCM 9.1 Achieving Ta...
JD Edwards & Peoplesoft 3 _ Linda Hemsworth _ PeopleSoft HCM 9.1 Achieving Ta...
 
Chapter 01
Chapter 01Chapter 01
Chapter 01
 
People Performance Practitioners
People Performance Practitioners People Performance Practitioners
People Performance Practitioners
 
People performance practitioners
People performance practitionersPeople performance practitioners
People performance practitioners
 
HR and Efficency Solutions
HR and Efficency SolutionsHR and Efficency Solutions
HR and Efficency Solutions
 
The HRS Approach
The HRS ApproachThe HRS Approach
The HRS Approach
 
Performance management 2013 webinar
Performance management 2013 webinarPerformance management 2013 webinar
Performance management 2013 webinar
 
Performance Management: Erik Luts
Performance Management: Erik LutsPerformance Management: Erik Luts
Performance Management: Erik Luts
 
"Views on 2030" by Dr. Robin Mann
"Views on 2030" by Dr. Robin Mann"Views on 2030" by Dr. Robin Mann
"Views on 2030" by Dr. Robin Mann
 
Services Of Exercise Lean Group
Services Of Exercise Lean GroupServices Of Exercise Lean Group
Services Of Exercise Lean Group
 
Leadership map by Mr Sudhakar Rao at HRRT organised by ISPE & UPES Dehradun
Leadership map by Mr Sudhakar Rao at HRRT organised by ISPE & UPES DehradunLeadership map by Mr Sudhakar Rao at HRRT organised by ISPE & UPES Dehradun
Leadership map by Mr Sudhakar Rao at HRRT organised by ISPE & UPES Dehradun
 
Organisation Change, Management Development & Communications Consulting and T...
Organisation Change, Management Development & Communications Consulting and T...Organisation Change, Management Development & Communications Consulting and T...
Organisation Change, Management Development & Communications Consulting and T...
 
Enterprise Directions
Enterprise DirectionsEnterprise Directions
Enterprise Directions
 
Peoplepro Management Services Pvt. Ltd.
Peoplepro Management Services Pvt. Ltd.Peoplepro Management Services Pvt. Ltd.
Peoplepro Management Services Pvt. Ltd.
 
Hr@Brain Tower Middle East
Hr@Brain Tower Middle EastHr@Brain Tower Middle East
Hr@Brain Tower Middle East
 
Transformance for high performance
Transformance for high performanceTransformance for high performance
Transformance for high performance
 
Nividh Hcm Bi
Nividh Hcm BiNividh Hcm Bi
Nividh Hcm Bi
 
Apg Capabilities V3
Apg Capabilities V3Apg Capabilities V3
Apg Capabilities V3
 

More from Dr. Stefanus MS Sadana

0 Kompetensi MSDM.pdf
0 Kompetensi MSDM.pdf0 Kompetensi MSDM.pdf
0 Kompetensi MSDM.pdf
Dr. Stefanus MS Sadana
 
ICEM 2013 Mengelola Penolakan Perubahan
ICEM 2013 Mengelola Penolakan PerubahanICEM 2013 Mengelola Penolakan Perubahan
ICEM 2013 Mengelola Penolakan Perubahan
Dr. Stefanus MS Sadana
 
2016 Indonesia Multi Finance Award
2016 Indonesia Multi Finance Award 2016 Indonesia Multi Finance Award
2016 Indonesia Multi Finance Award
Dr. Stefanus MS Sadana
 
Lsp msdm-skema sertifikasi manajer pengelolaan sdm
Lsp msdm-skema sertifikasi manajer pengelolaan sdmLsp msdm-skema sertifikasi manajer pengelolaan sdm
Lsp msdm-skema sertifikasi manajer pengelolaan sdm
Dr. Stefanus MS Sadana
 
Lsp msdm-skema sertifikasi supervisor pengelolaan sdm
Lsp msdm-skema sertifikasi supervisor pengelolaan sdmLsp msdm-skema sertifikasi supervisor pengelolaan sdm
Lsp msdm-skema sertifikasi supervisor pengelolaan sdm
Dr. Stefanus MS Sadana
 
Lsp msdm-skema sertifikasi supervisor pengelolaan sdm
Lsp msdm-skema sertifikasi supervisor pengelolaan sdmLsp msdm-skema sertifikasi supervisor pengelolaan sdm
Lsp msdm-skema sertifikasi supervisor pengelolaan sdm
Dr. Stefanus MS Sadana
 
General banking-tingkat-i-officer
General banking-tingkat-i-officerGeneral banking-tingkat-i-officer
General banking-tingkat-i-officer
Dr. Stefanus MS Sadana
 
Coaching for bank mutiara
Coaching for bank mutiaraCoaching for bank mutiara
Coaching for bank mutiara
Dr. Stefanus MS Sadana
 
Manajemen Risiko level-1
Manajemen Risiko level-1Manajemen Risiko level-1
Manajemen Risiko level-1
Dr. Stefanus MS Sadana
 
Telaah kritis kompetensi msdm indonesia 2014
Telaah kritis kompetensi msdm indonesia 2014Telaah kritis kompetensi msdm indonesia 2014
Telaah kritis kompetensi msdm indonesia 2014
Dr. Stefanus MS Sadana
 
Grafonomi untuk frontliner: teller dan customer service
Grafonomi untuk frontliner: teller dan customer serviceGrafonomi untuk frontliner: teller dan customer service
Grafonomi untuk frontliner: teller dan customer service
Dr. Stefanus MS Sadana
 
empowering for bank mutiara
empowering for bank mutiara empowering for bank mutiara
empowering for bank mutiara
Dr. Stefanus MS Sadana
 
Review part 1 grafonomi 2016
Review part 1 grafonomi 2016Review part 1 grafonomi 2016
Review part 1 grafonomi 2016
Dr. Stefanus MS Sadana
 
Service Excellence
Service Excellence Service Excellence
Service Excellence
Dr. Stefanus MS Sadana
 

More from Dr. Stefanus MS Sadana (15)

0 Kompetensi MSDM.pdf
0 Kompetensi MSDM.pdf0 Kompetensi MSDM.pdf
0 Kompetensi MSDM.pdf
 
ICEM 2013 Mengelola Penolakan Perubahan
ICEM 2013 Mengelola Penolakan PerubahanICEM 2013 Mengelola Penolakan Perubahan
ICEM 2013 Mengelola Penolakan Perubahan
 
2016 Indonesia Multi Finance Award
2016 Indonesia Multi Finance Award 2016 Indonesia Multi Finance Award
2016 Indonesia Multi Finance Award
 
Lsp msdm-skema sertifikasi manajer pengelolaan sdm
Lsp msdm-skema sertifikasi manajer pengelolaan sdmLsp msdm-skema sertifikasi manajer pengelolaan sdm
Lsp msdm-skema sertifikasi manajer pengelolaan sdm
 
Lsp msdm-skema sertifikasi supervisor pengelolaan sdm
Lsp msdm-skema sertifikasi supervisor pengelolaan sdmLsp msdm-skema sertifikasi supervisor pengelolaan sdm
Lsp msdm-skema sertifikasi supervisor pengelolaan sdm
 
Lsp msdm-skema sertifikasi supervisor pengelolaan sdm
Lsp msdm-skema sertifikasi supervisor pengelolaan sdmLsp msdm-skema sertifikasi supervisor pengelolaan sdm
Lsp msdm-skema sertifikasi supervisor pengelolaan sdm
 
General banking-tingkat-i-officer
General banking-tingkat-i-officerGeneral banking-tingkat-i-officer
General banking-tingkat-i-officer
 
Coaching for bank mutiara
Coaching for bank mutiaraCoaching for bank mutiara
Coaching for bank mutiara
 
Manajemen Risiko level-1
Manajemen Risiko level-1Manajemen Risiko level-1
Manajemen Risiko level-1
 
Telaah kritis kompetensi msdm indonesia 2014
Telaah kritis kompetensi msdm indonesia 2014Telaah kritis kompetensi msdm indonesia 2014
Telaah kritis kompetensi msdm indonesia 2014
 
Grafonomi untuk frontliner: teller dan customer service
Grafonomi untuk frontliner: teller dan customer serviceGrafonomi untuk frontliner: teller dan customer service
Grafonomi untuk frontliner: teller dan customer service
 
empowering for bank mutiara
empowering for bank mutiara empowering for bank mutiara
empowering for bank mutiara
 
Review part 1 grafonomi 2016
Review part 1 grafonomi 2016Review part 1 grafonomi 2016
Review part 1 grafonomi 2016
 
Service Excellence
Service Excellence Service Excellence
Service Excellence
 
Hr champion
Hr championHr champion
Hr champion
 

Recently uploaded

Top mailing list providers in the USA.pptx
Top mailing list providers in the USA.pptxTop mailing list providers in the USA.pptx
Top mailing list providers in the USA.pptx
JeremyPeirce1
 
❼❷⓿❺❻❷❽❷❼❽ Dpboss Matka Result Satta Matka Guessing Satta Fix jodi Kalyan Fin...
❼❷⓿❺❻❷❽❷❼❽ Dpboss Matka Result Satta Matka Guessing Satta Fix jodi Kalyan Fin...❼❷⓿❺❻❷❽❷❼❽ Dpboss Matka Result Satta Matka Guessing Satta Fix jodi Kalyan Fin...
❼❷⓿❺❻❷❽❷❼❽ Dpboss Matka Result Satta Matka Guessing Satta Fix jodi Kalyan Fin...
❼❷⓿❺❻❷❽❷❼❽ Dpboss Kalyan Satta Matka Guessing Matka Result Main Bazar chart
 
Income Tax exemption for Start up : Section 80 IAC
Income Tax  exemption for Start up : Section 80 IACIncome Tax  exemption for Start up : Section 80 IAC
Income Tax exemption for Start up : Section 80 IAC
CA Dr. Prithvi Ranjan Parhi
 
Brian Fitzsimmons on the Business Strategy and Content Flywheel of Barstool S...
Brian Fitzsimmons on the Business Strategy and Content Flywheel of Barstool S...Brian Fitzsimmons on the Business Strategy and Content Flywheel of Barstool S...
Brian Fitzsimmons on the Business Strategy and Content Flywheel of Barstool S...
Neil Horowitz
 
Dpboss Matka Guessing Satta Matta Matka Kalyan Chart Satta Matka
Dpboss Matka Guessing Satta Matta Matka Kalyan Chart Satta MatkaDpboss Matka Guessing Satta Matta Matka Kalyan Chart Satta Matka
Dpboss Matka Guessing Satta Matta Matka Kalyan Chart Satta Matka
➒➌➎➏➑➐➋➑➐➐Dpboss Matka Guessing Satta Matka Kalyan Chart Indian Matka
 
Business storytelling: key ingredients to a story
Business storytelling: key ingredients to a storyBusiness storytelling: key ingredients to a story
Business storytelling: key ingredients to a story
Alexandra Fulford
 
Best practices for project execution and delivery
Best practices for project execution and deliveryBest practices for project execution and delivery
Best practices for project execution and delivery
CLIVE MINCHIN
 
Call 8867766396 Satta Matka Dpboss Matka Guessing Satta batta Matka 420 Satta...
Call 8867766396 Satta Matka Dpboss Matka Guessing Satta batta Matka 420 Satta...Call 8867766396 Satta Matka Dpboss Matka Guessing Satta batta Matka 420 Satta...
Call 8867766396 Satta Matka Dpboss Matka Guessing Satta batta Matka 420 Satta...
bosssp10
 
Zodiac Signs and Food Preferences_ What Your Sign Says About Your Taste
Zodiac Signs and Food Preferences_ What Your Sign Says About Your TasteZodiac Signs and Food Preferences_ What Your Sign Says About Your Taste
Zodiac Signs and Food Preferences_ What Your Sign Says About Your Taste
my Pandit
 
2022 Vintage Roman Numerals Men Rings
2022 Vintage Roman  Numerals  Men  Rings2022 Vintage Roman  Numerals  Men  Rings
2022 Vintage Roman Numerals Men Rings
aragme
 
Understanding User Needs and Satisfying Them
Understanding User Needs and Satisfying ThemUnderstanding User Needs and Satisfying Them
Understanding User Needs and Satisfying Them
Aggregage
 
The Heart of Leadership_ How Emotional Intelligence Drives Business Success B...
The Heart of Leadership_ How Emotional Intelligence Drives Business Success B...The Heart of Leadership_ How Emotional Intelligence Drives Business Success B...
The Heart of Leadership_ How Emotional Intelligence Drives Business Success B...
Stephen Cashman
 
Event Report - SAP Sapphire 2024 Orlando - lots of innovation and old challenges
Event Report - SAP Sapphire 2024 Orlando - lots of innovation and old challengesEvent Report - SAP Sapphire 2024 Orlando - lots of innovation and old challenges
Event Report - SAP Sapphire 2024 Orlando - lots of innovation and old challenges
Holger Mueller
 
Industrial Tech SW: Category Renewal and Creation
Industrial Tech SW:  Category Renewal and CreationIndustrial Tech SW:  Category Renewal and Creation
Industrial Tech SW: Category Renewal and Creation
Christian Dahlen
 
The Genesis of BriansClub.cm Famous Dark WEb Platform
The Genesis of BriansClub.cm Famous Dark WEb PlatformThe Genesis of BriansClub.cm Famous Dark WEb Platform
The Genesis of BriansClub.cm Famous Dark WEb Platform
SabaaSudozai
 
Structural Design Process: Step-by-Step Guide for Buildings
Structural Design Process: Step-by-Step Guide for BuildingsStructural Design Process: Step-by-Step Guide for Buildings
Structural Design Process: Step-by-Step Guide for Buildings
Chandresh Chudasama
 
Mastering B2B Payments Webinar from BlueSnap
Mastering B2B Payments Webinar from BlueSnapMastering B2B Payments Webinar from BlueSnap
Mastering B2B Payments Webinar from BlueSnap
Norma Mushkat Gaffin
 
Chapter 7 Final business management sciences .ppt
Chapter 7 Final business management sciences .pptChapter 7 Final business management sciences .ppt
Chapter 7 Final business management sciences .ppt
ssuser567e2d
 
Satta Matka Dpboss Matka Guessing Kalyan Chart Indian Matka Kalyan panel Chart
Satta Matka Dpboss Matka Guessing Kalyan Chart Indian Matka Kalyan panel ChartSatta Matka Dpboss Matka Guessing Kalyan Chart Indian Matka Kalyan panel Chart
Satta Matka Dpboss Matka Guessing Kalyan Chart Indian Matka Kalyan panel Chart
➒➌➎➏➑➐➋➑➐➐Dpboss Matka Guessing Satta Matka Kalyan Chart Indian Matka
 
HOW TO START UP A COMPANY A STEP-BY-STEP GUIDE.pdf
HOW TO START UP A COMPANY A STEP-BY-STEP GUIDE.pdfHOW TO START UP A COMPANY A STEP-BY-STEP GUIDE.pdf
HOW TO START UP A COMPANY A STEP-BY-STEP GUIDE.pdf
46adnanshahzad
 

Recently uploaded (20)

Top mailing list providers in the USA.pptx
Top mailing list providers in the USA.pptxTop mailing list providers in the USA.pptx
Top mailing list providers in the USA.pptx
 
❼❷⓿❺❻❷❽❷❼❽ Dpboss Matka Result Satta Matka Guessing Satta Fix jodi Kalyan Fin...
❼❷⓿❺❻❷❽❷❼❽ Dpboss Matka Result Satta Matka Guessing Satta Fix jodi Kalyan Fin...❼❷⓿❺❻❷❽❷❼❽ Dpboss Matka Result Satta Matka Guessing Satta Fix jodi Kalyan Fin...
❼❷⓿❺❻❷❽❷❼❽ Dpboss Matka Result Satta Matka Guessing Satta Fix jodi Kalyan Fin...
 
Income Tax exemption for Start up : Section 80 IAC
Income Tax  exemption for Start up : Section 80 IACIncome Tax  exemption for Start up : Section 80 IAC
Income Tax exemption for Start up : Section 80 IAC
 
Brian Fitzsimmons on the Business Strategy and Content Flywheel of Barstool S...
Brian Fitzsimmons on the Business Strategy and Content Flywheel of Barstool S...Brian Fitzsimmons on the Business Strategy and Content Flywheel of Barstool S...
Brian Fitzsimmons on the Business Strategy and Content Flywheel of Barstool S...
 
Dpboss Matka Guessing Satta Matta Matka Kalyan Chart Satta Matka
Dpboss Matka Guessing Satta Matta Matka Kalyan Chart Satta MatkaDpboss Matka Guessing Satta Matta Matka Kalyan Chart Satta Matka
Dpboss Matka Guessing Satta Matta Matka Kalyan Chart Satta Matka
 
Business storytelling: key ingredients to a story
Business storytelling: key ingredients to a storyBusiness storytelling: key ingredients to a story
Business storytelling: key ingredients to a story
 
Best practices for project execution and delivery
Best practices for project execution and deliveryBest practices for project execution and delivery
Best practices for project execution and delivery
 
Call 8867766396 Satta Matka Dpboss Matka Guessing Satta batta Matka 420 Satta...
Call 8867766396 Satta Matka Dpboss Matka Guessing Satta batta Matka 420 Satta...Call 8867766396 Satta Matka Dpboss Matka Guessing Satta batta Matka 420 Satta...
Call 8867766396 Satta Matka Dpboss Matka Guessing Satta batta Matka 420 Satta...
 
Zodiac Signs and Food Preferences_ What Your Sign Says About Your Taste
Zodiac Signs and Food Preferences_ What Your Sign Says About Your TasteZodiac Signs and Food Preferences_ What Your Sign Says About Your Taste
Zodiac Signs and Food Preferences_ What Your Sign Says About Your Taste
 
2022 Vintage Roman Numerals Men Rings
2022 Vintage Roman  Numerals  Men  Rings2022 Vintage Roman  Numerals  Men  Rings
2022 Vintage Roman Numerals Men Rings
 
Understanding User Needs and Satisfying Them
Understanding User Needs and Satisfying ThemUnderstanding User Needs and Satisfying Them
Understanding User Needs and Satisfying Them
 
The Heart of Leadership_ How Emotional Intelligence Drives Business Success B...
The Heart of Leadership_ How Emotional Intelligence Drives Business Success B...The Heart of Leadership_ How Emotional Intelligence Drives Business Success B...
The Heart of Leadership_ How Emotional Intelligence Drives Business Success B...
 
Event Report - SAP Sapphire 2024 Orlando - lots of innovation and old challenges
Event Report - SAP Sapphire 2024 Orlando - lots of innovation and old challengesEvent Report - SAP Sapphire 2024 Orlando - lots of innovation and old challenges
Event Report - SAP Sapphire 2024 Orlando - lots of innovation and old challenges
 
Industrial Tech SW: Category Renewal and Creation
Industrial Tech SW:  Category Renewal and CreationIndustrial Tech SW:  Category Renewal and Creation
Industrial Tech SW: Category Renewal and Creation
 
The Genesis of BriansClub.cm Famous Dark WEb Platform
The Genesis of BriansClub.cm Famous Dark WEb PlatformThe Genesis of BriansClub.cm Famous Dark WEb Platform
The Genesis of BriansClub.cm Famous Dark WEb Platform
 
Structural Design Process: Step-by-Step Guide for Buildings
Structural Design Process: Step-by-Step Guide for BuildingsStructural Design Process: Step-by-Step Guide for Buildings
Structural Design Process: Step-by-Step Guide for Buildings
 
Mastering B2B Payments Webinar from BlueSnap
Mastering B2B Payments Webinar from BlueSnapMastering B2B Payments Webinar from BlueSnap
Mastering B2B Payments Webinar from BlueSnap
 
Chapter 7 Final business management sciences .ppt
Chapter 7 Final business management sciences .pptChapter 7 Final business management sciences .ppt
Chapter 7 Final business management sciences .ppt
 
Satta Matka Dpboss Matka Guessing Kalyan Chart Indian Matka Kalyan panel Chart
Satta Matka Dpboss Matka Guessing Kalyan Chart Indian Matka Kalyan panel ChartSatta Matka Dpboss Matka Guessing Kalyan Chart Indian Matka Kalyan panel Chart
Satta Matka Dpboss Matka Guessing Kalyan Chart Indian Matka Kalyan panel Chart
 
HOW TO START UP A COMPANY A STEP-BY-STEP GUIDE.pdf
HOW TO START UP A COMPANY A STEP-BY-STEP GUIDE.pdfHOW TO START UP A COMPANY A STEP-BY-STEP GUIDE.pdf
HOW TO START UP A COMPANY A STEP-BY-STEP GUIDE.pdf
 

Hr intro

  • 1. Introducing HR Measurement and Reporting Ensuring Executive Alignment and Understanding
  • 2. Critical Question Why would we want to measure human resources…what value does it add?
  • 3. Re-aligning the HR Contribution  Enhance CEO/senior executive team understanding  Demonstrate the opportunity available  Re-align our thinking and contribution Key performance indicators and detailed reporting
  • 4. How CEOs and senior executives often view HR Business partners Change agents Administrative Employee advocates specialists David Ulrich — HR Champions: The Next Agenda for Adding Value & Delivering Results, 1996
  • 5. How HR wants to be viewed Business partners Change agents Administrative Employee advocates specialists David Ulrich — HR Champions: The Next Agenda for Adding Value & Delivering Results, 1996
  • 6. How HR wants to be viewed Business partners Change agents = Missed opportunity! Administrative Employee advocates specialists David Ulrich — HR Champions: The Next Agenda for Adding Value & Delivering Results, 1996
  • 7. Stages in Human Resources functional development COMPETITIVE ADVANTAGE  Total line manager accountability  Internal consultants (Consolidation)  Add value  Integral to company success BUSINESS  Long term vision and strategy PARTNERS  Integral contribution to business plan (Integrated)  Strong influence on other departments  Member of top team  Quality systems and processes PROACTIVE  Service management  Intellectual capital/knowledge management (Rapid growth)  Customer/needs focused  Workforce empowerment and teams  Pro-active/improvement  Return on investment  Management development  Cost/benefit  Leadership training analysis INTERNAL  Comprehensive database  Policies Succession planning  and manuals POLICE (Emerging)  ControlsWorkforce planning  — headcount, hiring, restructuring, travel, relocation  Performance management  Reporting systems & budgets  Workforce productivity  Basic measures — turnover, KIND HEARTS (Lending Support)  absenteeism Cafeteria  Technical and skills training  Car  IR disputes, grievances park BASIC  Security  OH&S procedures  Recruitment Gymnasium  NEEDS  Induction  Social club  Payroll  Christmas party  Admin/Records  Leave
  • 8. Human Resources transformation From To industrial enterprise knowledge-based enterprise Service to individual employees stockholders Service to regulatory authorities CEO Creation of workplace policies business performance tools Guardian of workplace stability core competencies Chief workforce administrator finance officer for human capital
  • 9. The global marketplace Emphasis on product Squeeze on innovation margins Tighter cost Price control sensitivity Shorter Enhanced lead times customer service Workforce contribution?
  • 10. Organisational critical success factors Product quality Staff capability Competitive price Product innovation Cost of labour Excellence in customer service Workforce contribution?
  • 11. CEO/senior executive team recognition... To capitalise on workforce potential
  • 12. The Human Resources contribution... To optimise workforce performance
  • 13. Search for the ‘Holy Grail’ of HR management Theory X & Y Hygiene and Motivators Emotional Intelligence ? Management by Objectives Matrix Kaizen Empowerment Management Science MBWA Customer Service EVA Work Simplification Self-Directed Teams Hierarchy of Needs Benchmarking Excellence Plan-Organize-Direct-Control Delayering Corporate Culture 7 Habits Managerial Grid Intrapreneuring Diversification Balanced Scorecard Downsizing Human Relations Organization Renewal TQM Work-life Balance Quality Circles Portfolio Management Continuous Improvement Relationship Value Chain Marketing Change Management Reengineering Rightsizing Decision Tree One Minute Managing 0s 0s 60 s 0s 0s 0s 0s w 4 19 5 19 19 7 19 8 19 9 20 0 No 19
  • 15. HR perspective: organisational contribution Productivity Capability Workforce Wellbeing Satisfaction
  • 16. HR perspective: organisational contribution Productivity Labour costs Labour mix and utilisation Staff rostering and utilisation New technology application Cross-functional project teams Employee participation/teams Workforce forecasting Workforce
  • 17. HR perspective: organisational contribution Capability Performance feedback Induction programs Technical and skills training Learning centres Tertiary assistance/MBAs Recruitment program Role clarity Workforce
  • 18. HR perspective: organisational contribution Workforce Wellbeing Leadership training Non-discriminatory workplace Fair treatment process Safe work practices Equipment and physical factors Work–life balance programs
  • 19. HR perspective: organisational contribution Workforce Satisfaction Career path options Internal communication plan Remuneration and incentives Recognition and reward programs Effective payroll Human resources policy manual
  • 20. CEO/senior executive perspective: ownership of workforce issues Employees Senior executive team HR department
  • 21. HR perspective: senior executive team accountabilities Senior executive team Budget centres Hiring and firing Organisational charts Pay and promotions
  • 22. HR perspective: ownership of workforce issues Employees Senior executive team HR department
  • 24. HR Key performance indicators Objectives and purpose To highlight to the senior executive team: • areas where the organisation is performing well • areas where intervention is required
  • 25. HR key performance indicators Key principles  One page, once per month  Measuring organisational performance, not that of the HR Department  Must be ‘big ticket items’ (business-linked)  Must be user friendly and easy to understand  Supported by detailed tables and/or graphs
  • 26. HR key performance indicators Key principles (continued)  Contain credible/reliable information (start off slowly...be willing to amend/change)  Progressively introduce agreed targets (internal, then external)  Must become institutionalised within the senior management team  HR team must be fully conversant
  • 27. Example KPI report HR Key Performance Indicator Report For Period ended This YTD Criteria Measure Description Associated report Last period Change period (avg) Number of FTEs Changes in w orkforce numbers and Workforce Headcount Report Headcount Total hours utilised hours utilised by employee category Workforce Utilisation Report Workforce turnover % of total w orkforce terminating Turnover performance and cost Workforce Turnover Report (unplanned) Total $ cost of turnover impact upon the organisation Workforce % total hours lost to absenteeism Absenteeism performance and cost absenteeism Workforce Absenteeism Report Total $ cost impact upon the organisation (unplanned) Number of lost time injuries (LTI) Number of lost time days Occupational Health & Safety Occupational health and safety Workers Average duration rate of LTI Report performance throughout the com pensation Frequency rate of LTI organisation Workers Compensation Costing $ cost of w orkers compensation Report Number of discrimination complaints rec’d Number of sexual harassment complaints rec’d Number of physical harassment complaints rec’d Equal employment opportunity and Equal em ploym ent Number of w omen in management positions affirmative action performance ER Status Report opportunity - senior management throughout the organisation - middle management Ratio of female appointments vs male % of w omen returning to w ork after mat leave
  • 28. Example KPI report (continued) $ labour cost as % of sales Revenue generated per FTEs Workforce productivity/employee Unit production per FTEs relations performance Productivity and Labour utilisation rate utilisation Quality reject rate (employee error) Number of credit returns (linked w ith employee error) Employee satisfaction Number of customer complaints (employee levels/organisational culture related) Recruitm ent Average days vacancy duration - management Average days vacancy duration - staff Recruitment performance throughout Average cost recruitment - management the organisation Average cost recruitment - staff Recruitment Status Report % new hires achieving 6 months service % new hires achieving 12 months service Staff retention performance throughout the organisation % new hires achieving sat. appraisal at first assessment Average $ cost per vacancy filled Average cost of vacancies filled Company training expenditure (% of salaries & $ commitment to staff training and Training & Development w ages) development Expenditure Report Time commitment to staff training and Average training hours per employee Training Hours Allocation Report development Participant satisfaction w ith training % training course participant satisfaction courses provided Training Performance Report Participant attendance at training % training course attendance courses provided Number of employees completing sponsored Commitment to professional tertiary studies Training and development of staff throughout the developm ent Number of employees completing sponsored MBA organisation programs Learning centres - number of courses offered - % course participation Learning centre effectiveness - Internet hours utilised throughout the organisation - e-learning courses utilised - % e-learning pass rate
  • 29. Example KPI report (continued) % of internal appointments above level __ Succession Planning Status Succession planning Avg length of service of staf f appt’d above level Succession planning eff ectiveness Report ___ Number of unfair dismissal claims Workforce lost time (hours) ER Status Report Employee relations performance Number of formal union grievances throughout the organisation % w orkforce on individual contracts Internal communications - number of bulletins issued Staff alignment and commitment to the - number of emails issued organisation Em ployee relations - number of staf f brief ing sessions conducted Work/life balance - number of active f lexible w ork agreements Organisational success in providing an - number of active w orking from home ef fective w ork/life balance program agreements for all employees - number of active job sharing agreements Workforce teams Organisational effectiveness in - number of active teams creating and sustaining a team-based structure/culture - number of team meetings % compa ratio $ pay for performance gaps Organisational competitiveness and Rem une ration equity in remuneration $ pay equity gaps packaging/policy % employee share scheme take-up rate Organisation performance in managing Level of outstanding annual leave liability Accrued Annual Leave Report Adm inis tration annual leave Number of manual payroll adjustments Payroll performance Number of employees aged under 25 Number of employees aged 25–35 Demographic profile of employees by Number of employees aged 35–45 age across the organisation Number of employees aged 45–55 Organisation profile Number of employees aged over 55 Avg length of service (current employees) Average length of service of employees across the organisation Avg length of service (terminating employees) and terminating % ratio of salaried staf f to w aged staf f Adequacy of w orkforce planning % ratio of surplus staf f to required staff
  • 30. Example KPI report (continued) Number of FTEs in HR Workforce Headcount Report HR FTEs as % of total w orkforce (FTEs) Human resources efficiency/cost HR headcount HR labour cost as % of sales/revenue effectiveness HR $ cost as % of total w orkforce (FTEs) Level of satisfaction w ith w ages/salary/benefits Level of satisfaction w ith conditions/physical w ork environment Level of satisfaction w ith job Staff satisfaction levels w ith the organisation and reasons for leaving. Level of satisfaction w ith personal relations (This section may not be reported on a Exit interview s Level of satisfaction w ith participation and regular monthly basis, dependent upon Exit Interview Report recognition the volume of exit interview s received Level of satisfaction w ith opportunities for and the need to create meaningful development data and protect employee confid Number of employees w ho w ould recommend company Number of employees w ho w ould seek re- employment w ith company % of appraisals completed on time Number of formal staff grievances raised Performance management Perform ance effectiveness throughout the % of individual training plans completed appraisals organisation. (This section is likely to % of employees above competent be produced on an annual basis.) % of employees below competent Average satisfaction % vs norm Staff satisfaction levels w ithin the Workforce attitude organisation. (This section is likely to surveys Average satisfaction % vs previous survey be produced on an annual basis.)
  • 31. Example headcount report WORKFORCE HEADCOUNT REPORT Period ending: Headcount at end of last Variation on last period Variation on budget Headcount at end of this period Budgeted headcount Departm ent period ( + or - ) ( + or - ) FT PT Cas Con O/T FT PT Cas Con O/T FT PT Cas Con O/T FT PT Cas Con O/T FT PT Cas Con M'gment Staff Total M'gment Staff Total M'gment Staff Total M'gment Staff Total M'gment Staff Total M'gment Staff Total
  • 32. Example workforce utilisation report WORKFORCE UTILISATION REPORT Period ending: Variation on last Hours utilised last Hours utilised this Variation on budget period Budgeted hours Departm ent period period ( + or - ) ( + or - ) FT PT Cas Con O/T FT PT Cas Con O/T FT PT Cas Con O/T FT PT Cas Con O/T FT PT Cas Con O/T M'gment Staff Total M'gment Staff Total M'gment Staff Total M'gment Staff Total M'gment Staff Total Total com pany
  • 33. Example workforce turnover report WORKFORCE TURNOVER REPORT Period ending: Summary results Current Period Year-to-date Total management cost $ $ Total staff cost $ $ Total company cost $ $ This period Year-to-date Avg Total cost for Avg Total Total cost $ Cost of Term inations Turnover % Turnover Departm ent headcount period headcount term inations YTD Turnover for period for period % YTD for period $ YTD YTD $ M'gment Staff Total M'gment Staff Total M'gment Staff Total M'gment Staff Total M'gment Staff Total Total com pany
  • 34. Example workforce absenteeism report WORKFORCE ABSENTEEISM REPORT (Unplanned Absenteeism) Period ending: Input values Summary results Current Period Year to Date Management standard hours per day Total management cost $ $ Staff standard hours per day Total staff cost $ $ Total company cost $ $ Current period Year-to-date Paid leave Total unplanned Paid leave Unpaid Total unplanned Department Total hours Sick leave Unpaid leave Total hours Sick leave $ Cost per (other) absenteeism (other) leave absenteeism available available for day for period Cost YTD Cost Hrs % Hrs % Hrs % Hrs % Hrs % Hrs % Hrs % Hrs % $ $ M'gment Staff Total M'gment Staff Total M'gment Staff Total M'gment Staff Total Total company
  • 35. Instructions Please note, this slide does not form part of the presentation. It is included for user guidance only. This Powerpoint presentation contains instructional notes that support each slide. The presentation should open at the ‘Notes page view’ (that is, you should be able to see Powerpoint slides and notes below the slides). If you cannot see the Notes, select View/Notes Pages from the Toolbar. In the Notes Page view, you can move through the Powerpoint presentation by using the ‘page up’ and ‘page down’ keys on your keyboard or by clicking on the double arrows at the bottom right of your screen. To hide the Notes pages and view only the Powerpoint slides, select View/Slide show from the Toolbar. Either click on the double arrows or use the ‘page down’ key to advance to each new slide.

Editor's Notes

  1. Our interactions with HR professionals in large and small, and private and public organisations all over Australia tell us that while HR professionals generally see the merit of introducing comprehensive human resources business reporting they are ultimately concerned about the following: If the CEO/senior executive team does not presently understand the role played and contribution made by HR, what is the point of introducing reports? They will not be valued. If comprehensive reporting is introduced by the HR department, the CEO/senior executive team will assume that current performance levels and thereafter identified solutions are ultimately the HR manager’s responsibility. Therefore, the starting point in this presentation is to address these two fundamental issues: why would we want to measure HR, and what value does it add?
  2. This slide identifies the path the presentation will follow: enhancing CEO/senior executive team understanding of why they should value HR demonstrating the potential opportunity linked to the business the role HR should play going forward where HR KPIs and measurement tools fit.
  3. This slide provides an illustration of a balanced scorecard model developed by well known HR identity, Professor David Ulrich from the University of Michigan. The model attempts to outline the four key roles that HR plays in any organisation (and to suggest that there should be an equal contribution in all four areas). The problem (as highlighted) is that many CEOs/line managers have HR ‘tagged’ as contributing in only two of the four areas, where the role is principally one of administration and advice.
  4. This slide highlights how HR wants to be viewed by the organisation and how its functional role should be spread across all quadrants. (That is, there is an opportunity for HR to contribute much more if there is greater recognition and support of its capacity.)
  5. This slide highlights how HR wants to be viewed by the organisation and how its functional role should be spread across all quadrants. (That is, there is an opportunity for HR to contribute much more if there is greater recognition and support of its capacity.)
  6. Reinforcing the previous slides, this slide illustrates how HR usually starts in an organisation, and how its role progressively develops/changes over time. Unfortunately, in many organisations the function does not develop beyond the third step (internal police) where it remains principally focused on policies, procedures, controls and administration. It is only when the HR function progresses/is enabled to take additional steps that it becomes more proactive and customer focused, and thereby capable of making value-added contributions in increasingly broader areas of business performance. (i.e. Again highlighting the opportunity available to the CEO/senior executive team.)
  7. This slide is intended to highlight the changing role that HR has played in leading organisations over the past decade, and where the transitions in thinking have occurred.
  8. As outlined in previous slides, the HR function provides many opportunities for the CEO/senior executive team to enhance business performance. Most organisations will not, however, take advantage of these opportunities until they have recognised the relationship between business performance and the workforce. Key issues confronting most organisations competing in the global marketplace are outlined in this slide. If the workforce can contribute to resolving some, or even all, of these problems, why doesn’t the CEO/senior executive team take more interest in, and demand more from, the HR team?
  9. Following the same ‘theme’, the intention of this slide is to focus on the critical success factors that inherently underpin an organisation’s success and sustainability. This will help determine whether there is an opportunity to enhance performance by recognising the causal link with the organisation’s workforce. (i.e. Can the workforce contribute to enhancing performance in these critical areas? And if the answer is yes, why don’t we take more interest in and demand more from the HR team?)
  10. In concluding this section of the presentation, we are endeavouring to draw all of the content together into one simple, clear outcome for the CEO/senior executive team: To recognise the potential of the workforce to contribute to the achievement of business strategies and objectives, and to capitalise on this opportunity by re-evaluating and better understanding the contribution the HR team can make.
  11. In this next section of the presentation, we turn our attention away from the opportunity available to the CEO/senior executive team and towards the role and contribution the HR team should make in this newly defined environment. As a critical starting point, we suggest that in order to capitalise on workforce potential, the HR team must recognise that its ultimate purpose is to optimise workforce performance, and that that central objective should dictate all future projects and initiatives.
  12. This slide is intended to reinforce the principle outlined in the previous slide: that HR needs to optimise workforce performance and contribute to business outcomes instead of searching for and introducing the latest ‘fad’, regardless of whether it has any identified/real benefit! (i.e. Throughout the last 50 years, there has been a search for the Holy Grail of management. Just consider some of the jargon and programs that we have initiated over the years! Is it really any wonder that when HR unveils its latest program the organisation meets it with skepticism at best and outright defiance at worst? The key understanding is to accept that there is no Holy Grail. The best thing HR professionals can do is to partner with their clients and respond to real business needs that clients struggle with day in and day out.)
  13. Continuing the same theme, this slide provides a humorous reflection of how line managers may see/value the HR department’s current offering.
  14. This slide broadens the theme expressed in previous slides (i.e. that the principal role of HR is to optimise workforce performance in order to achieve business strategies and objectives) and provides an alternative balanced scorecard highlighting key areas where HR can directly contribute to enhanced workforce performance: workforce productivity; workforce capability; workforce satisfaction; and workforce wellbeing. Key questions to be considered/asked are: What would happen if our workforce: was as productive as it could be? was as capable as it could be? was as satisfied as it could be? had the highest level of wellbeing possible? Would this lead to: optimum workforce performance? a real contribution to business strategies and objectives? a point of potential differentiation in the marketplace? the potential to be regarded as an employer of choice? Should we (the CEO/senior executive team) all understand/recognise/support HR initiatives/programs into the future that will enhance workforce performance in at least one of the four areas?
  15. This slide provides more detail about specific programs and services that HR can/does provide in relation to each of the areas that contributes to optimising workforce performance.
  16. This slide provides more detail about specific programs and services that HR can/does provide in relation to each of the areas that contributes to optimising workforce performance.
  17. This slide provides more detail about specific programs and services that HR can/does provide in relation to each of the areas that contributes to optimising workforce performance.
  18. This slide provides more detail about specific programs and services that HR can/does provide in relation to each of the areas that contributes to optimising workforce performance.
  19. Having now clearly identified the HR opportunity available to the CEO/senior executive team, the last key issue to address is clarifying where accountability for workforce performance rests. Unfortunately, all too often the CEO/senior executive team assigns accountability to the HR department.
  20. Against this background of assigning accountability to the HR function, we note that in most organisations: employees are assigned to senior executives’ budget centres and organisation charts senior executives ultimately decide who will be hired and fired senior executives ultimately decide who will be promoted or receive a pay increase. The obvious conclusion therefore is that with such clear senior executive team responsibilities, it is not logical or practical to hold HR solely accountable for workforce performance.
  21. This slide suggests that accountability for workforce performance rests principally with the senior executive team, fully supported by the HR department. The implication is that in introducing integrated HR business reporting, the results achieved and the decisions made are the joint responsibility of the CEO/senior executive team and the HR manager.
  22. This slide shows the principal purpose and objectives of introducing HR key performance indicators.
  23. This slide identifies the key factors that must be taken into account in order to effectively implement and sustain HR key performance indicators.
  24. This slide identifies the key factors that must be taken into account in order to effectively implement and sustain HR key performance indicators.
  25. This slide provides an overview of the HR key performance indicators that may be suitable for/introduced into your organisation.
  26. This slide provides an overview of the HR key performance indicators that may be suitable for/introduced into your organisation.
  27. This slide provides an overview of the HR key performance indicators that may be suitable for/introduced into your organisation.
  28. This slide provides an overview of the HR key performance indicators that may be suitable for/introduced into your organisation.
  29. This slide provides an example of a specific HR measurement tool that may support your key performance indicator report and be suitable for application within your organisation.
  30. This slide provides an example of a specific HR measurement tool that may support your key performance indicator report and be suitable for application within your organisation.
  31. This slide provides an example of a specific HR measurement tool that may support your key performance indicator report and be suitable for application within your organisation.
  32. This slide provides an example of a specific HR measurement tool that may support your key performance indicator report and be suitable for application within your organisation.