Benchmarking HR Metrics and Setting Goals to Build a Compelling ROI Case
•
1 like•650 views

Building the business case ROI for SaaS HR

Recommended
Recommended
More Related Content
What's hot
What's hot (19)
Viewers also liked
Viewers also liked (18)
Similar to Benchmarking HR Metrics and Setting Goals to Build a Compelling ROI Case
Similar to Benchmarking HR Metrics and Setting Goals to Build a Compelling ROI Case (20)
More from Charles Bedard
More from Charles Bedard (20)
Recently uploaded
Recently uploaded (20)
Benchmarking HR Metrics and Setting Goals to Build a Compelling ROI Case
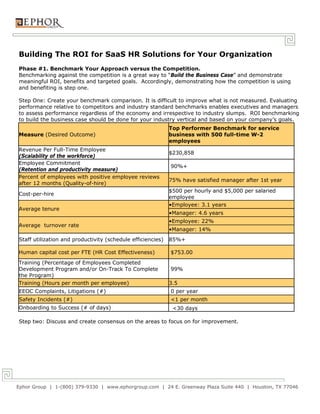
- 1. Building The ROI for SaaS HR Solutions for Your Organization Phase #1. Benchmark Your Approach versus the Competition. Benchmarking against the competition is a great way to “Build the Business Case” and demonstrate meaningful ROI, benefits and targeted goals. Accordingly, demonstrating how the competition is using and benefiting is step one. Step One: Create your benchmark comparison. It is difficult to improve what is not measured. Evaluating performance relative to competitors and industry standard benchmarks enables executives and managers to assess performance regardless of the economy and irrespective to industry slumps. ROI benchmarking to build the business case should be done for your industry vertical and based on your company’s goals. Top Performer Benchmark for service Measure (Desired Outcome) business with 500 full-time W-2 employees Revenue Per Full-Time Employee $230,858 (Scalability of the workforce) Employee Commitment 90%+ (Retention and productivity measure) Percent of employees with positive employee reviews 75% have satisfied manager after 1st year after 12 months (Quality-of-hire) $500 per hourly and $5,000 per salaried Cost-per-hire employee •Employee: 3.1 years Average tenure •Manager: 4.6 years •Employee: 22% Average turnover rate •Manager: 14% Staff utilization and productivity (schedule efficiencies) 85%+ Human capital cost per FTE (HR Cost Effectiveness) $753.00 Training (Percentage of Employees Completed Development Program and/or On-Track To Complete 99% the Program) Training (Hours per month per employee) 3.5 EEOC Complaints, Litigations (#) 0 per year Safety Incidents (#) <1 per month Onboarding to Success (# of days) <30 days Step two: Discuss and create consensus on the areas to focus on for improvement. Ephor Group | 1-(800) 379-9330 | www.ephorgroup.com | 24 E. Greenway Plaza Suite 440 | Houston, TX 77046
- 2. Building The ROI for SaaS HR Solutions for Your Organization Phase #2. Create an Assumption-Driven ROI Model Based on Targeted Improvements. Most important when creating an ROI analysis is demonstrating how the solution will impact and align with the overall business strategy. The key is to create consensus on how HR fits with the business. While each company’s specific goals will differ, evidence abounds that demonstrates that what gets measured gets improved. Step one: Set goals for each HR process and size the P&L impact. Workforce Consequences of Poor or Inadequate Workforce Effectiveness Cost-Benefit Analysis Effectiveness Category Misaligned Compensation and Benefit against the Compensation not aligned with the market causes market results in hiring slugs instead of stars turnover Demotivated workforce manifests morale On average turnover cost is $10k per hourly and Compensation and problem which causes inefficiency, cultural $50 per salaried professional! SHRM Benefits issues, and worsens productivity Benefits are a key differentiator for many worker The right benefits package targeted to the right segments segment can lower total compensation costs i.e. reduce the fully loaded labor cost per employee Fines, litigations, EEOC complaints, and safety Improved staff utilization , resource efficiency, and incidents legal costs. Loss of control EEOC leads employee productivity; a 5% employee to have to hire and pay differently over hiring and productivity gain does not increase costs and goes pay straight to EBITDA When trust issues are present it becomes Average compliance cost is $5,411 per employee Employee management versus the workforce (20-499 employees US NDL) Relations Reactive management leads to adult day-care Business owners spend up to 40 percent of their causes low employee commitment time consumed by employer-related paperwork. SBA A bad reputation as a firm reduces attractiveness Employee Incidents Resolved Satisfactorily % as a place to work, performance of current Improvement (Average settlement is $273k (US employees, and is viewed poorly by the public NDL) Reduced employee satisfaction Revenue-Per-FTE , Profits-Per-FTE and Gross Profit benchmarked against industry averages improves results Gaps in skill sets and organizational capabilities HR Administrative Costs are on average $1,253 for the average organization vs. <$500 per employee for firms with strategic HR Without training and career development Onboarding success rates (80% versus 50% for Organizational productivity does not improve and leaders and many positions) Development managers are not developed No internal career development opportunities 20% reduction in insurance rates increases turnover Inability to react to environment. The average U.S. employer spends more than 32 hours and $900 per employee on employee training. ASTD Inability to meet marketplace demands Improve employee to manager ratio (varies by industry) One-third of all bad hiring decisions are a direct result of pressure to fill a position, with hiring Hire more ‘A Players’ , less turnover managers often relying on gut decisions when Workforce they are in a hurry. Planning Costs and opportunities not aligned: The war for Reduce overtime costs ‘A Player’ talent Customer satisfaction declines Decrease key hiring metrics: Time-to-Fill and Skill trade acts as a determinant to growth Cost-Per-Hire, Number of Positions Open Ephor Group | 1-(800) 379-9330 | www.ephorgroup.com | 24 E. Greenway Plaza Suite 440 | Houston, TX 77046
- 3. SaaS HR Buyer’s Guide Historically, the cost to implement, manage, and utilize a Criteria Feature/Fact HR system based on a licensed software model has 1. Vendor Credibility inhibited the routine use of these systems. These # of Customers Added Per Year with SaaS licensed software rollouts (non-SaaS systems) have Notable Clients additionally required mass customization and coding to fit Notable Partners workflow processes and end-user adoption has been Financial Stability limited due to expense. Today, there are a significant 2. Client Fit number of organizations that, due to performance Verticals mandates and/or regulations, are now required to automate, standardize, document, and streamline Local Offices processes and add support functions. 3. Technology Solution Fit SaaS multitenant scalable platform with Workflow, Real-time Reporting, CRM. To date, the technology capabilities of these products Configurability have outpaced the adoption and use. In fact, the majority Scalability of implementations deployed have failed to fully utilize Ease of Interoperability (Integration) the entire suite of possibilities due to the complexity of What vendors are integrated? both deployment and ongoing, routine use of these Performance Management (see PM Feature Comparison) systems. Business Management Reporting Global Capabilities Today’s SaaS market leaders are known for: “The Best Talent Management ERP (Enterprise Resource Planning) Deployment and Service”, adoption by employees and 4. Sizzle Features - What are the sizzle features? Compensation Planning, Baseball Card constituents versus top-down roll-out; i.e. the need for a WOW Sizzle Feature #1 solution that works on-demand, and provides a series of add-on products and services to meet organizational workforce needs. WOW Sizzle Feature #2 5. Cost and Implementation Time/Resource Estimates - What is the ROI? What are the Contact a professional to put together a specific ROI Pricing Model Results? How many projects do they start but not complete? Do they publish assessment for your organization. S (S )? Methodology - What is the philosophy of the company? Does the process align ? Analytics and Reporting - What daily, weekly and monthly reports and metrics ? Cost-Benefit Analysis C ? Setup Time Implementation Time to Implement Core Training Time and Costs Monthly Average Cost Total Cost Average Per Client for 3 Years ROI Expectations SaaS Performance Management Provider A Provider B Provider C Application Providers HR Consulting Services Y - Enteprise Y - E & SMB Nothing beyond implementation support. Performance Management Y - Enteprise Y - E & SMB Y - Enteprise Goals Management Y - Enteprise Y - E & SMB Y - Enteprise Collaboration Y - Enteprise Y - E & SMB Y - Enteprise Automated Workflow Y - Enteprise Y - E & SMB Y - Enteprise Employee Self Service Y - Enteprise Y - E & SMB Y - Enteprise Manager Self Service Y - Enteprise Y - E & SMB Y - Enteprise Best Practices Templates, Competencies Y - Enteprise Y - E & SMB N Templates for Metrics/Dashboard Y - Enteprise Y - E & SMB Y - Enteprise Y - Via Partners Y - E & SMB Y - Enteprise Learning Management System Y - Via Partners Y - E & SMB N Training Content Y - Enteprise Y - E & SMB Y - Enteprise Succession Y - Enteprise Add-On Y - E & SMB Y - Enteprise Surveys Y - Enteprise Y - E & SMB Y - Enteprise Communications Y - Enteprise Y - E & SMB Y - Enteprise Org. Chart Career Management N Y - E & SMB Y - Enteprise Talent Management Y - Enteprise N Y - Enteprise Ephor Group | 1-(800) 379-9330 | www.ephorgroup.com | 24 E. Greenway Plaza Suite 440 | Houston, TX 77046