Downloaded 11 times


![The midpoint formula is preferable when calculating the
price elasticity of demand because it gives the same answer
regardless of the direction of the change.
)/2]P)/[(PP(P
)/2]Q)/[(QQ(Q
=DemandofElasticityPrice
1212
1212
+−
+−](https://image.slidesharecdn.com/elasticityforecasting-160312180803/75/Elasticity-amp-forecasting-23-2048.jpg)
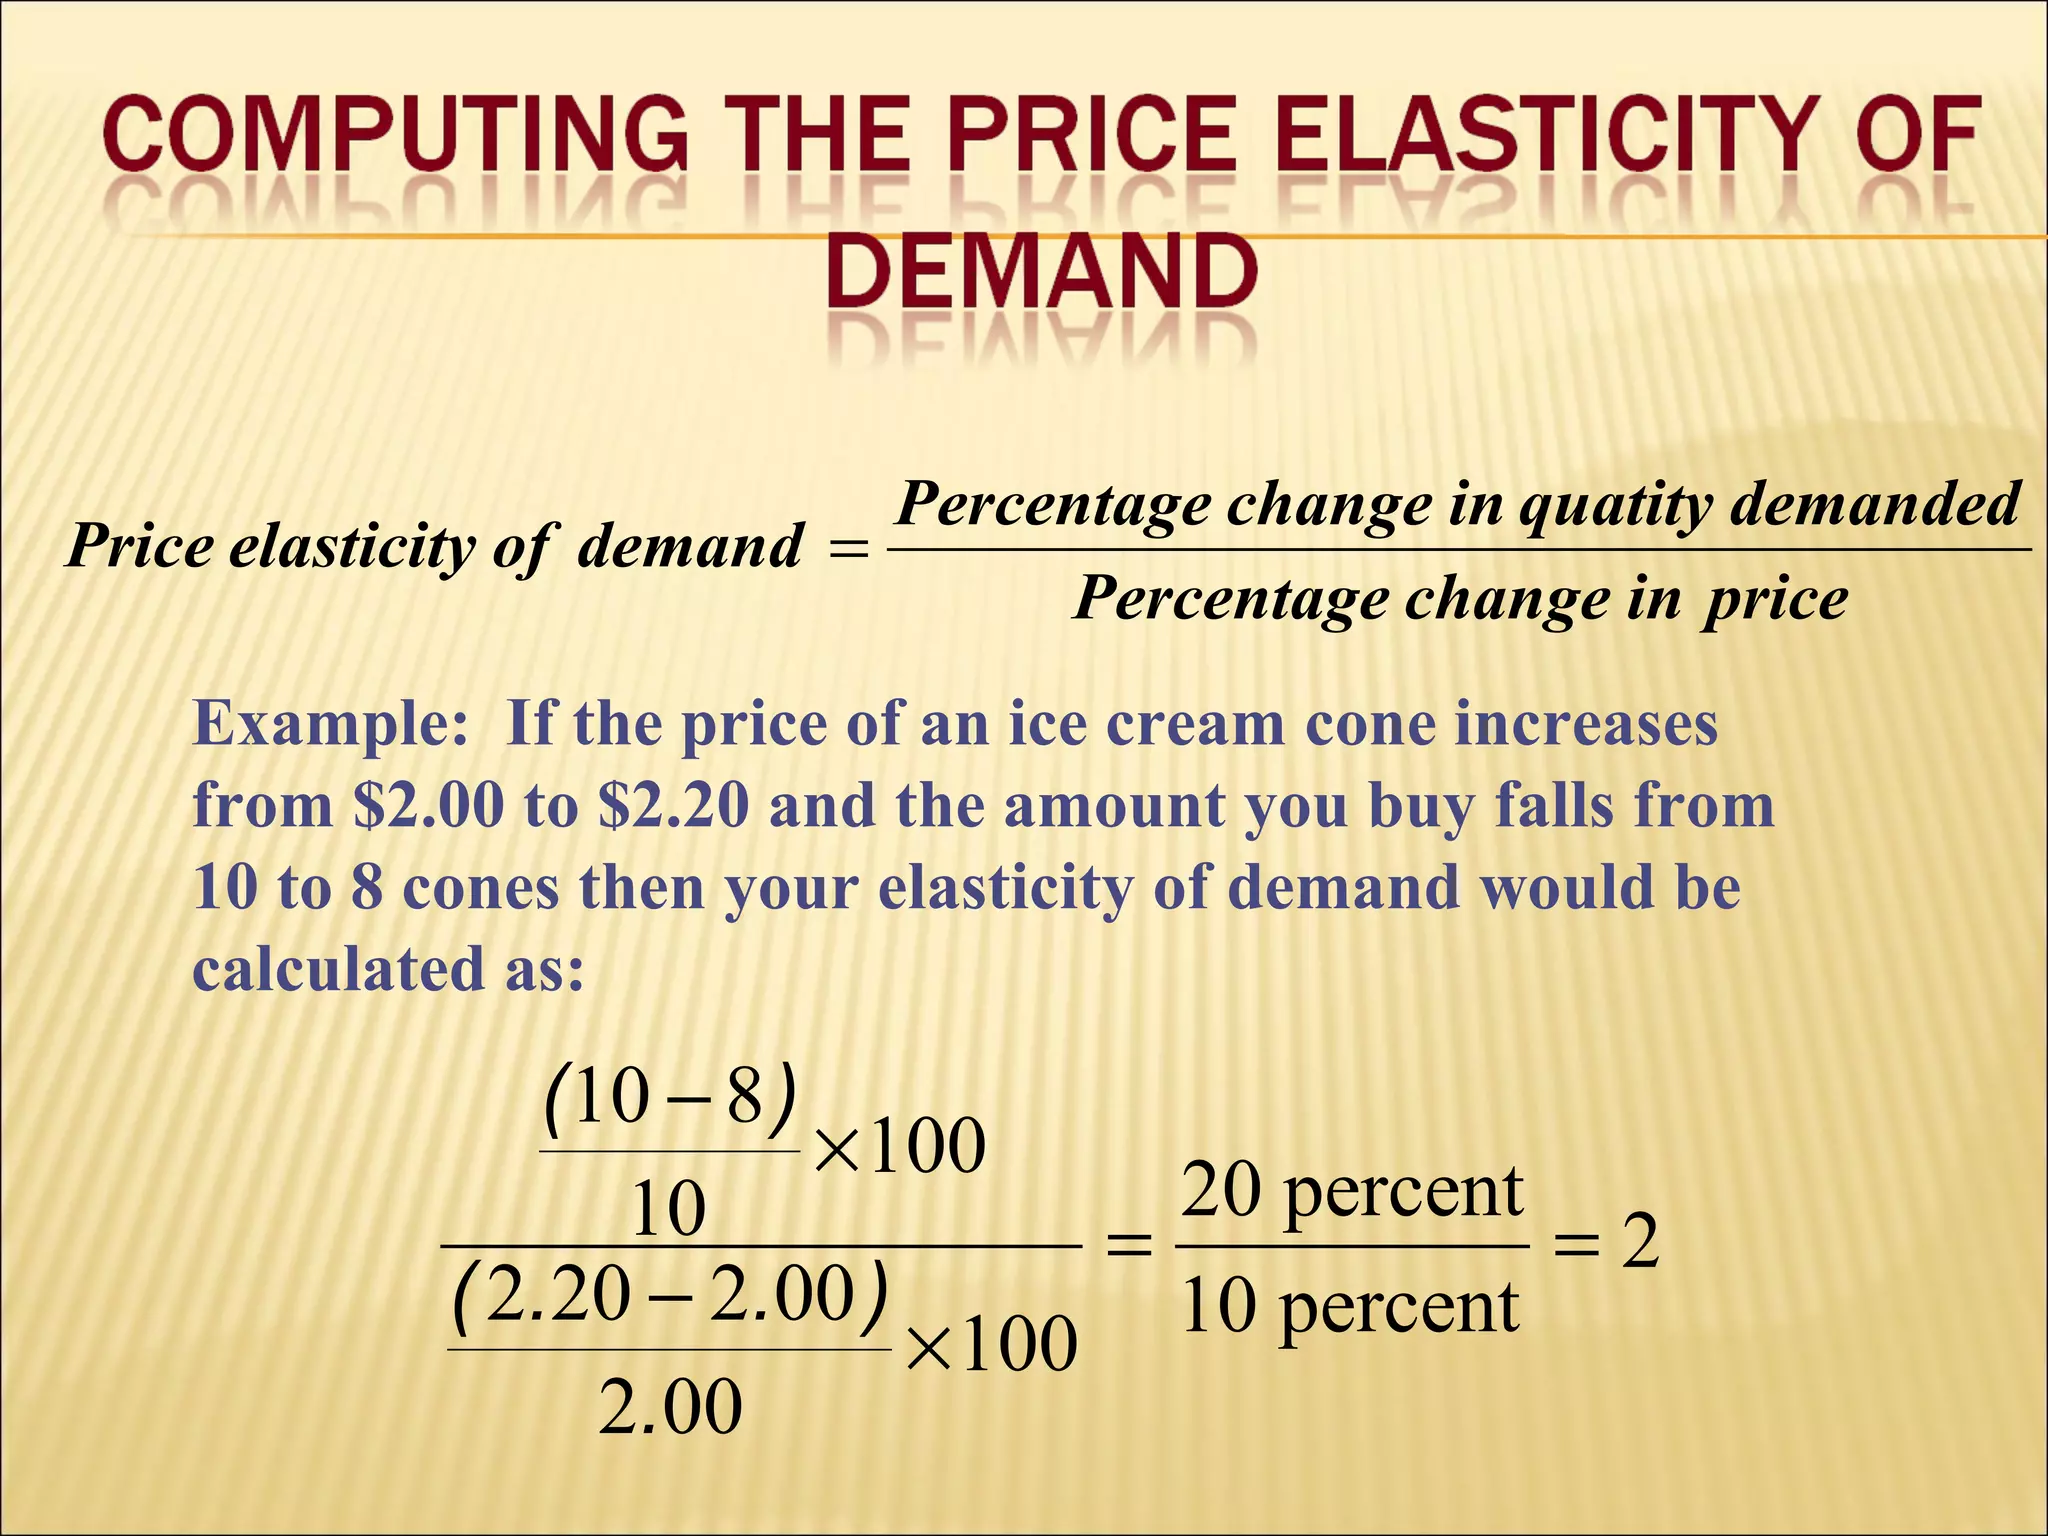
![Example: If the price of an ice cream cone increases
from 2.00 to 2.20 and the amount you buy falls from 10
to 8 cones the your elasticity of demand, using the
midpoint formula, would be calculated as:
32.2
5.9
22
2/)00.220.2(
)00.220.2(
2/)810(
)810(
==
+
−
+
−
percent
percent
)/2]P)/[(PP(P
)/2]Q)/[(QQ(Q
=DemandofElasticityPrice
1212
1212
+−
+−](https://image.slidesharecdn.com/elasticityforecasting-160312180803/75/Elasticity-amp-forecasting-24-2048.jpg)


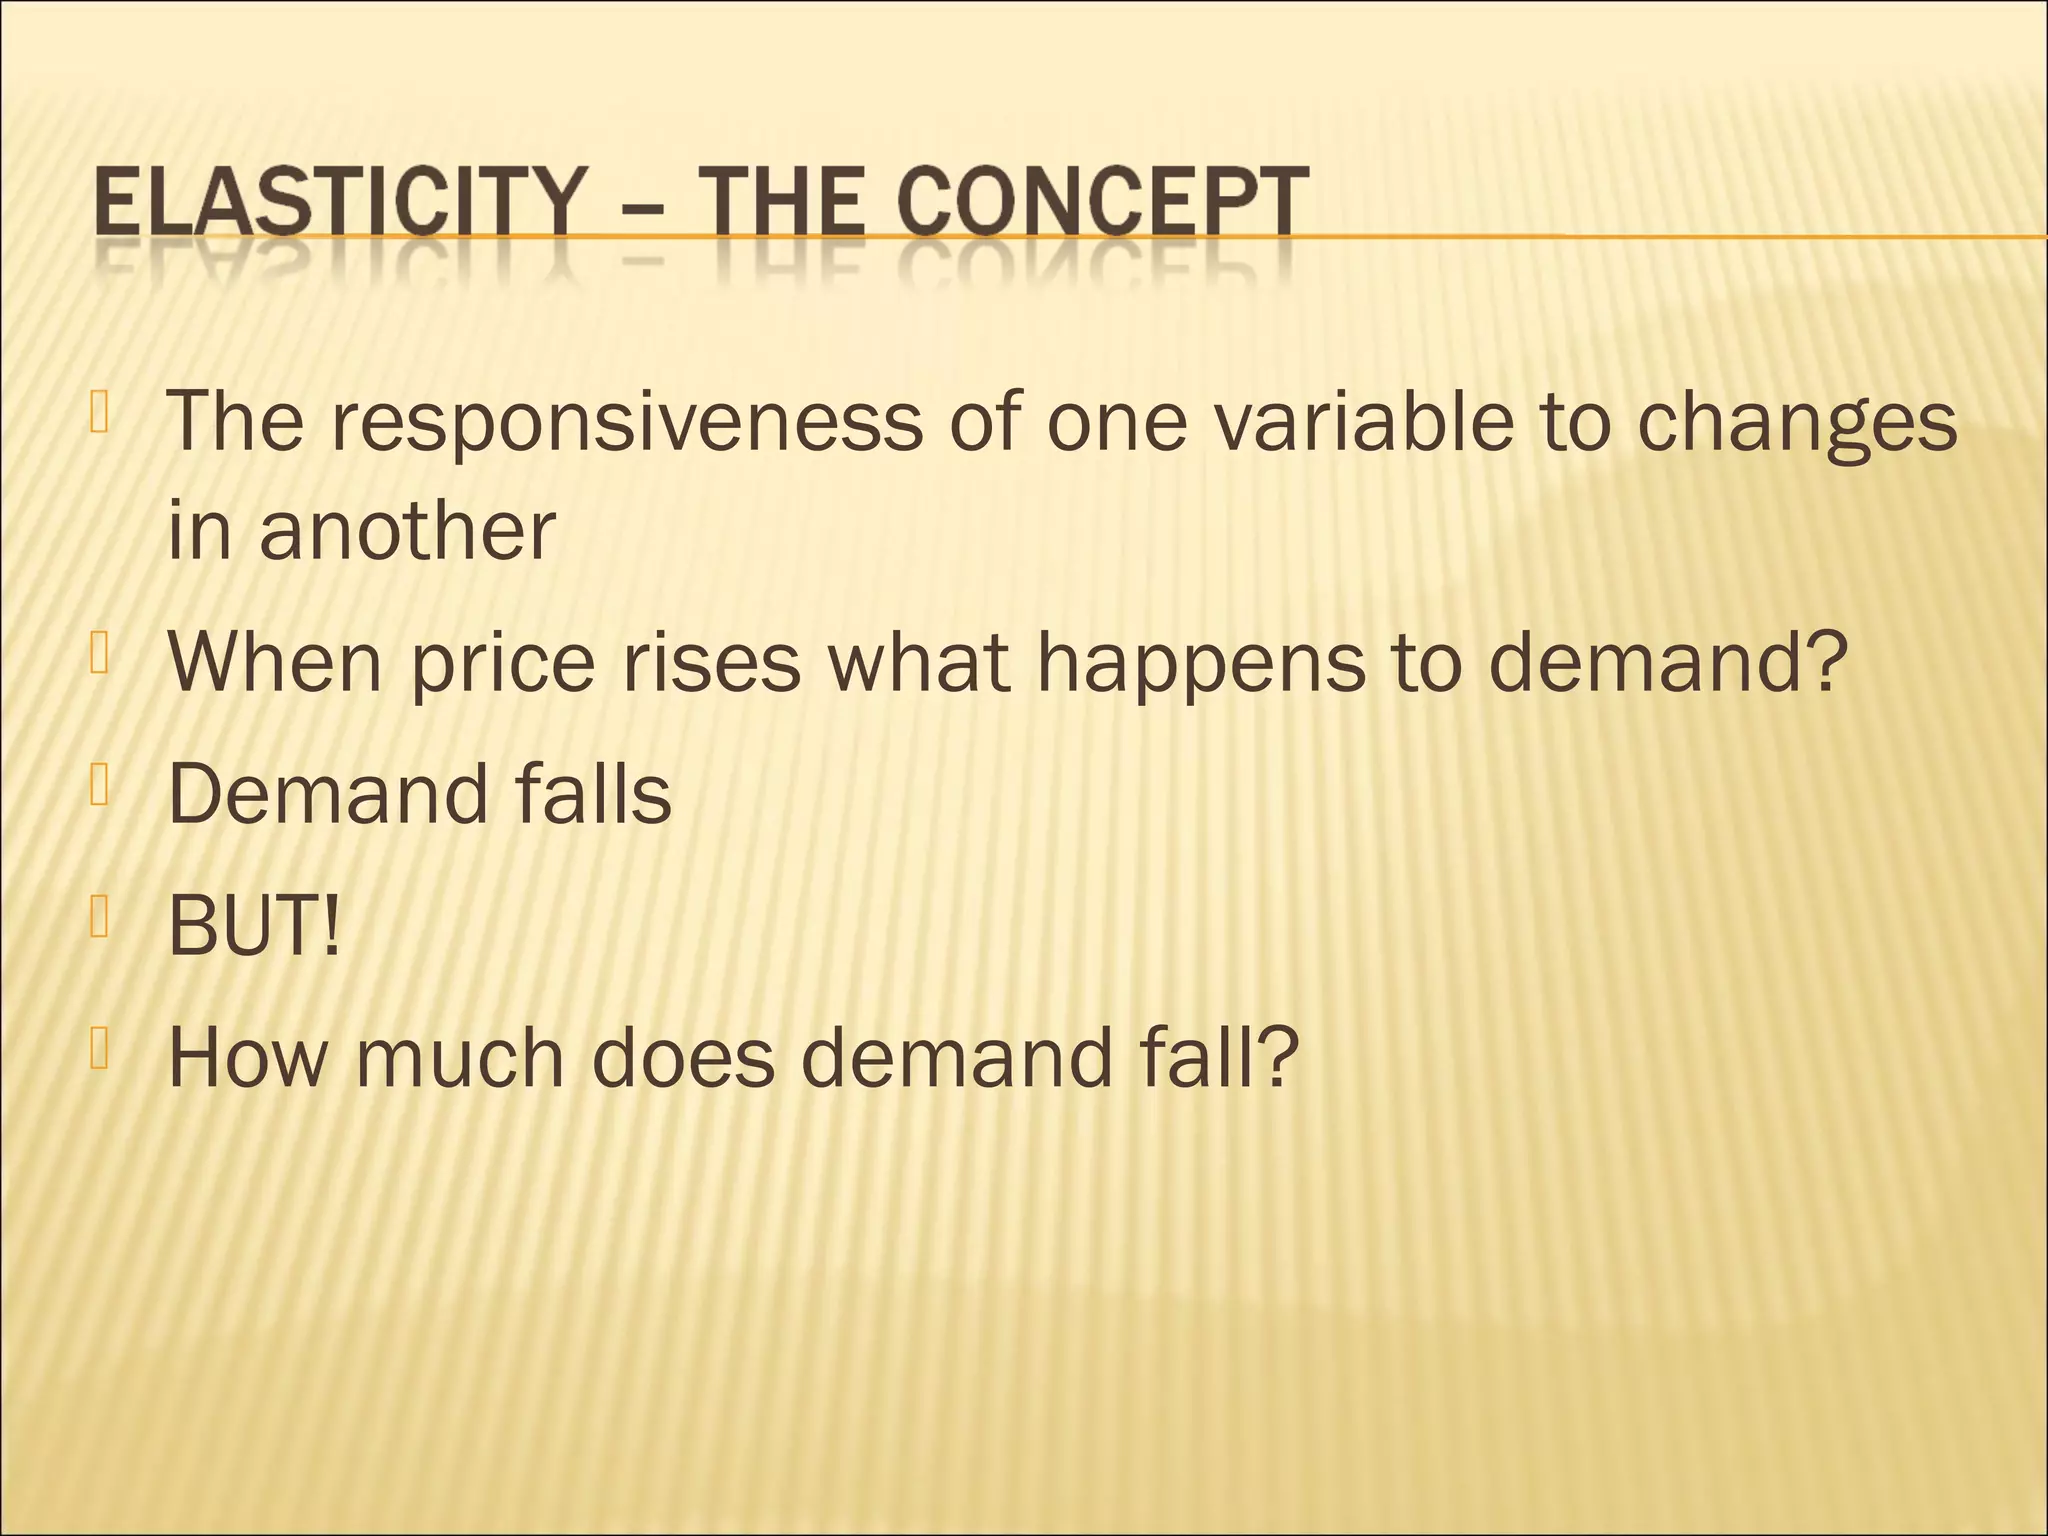
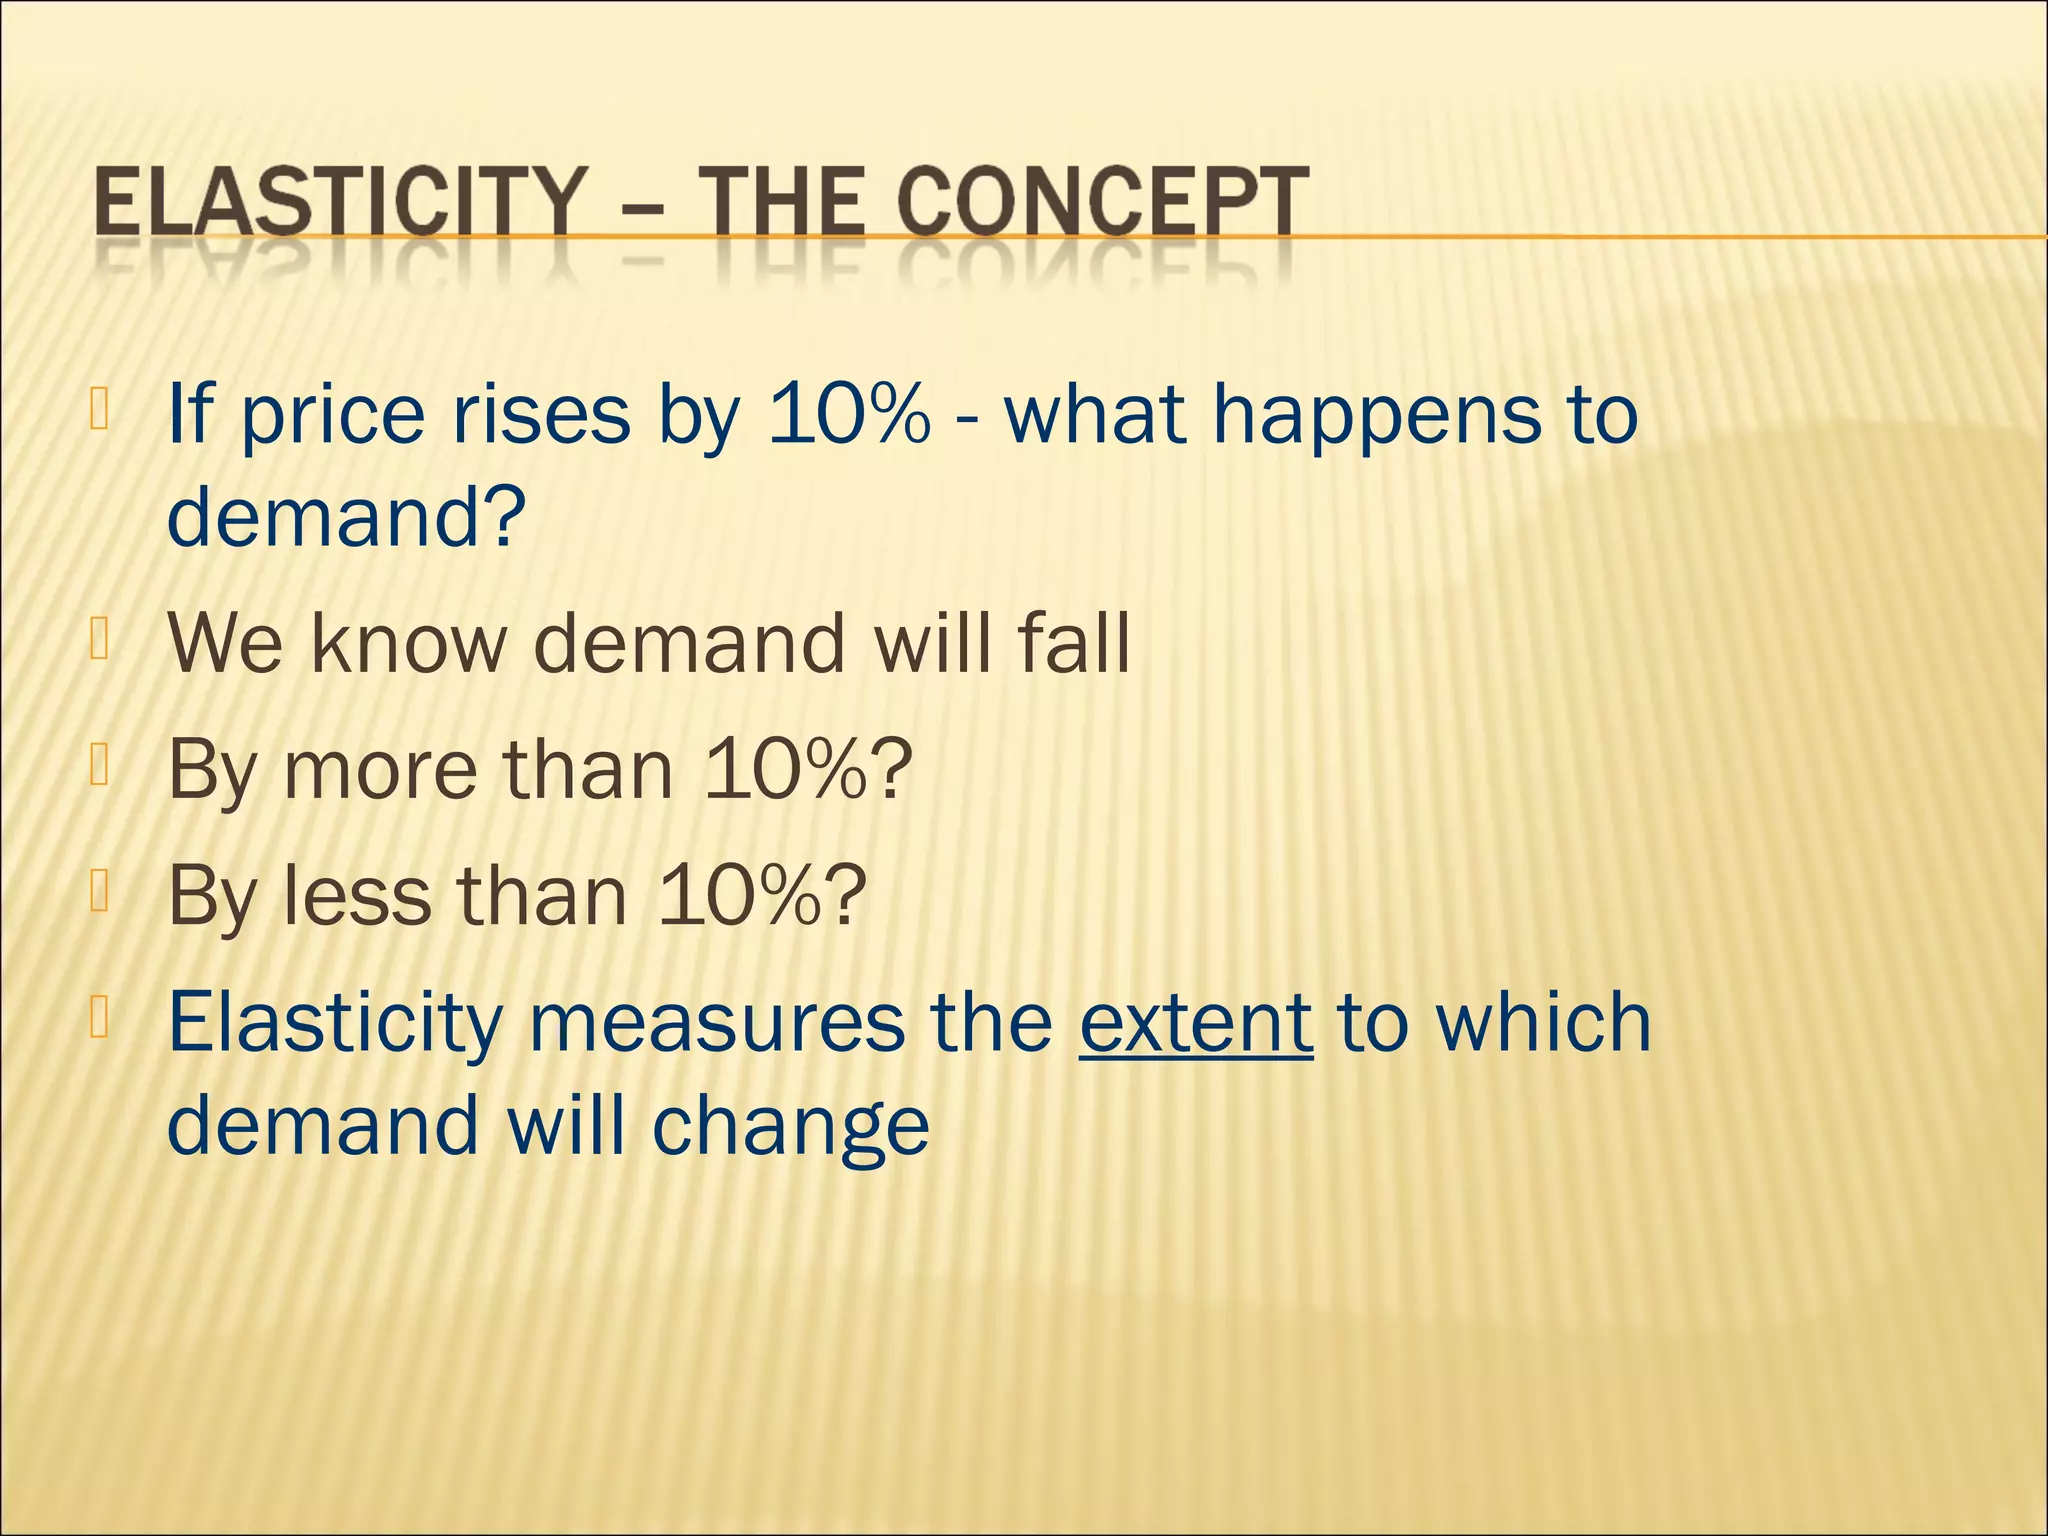
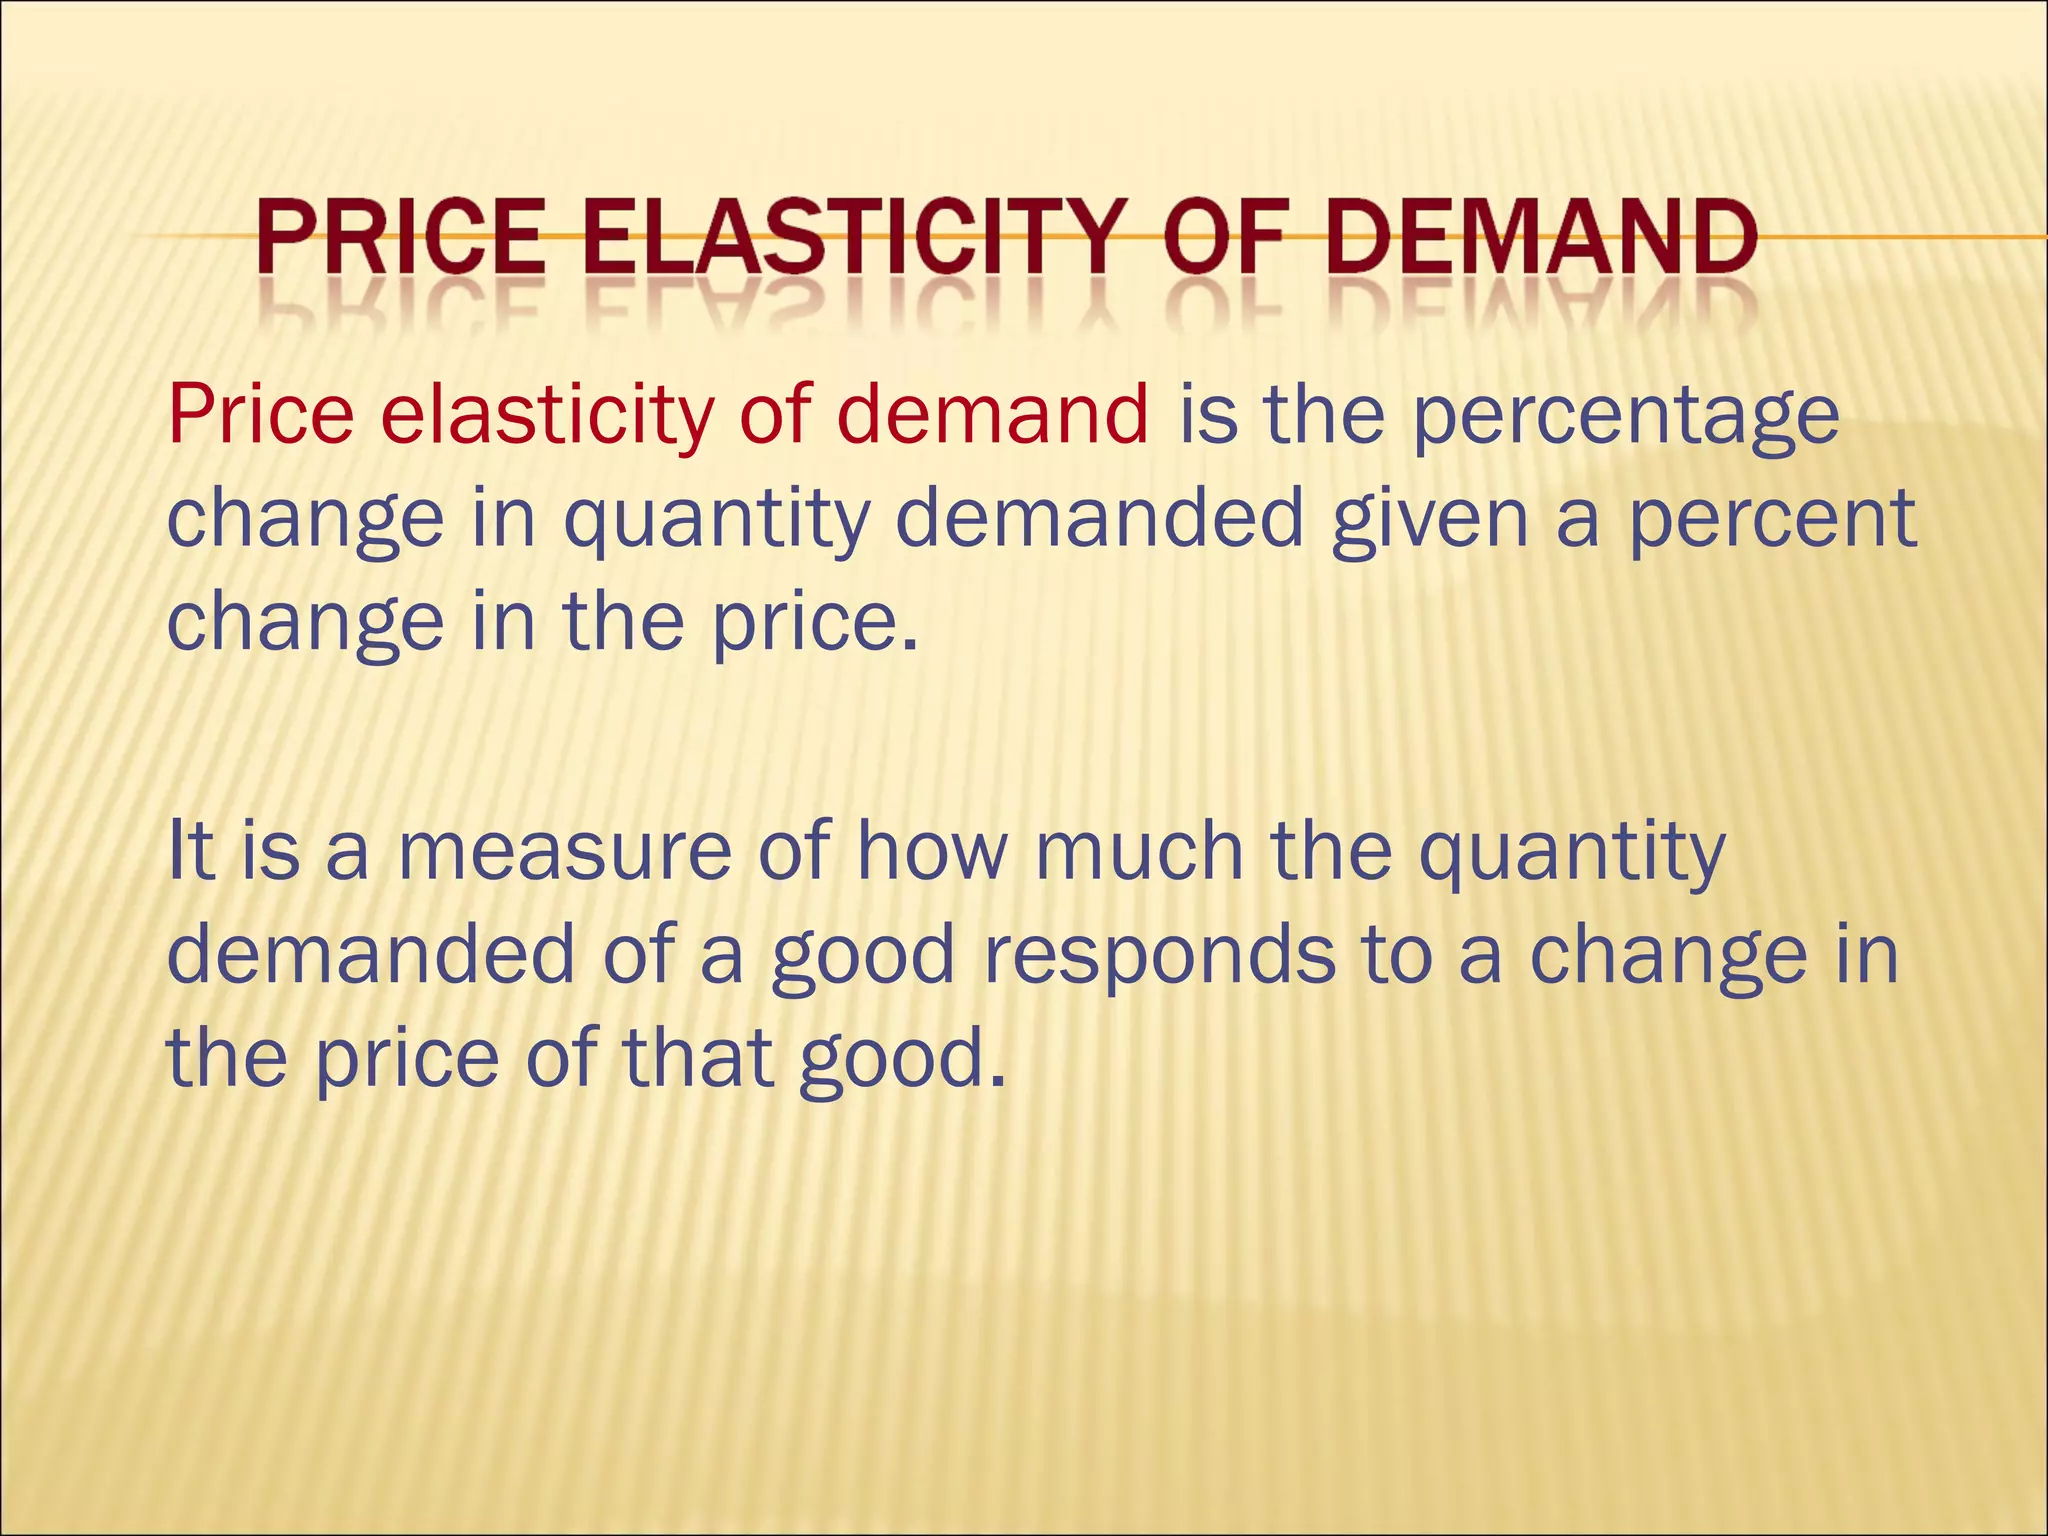
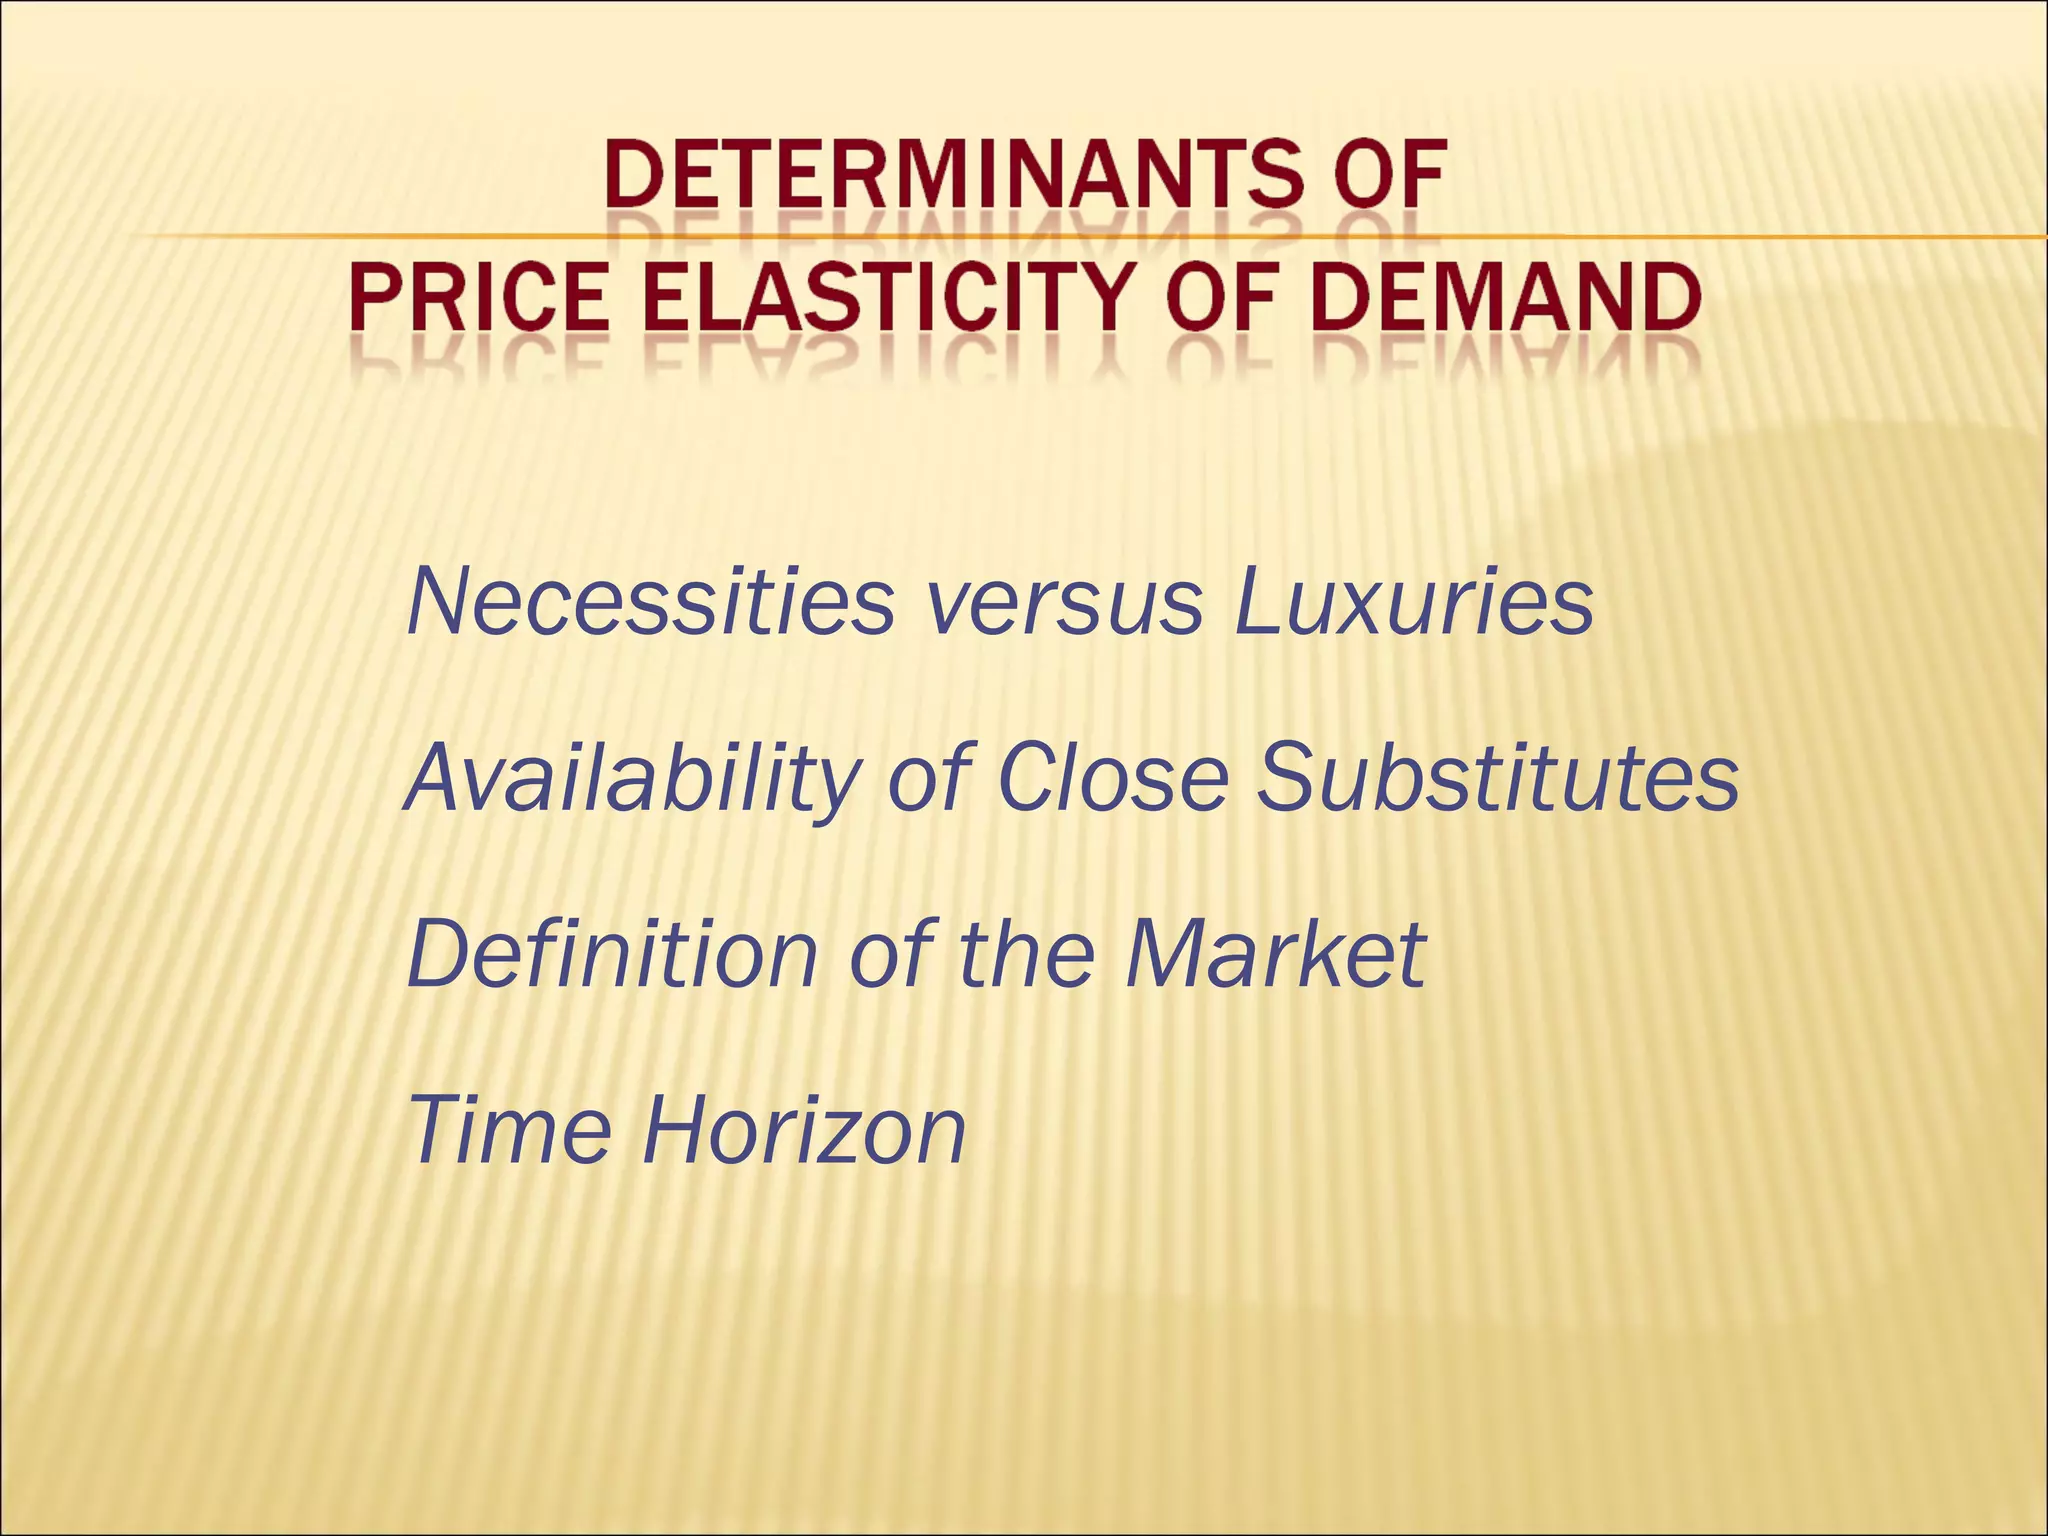
This document discusses the concept of elasticity in economics, focusing on price elasticity of demand, which measures how quantity demanded responds to price changes. It explains various factors affecting elasticity, methods for calculating it, and its implications for businesses in terms of pricing strategies and demand forecasting. Additionally, it outlines demand forecasting methods, including survey techniques and statistical analysis, emphasizing their importance for effective business planning.