SlideShare a Scribd company logo
1 of 28
ne what is:
meter
mate
rentiate
nt estimate
erval
e
ective
:
- a numerica
characteristic
population, a
from a statisti
sample.
Parameter
Ex.
1. A number of students in CKC
2. A number of population in Brgy.
Matobato
Parameter
ue, or range
alues, that
roximates
population
Estimate
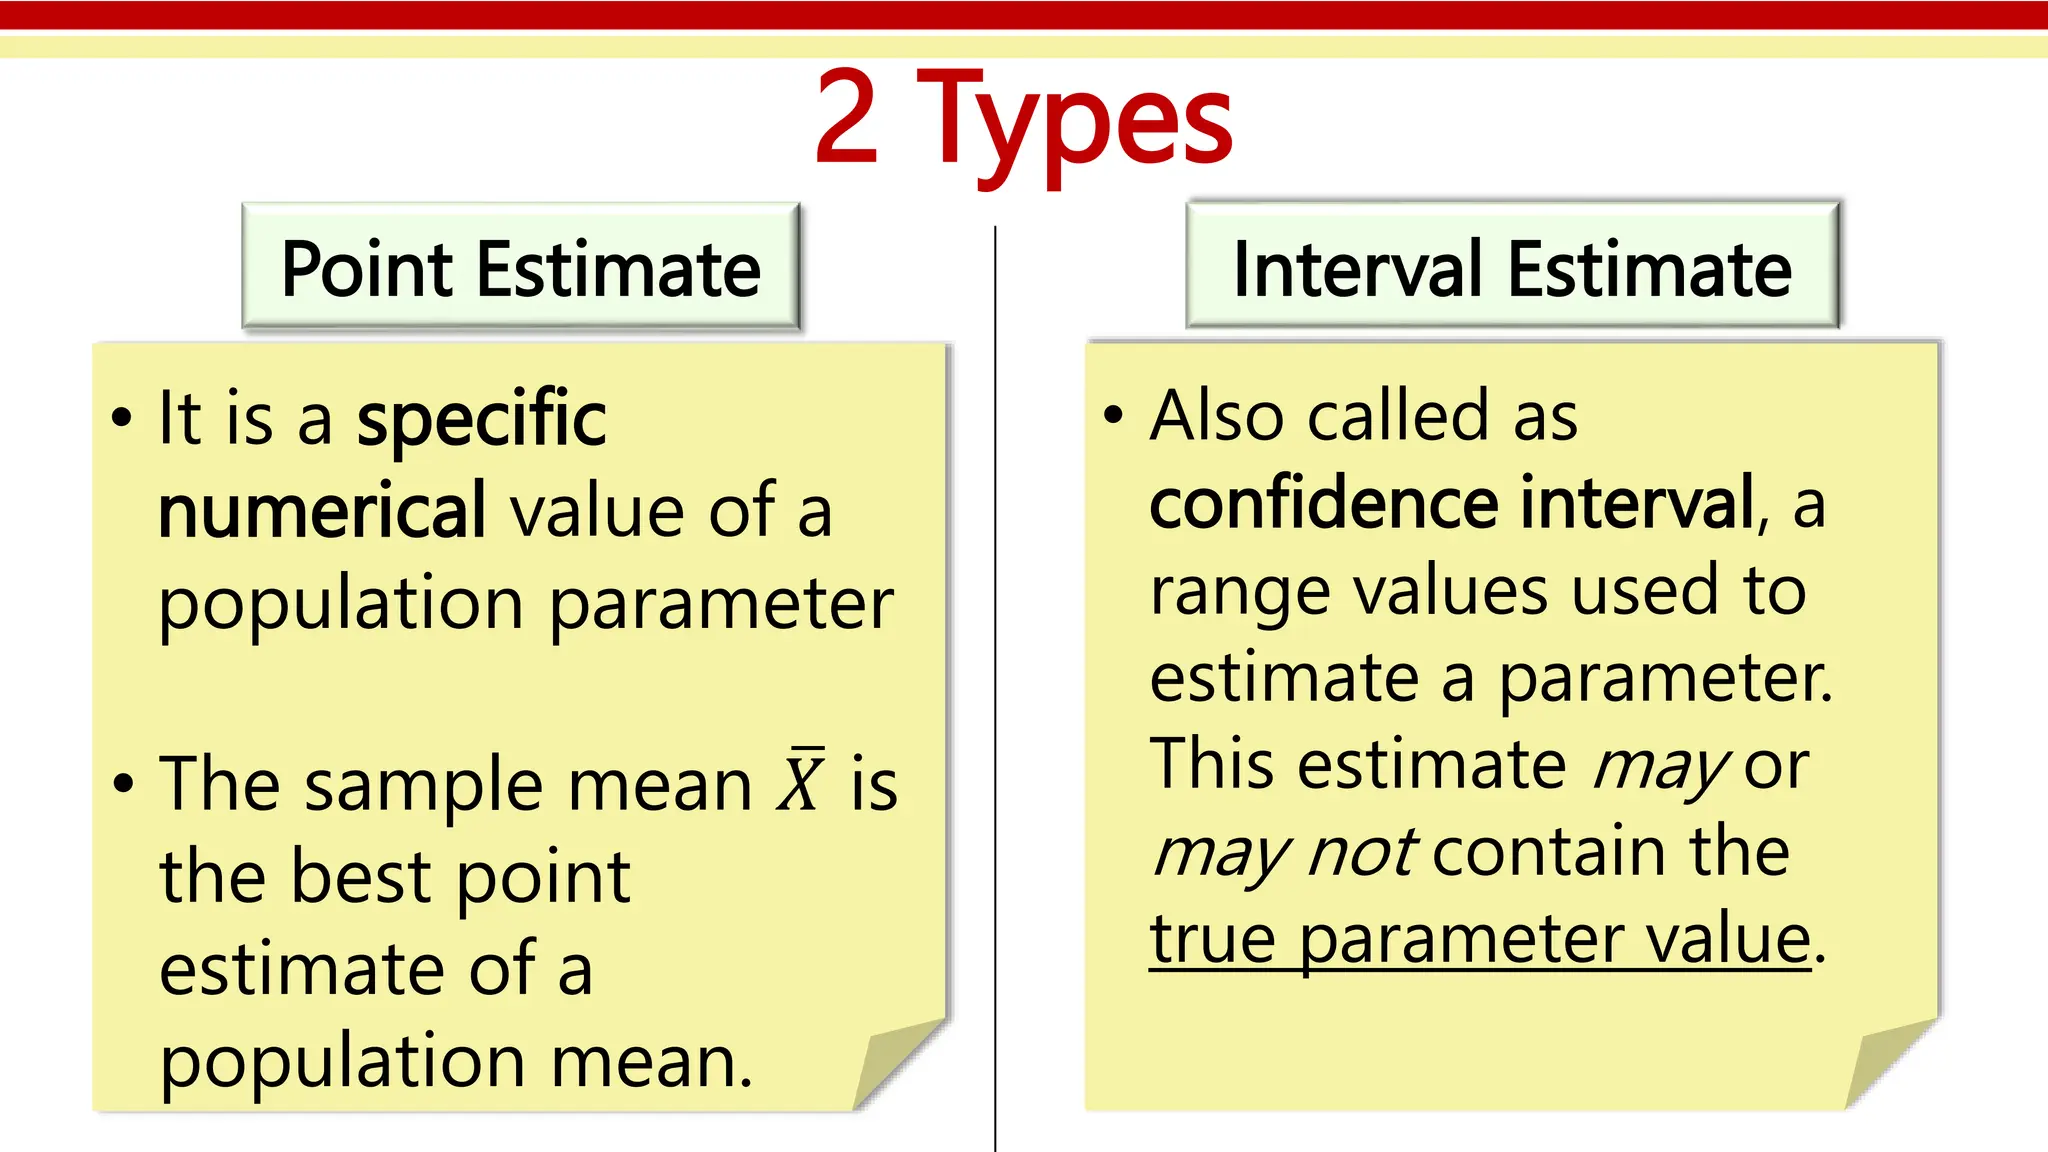
2 Types
Point Estimate
• It is a specific
numerical value of a
population parameter
• The sample mean 𝑋 is
the best point
estimate of a
population mean.
Interval Estimate
• Also called as
confidence interval, a
range values used to
estimate a parameter.
This estimate may or
may not contain the
true parameter value.
Point Estimate
Ex.
Jacky wanted to know
the average students
in statistics. She
interviewed 40
students and the
results are shown on
the right.
Interval Estimate
• When σ is known
The confidence level of an interval estimate is the
probability that the interval estimate will contain
the true population parameter.
- How sure are we that the population
parameter is really within that we came up with.
Interval Estimate – 2 ways
1.) When σ is known
The confidence level of an interval estimate is the
probability that the interval estimate will contain
the true population parameter.
- How sure are we that the population
parameter is really within that we came up with.
Interval Estimate – 2 ways
2.) When σ is unknown
When σ is unknown, the interval estimate can be
determined using the student’s t-distribution.
Interval Estimate: σ is known
Interval Estimate
E – Margin of Error
Z - critical value/z- value
σ – population standard deviation or sigma
N – sample size
Interval Estimate
Lower limit
Upper Limit
Solve for Interval Estimate
Example:
Step 1: Determine the given values
Step 2: Determine the critical value
Step 3: Solve for the margin of error using the formula
Step 4: Solve for the Interval estimate
Procedure:
Solve for Interval Estimate
Example:
Given:
Sample size (n) = 100
Sample mean 𝑿 = 150
Population SD σ = 40
Confidence level = 95% = critical value: Z =1.96
Solve for Interval Estimate
Example:
Given:
Sample size (n) = 50
Sample mean 𝑿 = 20.5
Population SD σ = 3.7
Confidence level = 99% = critical value: Z = 2.58
Interval Estimate – #2 way/ method
2.) When σ is unknown
When σ is unknown, the interval estimate can be
determined using the
student’s t-distribution.
Interval Estimate – σ is unknown
Where; n – is the sample size
Interval Estimate – σ is unknown
Interval Estimate – σ is unknown (Example)
Step 1: Determine the given values
Step 2: Determine the degrees of freedom using the formula
and the t (using the table)
Step 3: Solve for the margin of error using the formula
Step 4: Solve for the Interval estimate
Procedure:
Interval Estimate – σ is unknown (Example)
Given:
Sample size (n) = 30
Sample mean 𝑿 = 5.3
Sample S = 1.1
Confidence level = 95%
Degrees of freedom = n – 1 = 30 – 1 = 29
Interval Estimate – σ is unknown (Example)
ESTIMATING SAMPLE SIZE
In order to determine the sample size we follow
the formula:
n = [
𝑍𝑎
2
σ
𝐸
]2
Where;
n = sample size
𝒁𝒂
𝟐
= Z values
E = margin error
ESTIMATING SAMPLE SIZE
In order to determine the sample size we follow
the formula:
n = [
𝑍𝑎
2
σ
𝐸
]2
Where;
n = sample size
𝒁𝒂
𝟐
= Z values
E = margin error
QUIZ !!!
1 whole sheet of paper
-YES, 1 whole
Direction: Solve for the Point Estimate
95 85 85 90 88 80
88 87 82 92 90 91
88 94 90 92 89 90
96 89 84 90 85 87
95 96 94 93 94 90
89 88 89 85 86 92
Mr. Gonzales wanted to know the average students in
statistics. He interviewed 36 students and the results
are shown below.
Direction: Solve for the Interval Estimate.
In a study of 80 junior high school students, the mean number
of hours per week that they used internet was 40 hours. It was
estimated that the population standard deviation was 2.5. What
is the 95% confidence interval for the mean time for using
internet?
THANK YOU !!!

More Related Content

Similar to Point and Interval Estimate by regi.pptx

Probability Distributions
Probability DistributionsProbability Distributions
Probability Distributions
Harish Lunani
 
jhghgjhgjhgjhfhcgjfjhvjhjgjkggjhgjhgjhfjgjgfgfhgfhg
jhghgjhgjhgjhfhcgjfjhvjhjgjkggjhgjhgjhfjgjgfgfhgfhgjhghgjhgjhgjhfhcgjfjhvjhjgjkggjhgjhgjhfjgjgfgfhgfhg
jhghgjhgjhgjhfhcgjfjhvjhjgjkggjhgjhgjhfjgjgfgfhgfhg
UMAIRASHFAQ20
 

Similar to Point and Interval Estimate by regi.pptx (20)

Business statistic ii
Business statistic iiBusiness statistic ii
Business statistic ii
 
Inferential Statistics.pptx
Inferential Statistics.pptxInferential Statistics.pptx
Inferential Statistics.pptx
 
Estimating population mean
Estimating population meanEstimating population mean
Estimating population mean
 
Lec 5 statistical intervals
Lec 5 statistical intervalsLec 5 statistical intervals
Lec 5 statistical intervals
 
Introduction to the t Statistic
Introduction to the t StatisticIntroduction to the t Statistic
Introduction to the t Statistic
 
Chapter 7 sampling distributions
Chapter 7 sampling distributionsChapter 7 sampling distributions
Chapter 7 sampling distributions
 
Semana8 muestreo
Semana8 muestreoSemana8 muestreo
Semana8 muestreo
 
Estimation in statistics
Estimation in statisticsEstimation in statistics
Estimation in statistics
 
6. point and interval estimation
6. point and interval estimation6. point and interval estimation
6. point and interval estimation
 
Estimation by c.i
Estimation by c.iEstimation by c.i
Estimation by c.i
 
L10 confidence intervals
L10 confidence intervalsL10 confidence intervals
L10 confidence intervals
 
inferencial statistics
inferencial statisticsinferencial statistics
inferencial statistics
 
Probability Distributions
Probability DistributionsProbability Distributions
Probability Distributions
 
jhghgjhgjhgjhfhcgjfjhvjhjgjkggjhgjhgjhfjgjgfgfhgfhg
jhghgjhgjhgjhfhcgjfjhvjhjgjkggjhgjhgjhfjgjgfgfhgfhgjhghgjhgjhgjhfhcgjfjhvjhjgjkggjhgjhgjhfjgjgfgfhgfhg
jhghgjhgjhgjhfhcgjfjhvjhjgjkggjhgjhgjhfjgjgfgfhgfhg
 
Inferential Statistics
Inferential StatisticsInferential Statistics
Inferential Statistics
 
Gravetter10e_PPT_Ch07_student.pptx
Gravetter10e_PPT_Ch07_student.pptxGravetter10e_PPT_Ch07_student.pptx
Gravetter10e_PPT_Ch07_student.pptx
 
Adv.-Statistics-2.pptx
Adv.-Statistics-2.pptxAdv.-Statistics-2.pptx
Adv.-Statistics-2.pptx
 
Review & Hypothesis Testing
Review & Hypothesis TestingReview & Hypothesis Testing
Review & Hypothesis Testing
 
Statistical Estimation
Statistical Estimation Statistical Estimation
Statistical Estimation
 
Estimating a Population Proportion
Estimating a Population Proportion  Estimating a Population Proportion
Estimating a Population Proportion
 

More from JordanHular1 (9)

MAINTENANCE TOOLS AND EQUIPMENT Q3.pptx
MAINTENANCE  TOOLS AND EQUIPMENT Q3.pptxMAINTENANCE  TOOLS AND EQUIPMENT Q3.pptx
MAINTENANCE TOOLS AND EQUIPMENT Q3.pptx
 
IBONGADARNAANGMAHIWAGANGKATOTOHANAN.pptx
IBONGADARNAANGMAHIWAGANGKATOTOHANAN.pptxIBONGADARNAANGMAHIWAGANGKATOTOHANAN.pptx
IBONGADARNAANGMAHIWAGANGKATOTOHANAN.pptx
 
A Digital Education of the new norm.pptx
A Digital Education of the new norm.pptxA Digital Education of the new norm.pptx
A Digital Education of the new norm.pptx
 
Homeroom-ParentTA-Meeting-2023-2024.pptx
Homeroom-ParentTA-Meeting-2023-2024.pptxHomeroom-ParentTA-Meeting-2023-2024.pptx
Homeroom-ParentTA-Meeting-2023-2024.pptx
 
ALTERNATING SERIES posted by jjjjjjj.pdf
ALTERNATING SERIES posted by jjjjjjj.pdfALTERNATING SERIES posted by jjjjjjj.pdf
ALTERNATING SERIES posted by jjjjjjj.pdf
 
RESEARCH LOCALE BY MAED MATHEMATICSSSSSS
RESEARCH LOCALE BY MAED MATHEMATICSSSSSSRESEARCH LOCALE BY MAED MATHEMATICSSSSSS
RESEARCH LOCALE BY MAED MATHEMATICSSSSSS
 
A LESSON PRESENTATION OF RESEARCH RESULT
A LESSON PRESENTATION OF RESEARCH RESULTA LESSON PRESENTATION OF RESEARCH RESULT
A LESSON PRESENTATION OF RESEARCH RESULT
 
COT 3 POWERPOINT PRESENTATION HAZARD AND RISK.pptx
COT 3 POWERPOINT PRESENTATION HAZARD AND RISK.pptxCOT 3 POWERPOINT PRESENTATION HAZARD AND RISK.pptx
COT 3 POWERPOINT PRESENTATION HAZARD AND RISK.pptx
 
Hamon sa Climate ChangeUnfinished.pptx
Hamon sa Climate ChangeUnfinished.pptxHamon sa Climate ChangeUnfinished.pptx
Hamon sa Climate ChangeUnfinished.pptx
 

Recently uploaded

Transparency, Recognition and the role of eSealing - Ildiko Mazar and Koen No...
Transparency, Recognition and the role of eSealing - Ildiko Mazar and Koen No...Transparency, Recognition and the role of eSealing - Ildiko Mazar and Koen No...
Transparency, Recognition and the role of eSealing - Ildiko Mazar and Koen No...
EADTU
 
MuleSoft Integration with AWS Textract | Calling AWS Textract API |AWS - Clou...
MuleSoft Integration with AWS Textract | Calling AWS Textract API |AWS - Clou...MuleSoft Integration with AWS Textract | Calling AWS Textract API |AWS - Clou...
MuleSoft Integration with AWS Textract | Calling AWS Textract API |AWS - Clou...
MysoreMuleSoftMeetup
 
SPLICE Working Group: Reusable Code Examples
SPLICE Working Group:Reusable Code ExamplesSPLICE Working Group:Reusable Code Examples
SPLICE Working Group: Reusable Code Examples
Peter Brusilovsky
 
Personalisation of Education by AI and Big Data - Lourdes Guàrdia
Personalisation of Education by AI and Big Data - Lourdes GuàrdiaPersonalisation of Education by AI and Big Data - Lourdes Guàrdia
Personalisation of Education by AI and Big Data - Lourdes Guàrdia
EADTU
 

Recently uploaded (20)

e-Sealing at EADTU by Kamakshi Rajagopal
e-Sealing at EADTU by Kamakshi Rajagopale-Sealing at EADTU by Kamakshi Rajagopal
e-Sealing at EADTU by Kamakshi Rajagopal
 
Transparency, Recognition and the role of eSealing - Ildiko Mazar and Koen No...
Transparency, Recognition and the role of eSealing - Ildiko Mazar and Koen No...Transparency, Recognition and the role of eSealing - Ildiko Mazar and Koen No...
Transparency, Recognition and the role of eSealing - Ildiko Mazar and Koen No...
 
Stl Algorithms in C++ jjjjjjjjjjjjjjjjjj
Stl Algorithms in C++ jjjjjjjjjjjjjjjjjjStl Algorithms in C++ jjjjjjjjjjjjjjjjjj
Stl Algorithms in C++ jjjjjjjjjjjjjjjjjj
 
Observing-Correct-Grammar-in-Making-Definitions.pptx
Observing-Correct-Grammar-in-Making-Definitions.pptxObserving-Correct-Grammar-in-Making-Definitions.pptx
Observing-Correct-Grammar-in-Making-Definitions.pptx
 
Supporting Newcomer Multilingual Learners
Supporting Newcomer  Multilingual LearnersSupporting Newcomer  Multilingual Learners
Supporting Newcomer Multilingual Learners
 
OS-operating systems- ch05 (CPU Scheduling) ...
OS-operating systems- ch05 (CPU Scheduling) ...OS-operating systems- ch05 (CPU Scheduling) ...
OS-operating systems- ch05 (CPU Scheduling) ...
 
How to Manage Website in Odoo 17 Studio App.pptx
How to Manage Website in Odoo 17 Studio App.pptxHow to Manage Website in Odoo 17 Studio App.pptx
How to Manage Website in Odoo 17 Studio App.pptx
 
MuleSoft Integration with AWS Textract | Calling AWS Textract API |AWS - Clou...
MuleSoft Integration with AWS Textract | Calling AWS Textract API |AWS - Clou...MuleSoft Integration with AWS Textract | Calling AWS Textract API |AWS - Clou...
MuleSoft Integration with AWS Textract | Calling AWS Textract API |AWS - Clou...
 
TỔNG HỢP HƠN 100 ĐỀ THI THỬ TỐT NGHIỆP THPT TOÁN 2024 - TỪ CÁC TRƯỜNG, TRƯỜNG...
TỔNG HỢP HƠN 100 ĐỀ THI THỬ TỐT NGHIỆP THPT TOÁN 2024 - TỪ CÁC TRƯỜNG, TRƯỜNG...TỔNG HỢP HƠN 100 ĐỀ THI THỬ TỐT NGHIỆP THPT TOÁN 2024 - TỪ CÁC TRƯỜNG, TRƯỜNG...
TỔNG HỢP HƠN 100 ĐỀ THI THỬ TỐT NGHIỆP THPT TOÁN 2024 - TỪ CÁC TRƯỜNG, TRƯỜNG...
 
SPLICE Working Group: Reusable Code Examples
SPLICE Working Group:Reusable Code ExamplesSPLICE Working Group:Reusable Code Examples
SPLICE Working Group: Reusable Code Examples
 
Personalisation of Education by AI and Big Data - Lourdes Guàrdia
Personalisation of Education by AI and Big Data - Lourdes GuàrdiaPersonalisation of Education by AI and Big Data - Lourdes Guàrdia
Personalisation of Education by AI and Big Data - Lourdes Guàrdia
 
DEMONSTRATION LESSON IN ENGLISH 4 MATATAG CURRICULUM
DEMONSTRATION LESSON IN ENGLISH 4 MATATAG CURRICULUMDEMONSTRATION LESSON IN ENGLISH 4 MATATAG CURRICULUM
DEMONSTRATION LESSON IN ENGLISH 4 MATATAG CURRICULUM
 
TỔNG HỢP HƠN 100 ĐỀ THI THỬ TỐT NGHIỆP THPT TOÁN 2024 - TỪ CÁC TRƯỜNG, TRƯỜNG...
TỔNG HỢP HƠN 100 ĐỀ THI THỬ TỐT NGHIỆP THPT TOÁN 2024 - TỪ CÁC TRƯỜNG, TRƯỜNG...TỔNG HỢP HƠN 100 ĐỀ THI THỬ TỐT NGHIỆP THPT TOÁN 2024 - TỪ CÁC TRƯỜNG, TRƯỜNG...
TỔNG HỢP HƠN 100 ĐỀ THI THỬ TỐT NGHIỆP THPT TOÁN 2024 - TỪ CÁC TRƯỜNG, TRƯỜNG...
 
24 ĐỀ THAM KHẢO KÌ THI TUYỂN SINH VÀO LỚP 10 MÔN TIẾNG ANH SỞ GIÁO DỤC HẢI DƯ...
24 ĐỀ THAM KHẢO KÌ THI TUYỂN SINH VÀO LỚP 10 MÔN TIẾNG ANH SỞ GIÁO DỤC HẢI DƯ...24 ĐỀ THAM KHẢO KÌ THI TUYỂN SINH VÀO LỚP 10 MÔN TIẾNG ANH SỞ GIÁO DỤC HẢI DƯ...
24 ĐỀ THAM KHẢO KÌ THI TUYỂN SINH VÀO LỚP 10 MÔN TIẾNG ANH SỞ GIÁO DỤC HẢI DƯ...
 
8 Tips for Effective Working Capital Management
8 Tips for Effective Working Capital Management8 Tips for Effective Working Capital Management
8 Tips for Effective Working Capital Management
 
COMMUNICATING NEGATIVE NEWS - APPROACHES .pptx
COMMUNICATING NEGATIVE NEWS - APPROACHES .pptxCOMMUNICATING NEGATIVE NEWS - APPROACHES .pptx
COMMUNICATING NEGATIVE NEWS - APPROACHES .pptx
 
How To Create Editable Tree View in Odoo 17
How To Create Editable Tree View in Odoo 17How To Create Editable Tree View in Odoo 17
How To Create Editable Tree View in Odoo 17
 
Rich Dad Poor Dad ( PDFDrive.com )--.pdf
Rich Dad Poor Dad ( PDFDrive.com )--.pdfRich Dad Poor Dad ( PDFDrive.com )--.pdf
Rich Dad Poor Dad ( PDFDrive.com )--.pdf
 
male presentation...pdf.................
male presentation...pdf.................male presentation...pdf.................
male presentation...pdf.................
 
The Liver & Gallbladder (Anatomy & Physiology).pptx
The Liver &  Gallbladder (Anatomy & Physiology).pptxThe Liver &  Gallbladder (Anatomy & Physiology).pptx
The Liver & Gallbladder (Anatomy & Physiology).pptx
 

Point and Interval Estimate by regi.pptx

  • 1.
  • 2. ne what is: meter mate rentiate nt estimate erval e ective :
  • 3. - a numerica characteristic population, a from a statisti sample. Parameter
  • 4. Ex. 1. A number of students in CKC 2. A number of population in Brgy. Matobato Parameter
  • 5. ue, or range alues, that roximates population Estimate
  • 6. 2 Types Point Estimate • It is a specific numerical value of a population parameter • The sample mean 𝑋 is the best point estimate of a population mean. Interval Estimate • Also called as confidence interval, a range values used to estimate a parameter. This estimate may or may not contain the true parameter value.
  • 7. Point Estimate Ex. Jacky wanted to know the average students in statistics. She interviewed 40 students and the results are shown on the right.
  • 8. Interval Estimate • When σ is known The confidence level of an interval estimate is the probability that the interval estimate will contain the true population parameter. - How sure are we that the population parameter is really within that we came up with.
  • 9. Interval Estimate – 2 ways 1.) When σ is known The confidence level of an interval estimate is the probability that the interval estimate will contain the true population parameter. - How sure are we that the population parameter is really within that we came up with.
  • 10. Interval Estimate – 2 ways 2.) When σ is unknown When σ is unknown, the interval estimate can be determined using the student’s t-distribution.
  • 12. Interval Estimate E – Margin of Error Z - critical value/z- value σ – population standard deviation or sigma N – sample size
  • 14. Solve for Interval Estimate Example: Step 1: Determine the given values Step 2: Determine the critical value Step 3: Solve for the margin of error using the formula Step 4: Solve for the Interval estimate Procedure:
  • 15. Solve for Interval Estimate Example: Given: Sample size (n) = 100 Sample mean 𝑿 = 150 Population SD σ = 40 Confidence level = 95% = critical value: Z =1.96
  • 16. Solve for Interval Estimate Example: Given: Sample size (n) = 50 Sample mean 𝑿 = 20.5 Population SD σ = 3.7 Confidence level = 99% = critical value: Z = 2.58
  • 17. Interval Estimate – #2 way/ method 2.) When σ is unknown When σ is unknown, the interval estimate can be determined using the student’s t-distribution.
  • 18. Interval Estimate – σ is unknown Where; n – is the sample size
  • 19. Interval Estimate – σ is unknown
  • 20. Interval Estimate – σ is unknown (Example) Step 1: Determine the given values Step 2: Determine the degrees of freedom using the formula and the t (using the table) Step 3: Solve for the margin of error using the formula Step 4: Solve for the Interval estimate Procedure:
  • 21. Interval Estimate – σ is unknown (Example) Given: Sample size (n) = 30 Sample mean 𝑿 = 5.3 Sample S = 1.1 Confidence level = 95% Degrees of freedom = n – 1 = 30 – 1 = 29
  • 22. Interval Estimate – σ is unknown (Example)
  • 23. ESTIMATING SAMPLE SIZE In order to determine the sample size we follow the formula: n = [ 𝑍𝑎 2 σ 𝐸 ]2 Where; n = sample size 𝒁𝒂 𝟐 = Z values E = margin error
  • 24. ESTIMATING SAMPLE SIZE In order to determine the sample size we follow the formula: n = [ 𝑍𝑎 2 σ 𝐸 ]2 Where; n = sample size 𝒁𝒂 𝟐 = Z values E = margin error
  • 25. QUIZ !!! 1 whole sheet of paper -YES, 1 whole
  • 26. Direction: Solve for the Point Estimate 95 85 85 90 88 80 88 87 82 92 90 91 88 94 90 92 89 90 96 89 84 90 85 87 95 96 94 93 94 90 89 88 89 85 86 92 Mr. Gonzales wanted to know the average students in statistics. He interviewed 36 students and the results are shown below.
  • 27. Direction: Solve for the Interval Estimate. In a study of 80 junior high school students, the mean number of hours per week that they used internet was 40 hours. It was estimated that the population standard deviation was 2.5. What is the 95% confidence interval for the mean time for using internet?