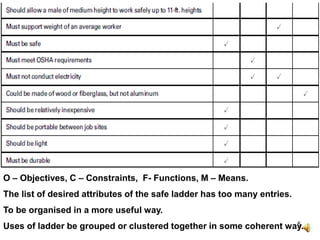
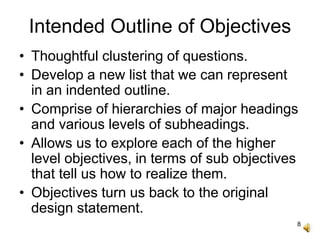
1
Clarifying Design Objectives
MEC
2
Contents
• Definitions.
• List of Objectives.
• Pruned List of Objectives.
• Objective Tree.
• Ranking Objectives.
• Pairwise Comparison Chart.
• Aggregate Rank Ordering.
• Establishing Objectives.
3
Definitions
• Objective : a feature or behavior that the
design should have or exhibit.
• Constraint : a limit or restriction on the
design’s behaviors or attributes, designs
that violate these limits are unacceptable.
• Function : a specific thing a designed
device or system is expected to do.
• Means : a way or method to make a
function happen.
4
Attributes of a Safe Ladder
5
O – Objectives, C – Constraints, F- Functions, M – Means.
The list of desired attributes of the safe ladder has too many entries.
To be organised in a more useful way.
Uses of ladder be grouped or clustered together in some coherent way.
6
Preparing a Pruned List
• Ask questions.
• Ask why we care about them?
• Why do we want our ladder to be used
outdoors?
• Why we care whether the ladder is useful?
• To be useful so that people will buy it.
• Usefulness makes a ladder marketable.
7
Pruned List of Objectives
8
Intended Outline of Objectives
• Thoughtful clustering of questions.
• Develop a new list that we can represent
in an indented outline.
• Comprise of hierarchies of major headings
and various levels of subheadings.
• Allows us to explore each of the higher
level objectives, in terms of sub objectives
that tell us how to realize them.
• Objectives turn us back to the original
design statement.
9
Intended List of Pruned Objectives
10
Intended List of Pruned Objectives
• Identifying sub objectives or ways in which
the ladder could be useful.
• “What do you mean by safe?” is answered
by two sub objectives in the cluster of
safety issues.
• The designed ladder should be both stable
and relatively stiff.
11
List of Objectives
• What to do with the things that are
removed from the original list of attributes?
• Simply put aside—recorded, but not
discarded—to be picked up again later in
the process.
• Ensure that all suggestions and ideas are
captured.
• Easier to prune/throw away things than to
recapture spontaneous ideas and
inspirations.
12
Objective Tree
• Information represented graphically in a
hierarchy of boxes.
• Contains an objective for the object being
designed.
• Indented outline becomes an objectives
tree.
• Graphical depiction of objectives for the
device or system.
13
Objective Tree
• Root node at the top of the tree
decomposed or broken down into sub
objectives at differing levels of importance.
• Tree reflects a hierarchical structure as it
expands downward.
• Continue to parse/decompose sub
objectives until we are unable to express
succeeding levels as further
subobjectives.
• Stop when we run out of objectives and
implementations begin to appear.
14
Objective Tree
• Objectives tree also gives the tree some
organizational strength and utility.
• Clusters together related sub objectives or
similar ideas.
• Useful for portraying design issues.
• For highlighting things we need to
measure.
• Objectives will provide our basis for
choosing between alternatives.
• Tree format corresponds to the mechanics
of the process that many designers follow.
15
Objective Tree
• Work down an objectives tree to get more
details.
• Answers the question “How are you going
to do that?”
• Move up the tree, or further out toward
fewer indentations.
• Answers the question “Why do you want
that?”
16
Objective Tree
17
Constraints in Objective Trees
• Constraints sometimes added to
objectives tree.
• Present constraints in boxes differently
shaped than the objectives.
• May use italics or a different font to denote
constraints.
• Constraints are related to but are different
from objectives.
18
Juice Container Design –
Customer Concerns
• Plastic bottles and containers all look
alike.
• Product to be delivered to diverse climates
and environments.
• Safety for parents whose children might
drink the juice.
• Concern about environmental issues.
• Market competition.
• Parents/teachers want children to be able
to get their own drinks.
• Children always spill drinks.
19
Annotated Objectives List for
Juice Container Design
20
Objective Tree for
Juice Container Design
21
Measuring Objectives
• Are some objectives more important than
others?
• What are the client’s priorities?
• How will we know whether objectives have
been achieved?
• Are there measurements we could make
to compare design objectives and their
relative achievement?
22
Measuring Objectives
• Needs a ruler to establish a common basis
for comparison.
• Without rulers, we cannot meaningfully
quantify assertions.
• Ruler as a measuring stick marked with a
zero and a countable number of intervals
of fixed length to establish real numbers
that represent parameters.
• Use of ordinal scales to place things in
rank order.
23
Measuring Objectives
• Ask the client to set priorities.
• Ask for subjective ranking of relative
importance.
• Client may have preferences, but no
meaning in saying that one is ‘n’ times
more important than the other.
24
Ranking Objectives
• Some objectives more important than
others.
• Recognize the relative importance and
measure it.
• Comparing objectives with hierarchical
restriction in mind.
• Pairwise Comparison Chart for ordering
the relative importance of objectives.
• Can order any two objectives taken as a
pair.
25
Pairwise Comparison Chart
• Compare every objective with each
remaining objective individually.
• Add total scores for each objective.
• Entries in each box of the PCC determined
as binary choices (0 or 1).
• Enter 0 in the durability column if one
objective has less preference than the
other, 1 if more preference, nothing when
weighing an objective with itself, 0.5 if
valued equally.
26
Pairwise Comparison Chart
Scores for each objective found by adding across each row.
27
Pairwise Comparison
• Cannot drop objectives that score zeroes.
• PCC process also known as the Borda
count, is a valid way of ordering things.
• A straightforward rank ordering, or an
ordering of place in line.
• Not a strong measurement, no scale on
which we can measure the four objectives.
• Cannot claim that one is ‘n’ times more
important than the other.
28
Pairwise Comparison
• Pairwise comparison, if done correctly,
preserves transitivity, will be consistent.
• PCC (or Borda count) can be used to
indicate the collective preferences of a
group of clients or of a design team.
• Use of Aggregate PCC - develop an
aggregate ranking for a group of clients,
users, or designers
29
Aggregate Rank Ordering
• Different individuals produce different
individual orderings.
• Use of ranking symbol >
• A > B means “A is preferred to B”.
• Eg; 1 preferred A > B > C, 4 preferred B
>C > A, 3 preferred C > B > A.
• Collective will worked out through the
aggregated PCC.
30
Aggregate Rank Ordering
• One point awarded to the winner of each
pairwise comparison.
• Number of points awarded to each
alternative by each of the rankers is
summed.
• Group consensus based on summing
determines the most important objective.
31
Aggregated Pairwise Comparison
Chart
Group Consensus C > B > A, not clearly unanimous.
32
Using Pairwise Comparison Chart
• PCC approach to be applied in a
constrained, top down fashion.
- objectives are compared only when at
the same level on the objectives tree.
- higher-level objectives are compared
and ranked before those at lower, more
detailed levels.
33
Using Pairwise Comparison Chart
• More “global” objectives (more abstract
objectives higher up on the objectives
tree) properly understood and ranked
before we fine-tune the details.
• Rank objectives below the top level only
for the design of complex subsystems,
within large and complex systems.
• Ask whose values are being assessed
when we use a PCC.
• There could be objectives rankings that
reflect fundamental values of clients
and/or designers.
34
PCC for Juice Container Design
- Company ABC
35
PCC for Juice Container Design
- Company XYZ
36
PCC for Juice Container Design
- Conclusions
• Subjective values show up in PCCs and,
consequently, in the marketplace!
• Company ABC was far more interested in
a container that would generate a strong
brand identity and be easy to distribute
than in one that would be environmentally
benign or appeals to parents.
• For company XYZ, the environment and
the taste preservation ranked more highly.
37
Establishing Metrics
• For assessing quantitative performance
ratings on similar, consistent scales.
• Methods:
- Use-Value Analysis.
- German VDI 2225 scales.
38
Establishing Metrics
39
Establishing Metrics
An Example
40
Establishing Metrics
- Juice Container Design
41
Establishing Metrics
- Juice Container Design
42
Establishing Metrics
- Juice Container Design
43
Reference
• Clive L Dim, Patrick Little and Elizabeth J
Orwin, “Engineering Design, A Project
Based Introduction”, 4th Edition, Wiley,
U.S.A, 2014.
44
Thank You

EST 200, Clarifying Design Objectives

  • 1.
  • 2.
    2 Contents • Definitions. • Listof Objectives. • Pruned List of Objectives. • Objective Tree. • Ranking Objectives. • Pairwise Comparison Chart. • Aggregate Rank Ordering. • Establishing Objectives.
  • 3.
    3 Definitions • Objective :a feature or behavior that the design should have or exhibit. • Constraint : a limit or restriction on the design’s behaviors or attributes, designs that violate these limits are unacceptable. • Function : a specific thing a designed device or system is expected to do. • Means : a way or method to make a function happen.
  • 4.
    4 Attributes of aSafe Ladder
  • 5.
    5 O – Objectives,C – Constraints, F- Functions, M – Means. The list of desired attributes of the safe ladder has too many entries. To be organised in a more useful way. Uses of ladder be grouped or clustered together in some coherent way.
  • 6.
    6 Preparing a PrunedList • Ask questions. • Ask why we care about them? • Why do we want our ladder to be used outdoors? • Why we care whether the ladder is useful? • To be useful so that people will buy it. • Usefulness makes a ladder marketable.
  • 7.
    7 Pruned List ofObjectives
  • 8.
    8 Intended Outline ofObjectives • Thoughtful clustering of questions. • Develop a new list that we can represent in an indented outline. • Comprise of hierarchies of major headings and various levels of subheadings. • Allows us to explore each of the higher level objectives, in terms of sub objectives that tell us how to realize them. • Objectives turn us back to the original design statement.
  • 9.
    9 Intended List ofPruned Objectives
  • 10.
    10 Intended List ofPruned Objectives • Identifying sub objectives or ways in which the ladder could be useful. • “What do you mean by safe?” is answered by two sub objectives in the cluster of safety issues. • The designed ladder should be both stable and relatively stiff.
  • 11.
    11 List of Objectives •What to do with the things that are removed from the original list of attributes? • Simply put aside—recorded, but not discarded—to be picked up again later in the process. • Ensure that all suggestions and ideas are captured. • Easier to prune/throw away things than to recapture spontaneous ideas and inspirations.
  • 12.
    12 Objective Tree • Informationrepresented graphically in a hierarchy of boxes. • Contains an objective for the object being designed. • Indented outline becomes an objectives tree. • Graphical depiction of objectives for the device or system.
  • 13.
    13 Objective Tree • Rootnode at the top of the tree decomposed or broken down into sub objectives at differing levels of importance. • Tree reflects a hierarchical structure as it expands downward. • Continue to parse/decompose sub objectives until we are unable to express succeeding levels as further subobjectives. • Stop when we run out of objectives and implementations begin to appear.
  • 14.
    14 Objective Tree • Objectivestree also gives the tree some organizational strength and utility. • Clusters together related sub objectives or similar ideas. • Useful for portraying design issues. • For highlighting things we need to measure. • Objectives will provide our basis for choosing between alternatives. • Tree format corresponds to the mechanics of the process that many designers follow.
  • 15.
    15 Objective Tree • Workdown an objectives tree to get more details. • Answers the question “How are you going to do that?” • Move up the tree, or further out toward fewer indentations. • Answers the question “Why do you want that?”
  • 16.
  • 17.
    17 Constraints in ObjectiveTrees • Constraints sometimes added to objectives tree. • Present constraints in boxes differently shaped than the objectives. • May use italics or a different font to denote constraints. • Constraints are related to but are different from objectives.
  • 18.
    18 Juice Container Design– Customer Concerns • Plastic bottles and containers all look alike. • Product to be delivered to diverse climates and environments. • Safety for parents whose children might drink the juice. • Concern about environmental issues. • Market competition. • Parents/teachers want children to be able to get their own drinks. • Children always spill drinks.
  • 19.
    19 Annotated Objectives Listfor Juice Container Design
  • 20.
  • 21.
    21 Measuring Objectives • Aresome objectives more important than others? • What are the client’s priorities? • How will we know whether objectives have been achieved? • Are there measurements we could make to compare design objectives and their relative achievement?
  • 22.
    22 Measuring Objectives • Needsa ruler to establish a common basis for comparison. • Without rulers, we cannot meaningfully quantify assertions. • Ruler as a measuring stick marked with a zero and a countable number of intervals of fixed length to establish real numbers that represent parameters. • Use of ordinal scales to place things in rank order.
  • 23.
    23 Measuring Objectives • Askthe client to set priorities. • Ask for subjective ranking of relative importance. • Client may have preferences, but no meaning in saying that one is ‘n’ times more important than the other.
  • 24.
    24 Ranking Objectives • Someobjectives more important than others. • Recognize the relative importance and measure it. • Comparing objectives with hierarchical restriction in mind. • Pairwise Comparison Chart for ordering the relative importance of objectives. • Can order any two objectives taken as a pair.
  • 25.
    25 Pairwise Comparison Chart •Compare every objective with each remaining objective individually. • Add total scores for each objective. • Entries in each box of the PCC determined as binary choices (0 or 1). • Enter 0 in the durability column if one objective has less preference than the other, 1 if more preference, nothing when weighing an objective with itself, 0.5 if valued equally.
  • 26.
    26 Pairwise Comparison Chart Scoresfor each objective found by adding across each row.
  • 27.
    27 Pairwise Comparison • Cannotdrop objectives that score zeroes. • PCC process also known as the Borda count, is a valid way of ordering things. • A straightforward rank ordering, or an ordering of place in line. • Not a strong measurement, no scale on which we can measure the four objectives. • Cannot claim that one is ‘n’ times more important than the other.
  • 28.
    28 Pairwise Comparison • Pairwisecomparison, if done correctly, preserves transitivity, will be consistent. • PCC (or Borda count) can be used to indicate the collective preferences of a group of clients or of a design team. • Use of Aggregate PCC - develop an aggregate ranking for a group of clients, users, or designers
  • 29.
    29 Aggregate Rank Ordering •Different individuals produce different individual orderings. • Use of ranking symbol > • A > B means “A is preferred to B”. • Eg; 1 preferred A > B > C, 4 preferred B >C > A, 3 preferred C > B > A. • Collective will worked out through the aggregated PCC.
  • 30.
    30 Aggregate Rank Ordering •One point awarded to the winner of each pairwise comparison. • Number of points awarded to each alternative by each of the rankers is summed. • Group consensus based on summing determines the most important objective.
  • 31.
    31 Aggregated Pairwise Comparison Chart GroupConsensus C > B > A, not clearly unanimous.
  • 32.
    32 Using Pairwise ComparisonChart • PCC approach to be applied in a constrained, top down fashion. - objectives are compared only when at the same level on the objectives tree. - higher-level objectives are compared and ranked before those at lower, more detailed levels.
  • 33.
    33 Using Pairwise ComparisonChart • More “global” objectives (more abstract objectives higher up on the objectives tree) properly understood and ranked before we fine-tune the details. • Rank objectives below the top level only for the design of complex subsystems, within large and complex systems. • Ask whose values are being assessed when we use a PCC. • There could be objectives rankings that reflect fundamental values of clients and/or designers.
  • 34.
    34 PCC for JuiceContainer Design - Company ABC
  • 35.
    35 PCC for JuiceContainer Design - Company XYZ
  • 36.
    36 PCC for JuiceContainer Design - Conclusions • Subjective values show up in PCCs and, consequently, in the marketplace! • Company ABC was far more interested in a container that would generate a strong brand identity and be easy to distribute than in one that would be environmentally benign or appeals to parents. • For company XYZ, the environment and the taste preservation ranked more highly.
  • 37.
    37 Establishing Metrics • Forassessing quantitative performance ratings on similar, consistent scales. • Methods: - Use-Value Analysis. - German VDI 2225 scales.
  • 38.
  • 39.
  • 40.
  • 41.
  • 42.
  • 43.
    43 Reference • Clive LDim, Patrick Little and Elizabeth J Orwin, “Engineering Design, A Project Based Introduction”, 4th Edition, Wiley, U.S.A, 2014.
  • 44.