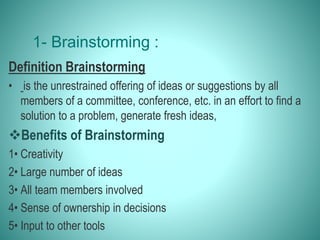
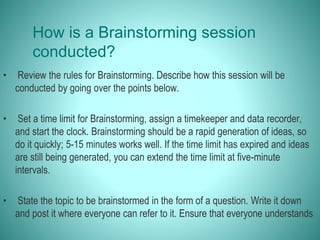
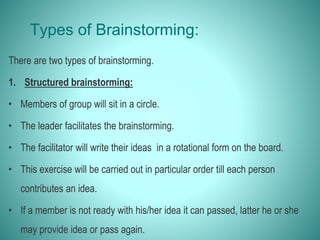
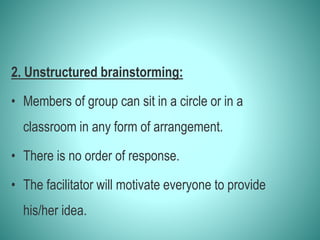
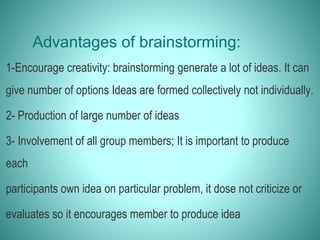
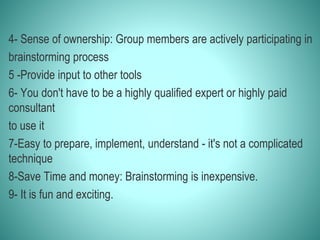
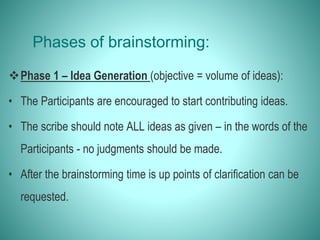
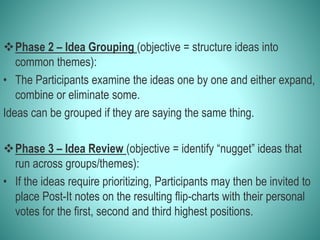
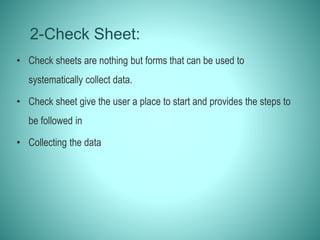
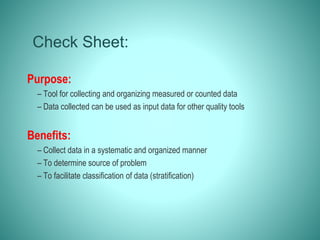
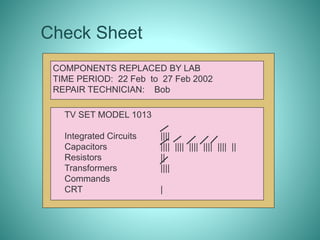
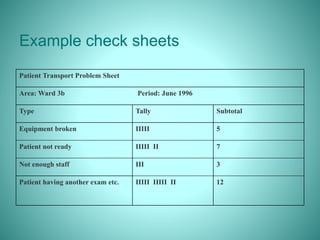
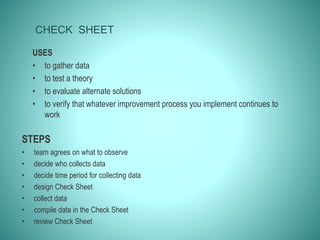
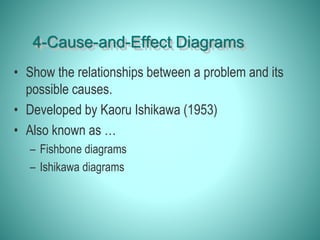
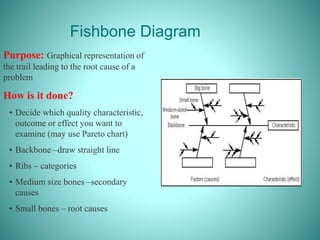
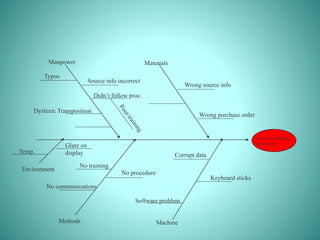
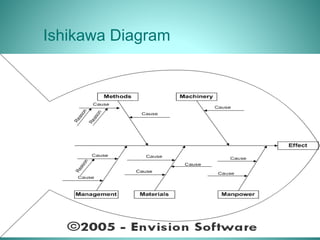
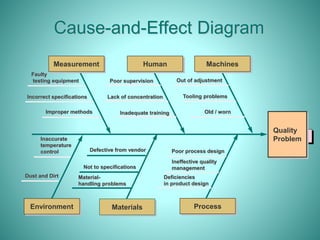
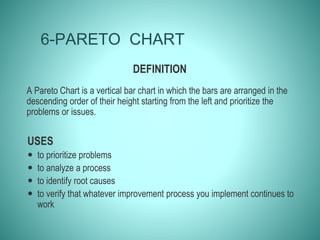
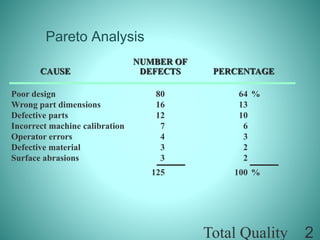
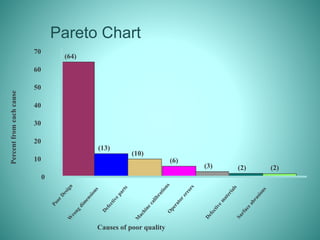
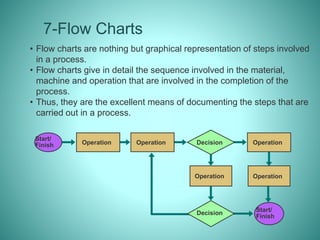
Quality Process And Procedures PowerPoint Presentation Slide SlideTeam
Use quality process and procedures PowerPoint presentation to eliminate the waste and increase the efficiency to meet the customers’ requirements. With the assistance of this quality improvement PPT presentation, you will be able to implement a quality control process, boost the quality of your products and deliver high-quality products to the consumers. This professionally designed quality assurance process presentation PPT makes sure that the organization must reach the optimal quality levels. This content ready quality management PowerPoint presentation covers a template on TQM pyramid, TQM model, customer focus in TQM, planning process, process management, business process improvement, involvement of people, TQM elements, determinants of product quality and service quality, importance of good quality, consequences of poor quality, principles and certification, TQM principles, ISO certificate, quality management tools, and root cause analysis. Use these quality improvement presentation slides to support your organization tasks while distinguishing the problems or challenges impacting your organization capacities effectively. You can highlight the concept of quality improvement, quality management, quality assurance using these quality process and procedures PPT slides. Rough design can kill even the best planned presentation. Our Quality Process And Procedures PowerPoint Presentation Slide will lend your projects world class design.
This PPT will help to understand basic concepts in Methods of Training -It will be helpful for U.G & P.G students in understanding training and development concepts. For other topics regarding training and development kindly refer my other PPT
Methods of Training – On-the-Job – Off-the-Job – Management Games, Case study method, Role play method – In-basket Exercises, Laboratory training – Experiential Learning Techniques – Brain storming, Syndicate method, Discussion method, Outward Bound Learning, Sensitivity Training in Organization – A practical tool – The Fish Bowl Exercise - E-Learning and use of Technology as Training
Simulation is the imitation of the operation of a real-world process or system over time.
The act of simulating something first requires that a model be developed; this model represents the key characteristics or behaviors/functions
A standard is a statement of excellence, or an explicit predetermined expectation that defines the key functions, activities, processes and structures required for healthcare facilities to assure the provision of safe and quality care and services.
Standards are developed by peer experts in the field and it is against the standards that conformity of the healthcare facility is evaluated. Simply stated, the standard describes a healthcare facility’s acceptable performance level. Broadly speaking, CBAHI’s standards are of three major types depending on which area they are addressing.
Global Manager Group provides Pre Accreditation Entry Level documentation kit for Hospital. Demo of the documentation kit described required list of mandatory documents like NABH manual, procedures, SOPs, audit checklist amd more.
For more details visit our website: https://www.globalmanagergroup.com/
Overview of Lean Manufacturing types of production , comparison between Batch vs Continuous Flow , how to convert batch to continuous flow and the savings
A structured approach to the investigation process should be used with the objective of determining the root cause.
The level of effort, formality, and documentation of the investigation should be commensurate with the level of risk, in line with ICH Q9.
The PDCA cycle is the key principle behind ISO 9001 and all modern management system standards. Because of that, we believe that it's of great benefit if those involved in developing and implementing systems can have a broad understanding of the concept.
So, Qudos has put together a brief introduction in this video. It explains the 4 steps in the cycle, how it can be applied, how it relates to ISO standard clauses, and then provides some examples for each stage of the cycle.
Total Quality Management in HealthcareGunjan Patel
Now days, Healthcare systems are of fundamental interests to all level of Hospitals in our societies. Eventually, increasing importance and reliance are placed on total quality management in healthcare systems. Due to this rising importance that is also reflected in the increasing percentage of national and international resources for both private and public sector to allocated in hospital management systems. Hospitals and other healthcare organization across the globe have been progressively implementing TQM to reduce costs, improve efficiency and provide high quality patient care.
The purpose of this report is to recommend a selection process model for selecting one ERP software vendor out of three possible vendors for AutoNexus. The report includes different selection models and their advantages and disadvantages, the evaluation of the Software vendors and their softwares in terms of the selection models and recommendation of the model that best suits the situation.
Cause and Effect Analysis is a technique for identifying all the possible causes (inputs) associated with a particular problem / effect (output) before narrowing down to the small number of main, root causes which need to be addressed.
This exercise will:
Provide you with a common and consistent tool for prioritising projects and initiatives
Expose the likely difficulty and resource required to implement, allowing appropriate management decisions
Understand alternative methods of prioritisation
One of the most developed cities of India, the city of Chennai is the capital of Tamilnadu and many people from different parts of India come here to earn their bread and butter. Being a metropolitan, the city is filled with towering building and beaches but the sad part as with almost every Indian city
Antibiotic Stewardship by Anushri Srivastava.pptxAnushriSrivastav
Stewardship is the act of taking good care of something.
Antimicrobial stewardship is a coordinated program that promotes the appropriate use of antimicrobials (including antibiotics), improves patient outcomes, reduces microbial resistance, and decreases the spread of infections caused by multidrug-resistant organisms.
WHO launched the Global Antimicrobial Resistance and Use Surveillance System (GLASS) in 2015 to fill knowledge gaps and inform strategies at all levels.
ACCORDING TO apic.org,
Antimicrobial stewardship is a coordinated program that promotes the appropriate use of antimicrobials (including antibiotics), improves patient outcomes, reduces microbial resistance, and decreases the spread of infections caused by multidrug-resistant organisms.
ACCORDING TO pewtrusts.org,
Antibiotic stewardship refers to efforts in doctors’ offices, hospitals, long term care facilities, and other health care settings to ensure that antibiotics are used only when necessary and appropriate
According to WHO,
Antimicrobial stewardship is a systematic approach to educate and support health care professionals to follow evidence-based guidelines for prescribing and administering antimicrobials
In 1996, John McGowan and Dale Gerding first applied the term antimicrobial stewardship, where they suggested a causal association between antimicrobial agent use and resistance. They also focused on the urgency of large-scale controlled trials of antimicrobial-use regulation employing sophisticated epidemiologic methods, molecular typing, and precise resistance mechanism analysis.
Antimicrobial Stewardship(AMS) refers to the optimal selection, dosing, and duration of antimicrobial treatment resulting in the best clinical outcome with minimal side effects to the patients and minimal impact on subsequent resistance.
According to the 2019 report, in the US, more than 2.8 million antibiotic-resistant infections occur each year, and more than 35000 people die. In addition to this, it also mentioned that 223,900 cases of Clostridoides difficile occurred in 2017, of which 12800 people died. The report did not include viruses or parasites
VISION
Being proactive
Supporting optimal animal and human health
Exploring ways to reduce overall use of antimicrobials
Using the drugs that prevent and treat disease by killing microscopic organisms in a responsible way
GOAL
to prevent the generation and spread of antimicrobial resistance (AMR). Doing so will preserve the effectiveness of these drugs in animals and humans for years to come.
being to preserve human and animal health and the effectiveness of antimicrobial medications.
to implement a multidisciplinary approach in assembling a stewardship team to include an infectious disease physician, a clinical pharmacist with infectious diseases training, infection preventionist, and a close collaboration with the staff in the clinical microbiology laboratory
to prevent antimicrobial overuse, misuse and abuse.
to minimize the developme
Telehealth Psychology Building Trust with Clients.pptxThe Harvest Clinic
Telehealth psychology is a digital approach that offers psychological services and mental health care to clients remotely, using technologies like video conferencing, phone calls, text messaging, and mobile apps for communication.
The Importance of Community Nursing Care.pdfAD Healthcare
NDIS and Community 24/7 Nursing Care is a specific type of support that may be provided under the NDIS for individuals with complex medical needs who require ongoing nursing care in a community setting, such as their home or a supported accommodation facility.
Navigating Challenges: Mental Health, Legislation, and the Prison System in B...Guillermo Rivera
This conference will delve into the intricate intersections between mental health, legal frameworks, and the prison system in Bolivia. It aims to provide a comprehensive overview of the current challenges faced by mental health professionals working within the legislative and correctional landscapes. Topics of discussion will include the prevalence and impact of mental health issues among the incarcerated population, the effectiveness of existing mental health policies and legislation, and potential reforms to enhance the mental health support system within prisons.
Empowering ACOs: Leveraging Quality Management Tools for MIPS and BeyondHealth Catalyst
Join us as we delve into the crucial realm of quality reporting for MSSP (Medicare Shared Savings Program) Accountable Care Organizations (ACOs).
In this session, we will explore how a robust quality management solution can empower your organization to meet regulatory requirements and improve processes for MIPS reporting and internal quality programs. Learn how our MeasureAble application enables compliance and fosters continuous improvement.
CHAPTER 1 SEMESTER V - ROLE OF PEADIATRIC NURSE.pdfSachin Sharma
Pediatric nurses play a vital role in the health and well-being of children. Their responsibilities are wide-ranging, and their objectives can be categorized into several key areas:
1. Direct Patient Care:
Objective: Provide comprehensive and compassionate care to infants, children, and adolescents in various healthcare settings (hospitals, clinics, etc.).
This includes tasks like:
Monitoring vital signs and physical condition.
Administering medications and treatments.
Performing procedures as directed by doctors.
Assisting with daily living activities (bathing, feeding).
Providing emotional support and pain management.
2. Health Promotion and Education:
Objective: Promote healthy behaviors and educate children, families, and communities about preventive healthcare.
This includes tasks like:
Administering vaccinations.
Providing education on nutrition, hygiene, and development.
Offering breastfeeding and childbirth support.
Counseling families on safety and injury prevention.
3. Collaboration and Advocacy:
Objective: Collaborate effectively with doctors, social workers, therapists, and other healthcare professionals to ensure coordinated care for children.
Objective: Advocate for the rights and best interests of their patients, especially when children cannot speak for themselves.
This includes tasks like:
Communicating effectively with healthcare teams.
Identifying and addressing potential risks to child welfare.
Educating families about their child's condition and treatment options.
4. Professional Development and Research:
Objective: Stay up-to-date on the latest advancements in pediatric healthcare through continuing education and research.
Objective: Contribute to improving the quality of care for children by participating in research initiatives.
This includes tasks like:
Attending workshops and conferences on pediatric nursing.
Participating in clinical trials related to child health.
Implementing evidence-based practices into their daily routines.
By fulfilling these objectives, pediatric nurses play a crucial role in ensuring the optimal health and well-being of children throughout all stages of their development.
CRISPR-Cas9, a revolutionary gene-editing tool, holds immense potential to reshape medicine, agriculture, and our understanding of life. But like any powerful tool, it comes with ethical considerations.
Unveiling CRISPR: This naturally occurring bacterial defense system (crRNA & Cas9 protein) fights viruses. Scientists repurposed it for precise gene editing (correction, deletion, insertion) by targeting specific DNA sequences.
The Promise: CRISPR offers exciting possibilities:
Gene Therapy: Correcting genetic diseases like cystic fibrosis.
Agriculture: Engineering crops resistant to pests and harsh environments.
Research: Studying gene function to unlock new knowledge.
The Peril: Ethical concerns demand attention:
Off-target Effects: Unintended DNA edits can have unforeseen consequences.
Eugenics: Misusing CRISPR for designer babies raises social and ethical questions.
Equity: High costs could limit access to this potentially life-saving technology.
The Path Forward: Responsible development is crucial:
International Collaboration: Clear guidelines are needed for research and human trials.
Public Education: Open discussions ensure informed decisions about CRISPR.
Prioritize Safety and Ethics: Safety and ethical principles must be paramount.
CRISPR offers a powerful tool for a better future, but responsible development and addressing ethical concerns are essential. By prioritizing safety, fostering open dialogue, and ensuring equitable access, we can harness CRISPR's power for the benefit of all. (2998 characters)
ICH Guidelines for Pharmacovigilance.pdfNEHA GUPTA
The "ICH Guidelines for Pharmacovigilance" PDF provides a comprehensive overview of the International Council for Harmonisation of Technical Requirements for Pharmaceuticals for Human Use (ICH) guidelines related to pharmacovigilance. These guidelines aim to ensure that drugs are safe and effective for patients by monitoring and assessing adverse effects, ensuring proper reporting systems, and improving risk management practices. The document is essential for professionals in the pharmaceutical industry, regulatory authorities, and healthcare providers, offering detailed procedures and standards for pharmacovigilance activities to enhance drug safety and protect public health.
Deep Leg Vein Thrombosis (DVT): Meaning, Causes, Symptoms, Treatment, and Mor...The Lifesciences Magazine
Deep Leg Vein Thrombosis occurs when a blood clot forms in one or more of the deep veins in the legs. These clots can impede blood flow, leading to severe complications.
2. 1- Brainstorming :
Definition Brainstorming
• is the unrestrained offering of ideas or suggestions by all
members of a committee, conference, etc. in an effort to find a
solution to a problem, generate fresh ideas,
Benefits of Brainstorming
1• Creativity
2• Large number of ideas
3• All team members involved
4• Sense of ownership in decisions
5• Input to other tools
3. How is a Brainstorming session
conducted?
• Review the rules for Brainstorming. Describe how this session will be
conducted by going over the points below.
• Set a time limit for Brainstorming, assign a timekeeper and data recorder,
and start the clock. Brainstorming should be a rapid generation of ideas, so
do it quickly; 5-15 minutes works well. If the time limit has expired and ideas
are still being generated, you can extend the time limit at five-minute
intervals.
• State the topic to be brainstormed in the form of a question. Write it down
and post it where everyone can refer to it. Ensure that everyone understands
4. Types of Brainstorming:
There are two types of brainstorming.
1. Structured brainstorming:
• Members of group will sit in a circle.
• The leader facilitates the brainstorming.
• The facilitator will write their ideas in a rotational form on the board.
• This exercise will be carried out in particular order till each person
contributes an idea.
• If a member is not ready with his/her idea it can passed, latter he or she
may provide idea or pass again.
5. 2. Unstructured brainstorming:
• Members of group can sit in a circle or in a
classroom in any form of arrangement.
• There is no order of response.
• The facilitator will motivate everyone to provide
his/her idea.
6. Advantages of brainstorming:
1-Encourage creativity: brainstorming generate a lot of ideas. It can
give number of options Ideas are formed collectively not individually.
2- Production of large number of ideas
3- Involvement of all group members; It is important to produce
each
participants own idea on particular problem, it dose not criticize or
evaluates so it encourages member to produce idea
7. 4- Sense of ownership: Group members are actively participating in
brainstorming process
5 -Provide input to other tools
6- You don't have to be a highly qualified expert or highly paid
consultant
to use it
7-Easy to prepare, implement, understand - it's not a complicated
technique
8-Save Time and money: Brainstorming is inexpensive.
9- It is fun and exciting.
8. Phases of brainstorming:
Phase 1 – Idea Generation (objective = volume of ideas):
• The Participants are encouraged to start contributing ideas.
• The scribe should note ALL ideas as given – in the words of the
Participants - no judgments should be made.
• After the brainstorming time is up points of clarification can be
requested.
9. Phase 2 – Idea Grouping (objective = structure ideas into
common themes):
• The Participants examine the ideas one by one and either expand,
combine or eliminate some.
Ideas can be grouped if they are saying the same thing.
Phase 3 – Idea Review (objective = identify “nugget” ideas that
run across groups/themes):
• If the ideas require prioritizing, Participants may then be invited to
place Post-It notes on the resulting flip-charts with their personal
votes for the first, second and third highest positions.
10. 2-Check Sheet:
• Check sheets are nothing but forms that can be used to
systematically collect data.
• Check sheet give the user a place to start and provides the steps to
be followed in
• Collecting the data
11. Check Sheet:
Purpose:
– Tool for collecting and organizing measured or counted data
– Data collected can be used as input data for other quality tools
Benefits:
– Collect data in a systematic and organized manner
– To determine source of problem
– To facilitate classification of data (stratification)
12. Check Sheet
COMPONENTS REPLACED BY LAB
TIME PERIOD: 22 Feb to 27 Feb 2002
REPAIR TECHNICIAN: Bob
TV SET MODEL 1013
Integrated Circuits ||||
Capacitors |||| |||| |||| |||| |||| ||
Resistors ||
Transformers ||||
Commands
CRT |
13. Example check sheets
Patient Transport Problem Sheet
Area: Ward 3b Period: June 1996
Type Tally Subtotal
Equipment broken IIIII 5
Patient not ready IIIII II 7
Not enough staff III 3
Patient having another exam etc. IIIII IIIII II 12
14. CHECK SHEET
USES
• to gather data
• to test a theory
• to evaluate alternate solutions
• to verify that whatever improvement process you implement continues to
work
STEPS
• team agrees on what to observe
• decide who collects data
• decide time period for collecting data
• design Check Sheet
• collect data
• compile data in the Check Sheet
• review Check Sheet
15. 3-priority matrix:
• Use the priority matrix as a quick visual reference for prioritizing project
deliverables.
• Refer to the matrix to get started with the more detailed action planning process.
• Go with your instincts when plotting elements on the matrix.
• Refer to the project elements developed in the fishbone analysis workshops.
• Use one matrix per project.
• Avoid small details at this stage.
• Remember—nothing is fixed at this stage.
16. Objectives
• To prioritize the relative merits of alternative actions
using a visual tool.
• To help shortlist the best candidates to take forward.
• To quickly generate consensus among a group of
people on what should be considered a priority.
17. the steps to take in developing a
priority setting matrix.
1-Develop criteria that are important for the listed issues/problems/solutions that were generated
from your team or brainstorming session. Examples of typical criteria include:
– Frequency: How frequent is the problem? Does it occur often or only on rare
occasions?
– Importance: From the point of view of the users, what are the most important problems?
What are the problems that you want to resolve?
– Cost
– Time
– Potential Benefits
– Ease of Implementation
– Feasibility: How realistic is it that we can resolve the problem? Will it be easy or
difficult?
– You can choose other criteria if they better fit the situation you are discussing.
18. 2-List criteria on flipchart or blackboard. Narrow criteria to 10 or fewer
through consensus or multi-voting approach. Multi-voting steps:
– Count number of criteria listed and divide by 3.
– Each member has this number of votes from step 2 to vote for criteria
they consider important.
– Count votes. Eliminate any criteria with < 2 votes. With teams > 5
members- you may want to eliminate criteria with 3-4 votes.
– Repeat process until a manageable number of items are achieved (2-
6).
•
19. 3-Weight Criteria- each member allocates 1 point between the criteria.
Compute a composite score by adding up scores from all members for a
particular criteria. (see example below).
4-Rank items against established criteria based on selected scoring
systems. Examples of scoring systems noted on next page.
5-Add total of all members rankings from step 4 and multiply by the
criteria weight. High scores indicate the best options.
20. Weight Criteria Example
Criteria Team Member A Team Member B Team Member C Composite Score
A. Frequency .5 .4 .9
B. Importance .2 .2 .3 .7
C. Feasibility .3 .2 .3 .8
D. Cost .6 .6
Total 1. 1. 1. 3.0
21. 4-Cause-and-Effect Diagrams
• Show the relationships between a problem and its
possible causes.
• Developed by Kaoru Ishikawa (1953)
• Also known as …
– Fishbone diagrams
– Ishikawa diagrams
22. Fishbone Diagram
Purpose: Graphical representation of
the trail leading to the root cause of a
problem
How is it done?
• Decide which quality characteristic,
outcome or effect you want to
examine (may use Pareto chart)
• Backbone –draw straight line
• Ribs – categories
• Medium size bones –secondary
causes
• Small bones – root causes
23. Cause & Effect Diagrams
Benefits:
• Breaks problems down into bite-size pieces to find root cause
• Fosters team work
• Common understanding of factors causing the problem
• Road map to verify picture of the process
• Follows brainstorming relationship
24. Incorrect shipping
documents
Manpower Materials
Methods Machine
Environment
Keyboard sticks
Wrong source info
Wrong purchase order
Typos
Source info incorrect
Dyslexic Transposition
Didn’t follow proc.
Glare on
displayTemp.
No procedure
No communications
No training
Software problem
Corrupt data
26. Cause-and-Effect Diagram
Quality
Problem
Out of adjustment
Tooling problems
Old / worn
Machines
Faulty
testing equipment
Incorrect specifications
Improper methods
Measurement
Poor supervision
Lack of concentration
Inadequate training
Human
Deficiencies
in product design
Ineffective quality
management
Poor process design
Process
Inaccurate
temperature
control
Dust and Dirt
Environment
Defective from vendor
Not to specifications
Material-
handling problems
Materials
27. 5-In-depth analysis :
• An in-depth analysis is required to clearly define a problem.
There are many examples where the analysis for a complete
problem definition results in the solution being identified. The
analysis starts with preparation (or review of the existing)
process flow diagram to define clearly the work process and
alternative paths. Team preparation or review ensures that all
individuals are familiar with the process.
28. 6-PARETO CHART
DEFINITION
A Pareto Chart is a vertical bar chart in which the bars are arranged in the
descending order of their height starting from the left and prioritize the
problems or issues.
USES
to prioritize problems
to analyze a process
to identify root causes
to verify that whatever improvement process you implement continues to
work
29. Total Quality 2
NUMBER OF
CAUSE DEFECTS PERCENTAGE
Poor design 80 64 %
Wrong part dimensions 16 13
Defective parts 12 10
Incorrect machine calibration 7 6
Operator errors 4 3
Defective material 3 2
Surface abrasions 3 2
125 100 %
Pareto Analysis
32. Flow Charts
Purpose:
Visual illustration of the sequence of operations required to complete a
task
Schematic drawing of the process to measure or improve.
Starting point for process improvement
Potential weakness in the process are made visual.
Picture of process as it should be.
Benefits:
Identify process improvements
Understand the process
Shows duplicated effort and other non-value-added steps
Clarify working relationships between people and organizations
Target specific steps in the process for improvement.
33. Flow charts
Benefits
• Show what actually happens at
each step in the process
• Show what happens when non-
standard events occur
• Graphically display processes to
identify redundancies and other
wasted effort
How is it done?
• Write the process step inside each
symbol
• Connect the Symbols with arrows
showing the direction of flow
Toolbox
34. 8-Control Chart
• A statistical tool used to distinguish between process
variation resulting from common causes and variation
resulting from special causes.
35. Control Charts
Purpose:
The primary purpose of a control chart is to predict
expected product outcome.
Benefits:
• Predict process out of control and out of specification
limits
• Distinguish between specific, identifiable causes of
variation
• Can be used for statistical process control
36. Why Use Control Charts?
• Monitor process variation over time
• Differentiate between special cause and
common cause variation
• Assess effectiveness of changes
• Communicate process performance
37.
38. 9-Scatter Diagrams
How is it done?:
• Decide which paired factors you want to examine. Both factors must be
measurable on some incremental linear scale.
• Collect 30 to 100 paired data points.
• Find the highest and lowest value for both variables.
• Draw the vertical (y) and horizontal (x) axes of a graph.
• Plot the data
• Title the diagram
The shape that the cluster of dots takes will tell you something about the
relationship between the two variables that you tested.
39. Scatter Diagrams
• If the variables are correlated,
when one changes the other
probably also changes.
• Dots that look like they are trying
to form a line are strongly
correlated.
• Sometimes the scatter plot may
show little correlation when all the
data are considered at once.
Stratifying the data, that is,
breaking it into two or more
groups based on some
difference such as the
equipment used, the time of
day, some variation in
materials or differences in the
people involved, may show
surprising results
40. Scatter Diagrams
• You may occasionally get scatter diagrams that
look boomerang- or banana-shaped.
To analyze the strength of the correlation,
divide the scatter plot into two sections.
Treat each half separately in your analysis
Benefits:
• Helps identify and test probable causes.
• By knowing which elements of your process are
related and how they are related, you will know
what to control or what to vary to affect a quality
characteristic.
41. 10-Histogram
Histograms help in understanding the variation in the process.
It also helps in estimating the process capability.
0
5
10
15
20
1 2 6 13 10 16 19 17 12 16 2017 13 5 6 2 1
42. Steps to prepare a Histogram :
1.Collect data (preferably 50 or more observations of an item).
2-Arrange all values in an ascending order.
3-Divide the entire range of values into a convenient number of
groups each representing an equal class interval. It is customary to
have number of groups equal to or less than the square root of the
number of observations. However one should not be too rigid about
this. The reason for this cautionary note will be obvious when we
see some examples.
43. 4-Note the number of observations or frequency in each group.
5-Draw X-axis and Y-axis and decide appropriate scales for the groups on
X-axis and the number of observations or the frequency on Y-axis.
6-Draw bars representing the frequency for each of the groups.
7- Provide a suitable title to the Histogram.
8-Study the pattern of distribution and draw conclusion
44. 11-SWOT analysis
• A technique that enables organisations or individual to
move from everyday problems and traditional strategies
to a fresh prospective.
• SWOT analysis looks at your strengths and weaknesses,
and the opportunities and threats your business faces.
SWOT can help your company face its greatest
challenges and find its most promising new markets.
45. • Strengths: Those factors that are likely to have a positive effect on, or help
you to achieve your shared purpose
•
• Weaknesses: Those factors that are likely to have a negative effect on, or
be a barrier to achieving the shared purpose
• Opportunities: Those external factors that have not previously been
considered, that are likely to have a positive effect on, or help you to
achieve your shared purpose
• Threats: Those external factors that are likely to have a negative effect on,
or be a barrier to achieving the shared purpose, or make the shared
purpose unnecessary or unachievable
46. Objectives of SWOT analysis:
• To help you identify and resolve any perceived
weaknesses or threats in your project or organization.
• To enable you to closely analyze yourself and the
environment surrounding you.
47. INFLUENTIAL FACTORS
INTERNAL FACTORS :
(Strengths and Weaknesses) !
1-Organizational Structure (Culture, Resources) !
2-Stakeholders (employers, management, investors) !
3-Customers (people who benefit by paying) !
4-Competitors (offer similar services/products to a similar customer base)
EXTERNAL FACTORS :
(Opportunities and Threats) !
1-Technology !
2-Economy !
3-Politics/Regulation !
4-Society
48. ADVANTAGES OF SWOT ANALYSIS:
1. Factor identification
2. Wide application
One of the advantages of SWOT analysis is its wide applicability across a
variety of organizational requirements
3. Simplicity
Using the SWOT framework as an analytical tool does not require
technical skills or special training.
4. Expandability and integration
52. 12-Force Field Analysis:
• Force Field Analysis is quite influential in the field of
social sciences and is used to analyze the forces in
favor of and against change. Hence, it acts as a
yardstick to determine factors required for achieving a
goal or to identify hurdles.
53. Uses of Force Field Analysis Diagram:
1-List pros and cons of a certain situation.
2-List actions and reactions for comparison.
3-List strength and weaknesses for personality analysis.
4-Compare the interests of two opposing parties in a
negotiation.
54. Force field Analysis
Steps:
1. Identify a specific
Change
2. Identify forces for and
againsty change
3. Prioritise the forces
4. Develop Strategies to
overcome opposing and
reinforce supporting
forces