Download as PDF, PPTX


![Deriving Knowledge from Data at Scale
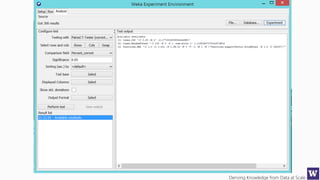
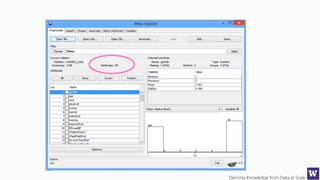
Ranks attributes by their individual evaluations, used in
conjunction with GainRatio, Entropy, Pearson, etc…
Number of attributes to return,
-1 returns all ranked attributes;
Attributes to ignore (skip) in the
evaluation forma: [1, 3-5, 10];
Cutoff at which attributes can
be discarded, -1 no cutoff;](https://image.slidesharecdn.com/bargauwdatasciencelecture8-160424211658/85/Barga-Data-Science-lecture-8-59-320.jpg)


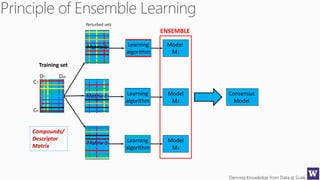


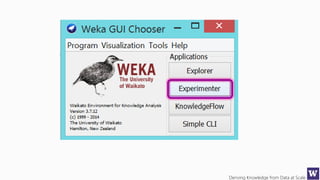
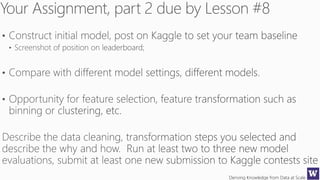
The document discusses an agenda for a lecture on deriving knowledge from data at scale. The lecture will include a course project check-in, a thought exercise on data transformation, and a deeper dive into ensembling techniques. It also provides tips on gaining experience and intuition for data science, including becoming proficient in tools, deeply understanding algorithms, and focusing on specific data types through hands-on practice of experiments. Attribute selection techniques like filters, wrappers and embedded methods are also covered. Finally, the document discusses support vector machines and handling missing values in data.


![[DSC Europe 25] Ivan Lukovic & Marija Djukic - From Data to Value: Why Maturi...](https://cdn.slidesharecdn.com/ss_thumbnails/ahrfps8xr6knowwhacxh-1-ivan-marija-dsc-2025-ld-v1-presentation-260115093812-be21adfc-thumbnail.jpg?width=640&height=640&fit=bounds)


