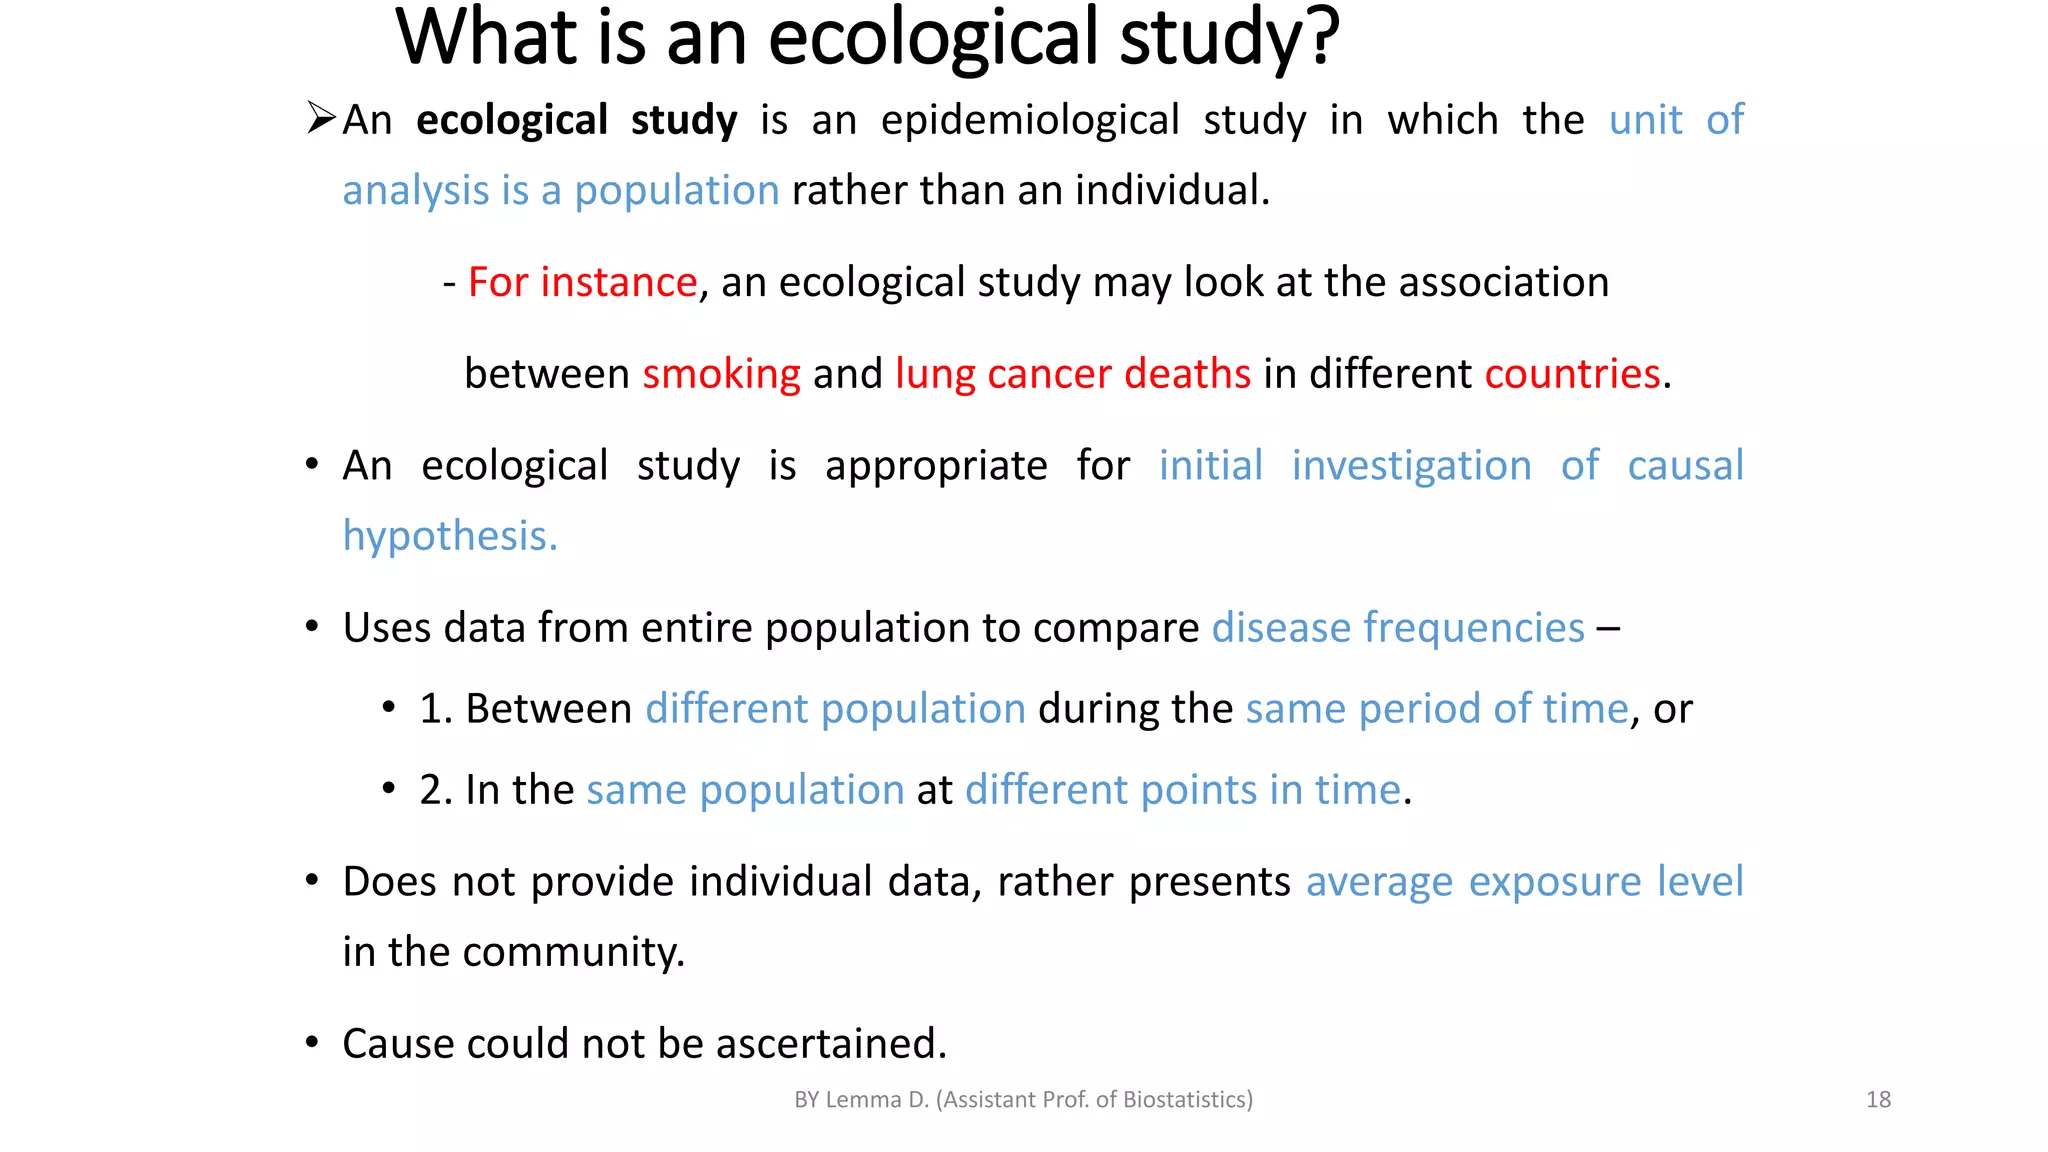
Epidemiological Study
Design
For Blended MPH students, 2022
1
BY Lemma D. (Assistant Prof. of Biostatistics)
Study design
•Study design is the arrangement
of conditions for the collection
and analysis of data to provide
the most accurate answer to a
question in the most economical
way.
2
BY Lemma D. (Assistant Prof. of Biostatistics)
Types of Epidemiologic study designs
I. Based on objective/focus/research question
1. Descriptive studies
• Describe: who, when, where & how many
2. Analytic studies
• Analyse: How and why
3
BY Lemma D. (Assistant Prof. of Biostatistics)
Types…
II. Based on the role of the investigator
1. Observational studies
• The investigator observes the nature
• No intervention
2. Intervention/Experimental studies
• Investigator intervenes
• He has control over the situation
4
BY Lemma D. (Assistant Prof. of Biostatistics)
Types…
III. Based on timing
1. One-time (one-spot) studies
• Conducted at a point in time
• An individual is observed at once
2. Longitudinal (Follow-up) studies
• Conducted in a period of time
• Individuals are followed over a period of time
5
BY Lemma D. (Assistant Prof. of Biostatistics)
Types…
IV. Based on the direction of follow-up/data collection
1. Prospective
• Conducted forward in time
2. Retrospective
• Conducted backwards in time
6
BY Lemma D. (Assistant Prof. of Biostatistics)
Types…
V. Based on the type of data they generate
1. Qualitative studies
• Generate contextual data
• Also called exploratory studies
2. Quantitative studies
• Generate numerical data
• Also called explanatory studies
7
BY Lemma D. (Assistant Prof. of Biostatistics)
Types…
VI. Based on study setting
1. Community-based studies
• Conducted in communities
2. Institution-based studies
• Conducted in institution settings
3. Laboratory-based studies
• Conducted in major laboratories
8
BY Lemma D. (Assistant Prof. of Biostatistics)
Study Design Sequence
Case reports Case series
Descriptive
epidemiology
Analytic
epidemiology
Clinical
trials
Animal
study
Lab
study
Cohort Case-
control
Cross-
sectional
Hypothesis formation
Hypothesis testing
BY Lemma D. (Assistant Prof. of Biostatistics) 9
Descriptive Studies
Case-control Studies
Cohort Studies
Develop
hypothesis
Investigate it’s
relationship to
outcomes
Define it’s meaning
with exposures
Clinical trials
Test link
experimentally
Increasing
Knowledge
of
Disease/Exposure
BY Lemma D. (Assistant Prof. of Biostatistics) 10
Descriptive study designs
11
BY Lemma D. (Assistant Prof. of Biostatistics)
Descriptive Studies
Person Time
Cases
0
5
10
15
20
25
1 2 3 4 5 6 7 8 9 10
0
200
400
600
800
1000
1200
0-4 '5-14 '15-
44
'45-
64
'64+
Age Group
Who? Where? When?
BY Lemma D. (Assistant Prof. of Biostatistics) 12
Characteristics of Persons
“Who is getting the disease?”
 Age, sex, religion, socio-economic status, race
• Young Vs old, males Vs females, rich vs poor, more educated vs less
educated, black Vs white, etc
BY Lemma D. (Assistant Prof. of Biostatistics) 13
Characteristics of Place
 “Where are the rates of disease highest/ lowest?”
• Urban vs rural, some regions more affected than others?
• National vs international?
• High altitude or low altitude?
• Polluted areas or unpolluted areas?
• Mountainous vs valley
• Adequate rainfall or little rainfall areas?
 Differences in frequency of diseases are related to variations
in climate, altitude, topography, geology and in general
environment.
BY Lemma D. (Assistant Prof. of Biostatistics) 14
Characteristics of Time
“When does the disease occur commonly/ rarely?”
Was there a sudden increase over a shorter period of time?
 Is the problem greater during the rainy or dry season?
 “Is the frequency of the disease now different from the corresponding frequency
in the past?”
Is the problem gradually increasing/ decreasing?
BY Lemma D. (Assistant Prof. of Biostatistics) 15
Uses of Descriptive Studies
Describe the pattern of disease occurrence
Describe the problem in terms of person, place and time
Generate numbers of events (frequency)
Help to calculate ratio, proportion and rates
Program planning / resource allocation
Generate hypothesis to be studied by analytic methods
BY Lemma D. (Assistant Prof. of Biostatistics) 16
Categories of descriptive epidemiological studies
1. Population as a study subject
o Correlational /ecological studies
2. Individual as study subjects
o Case report / Case series
o Cross-sectional survey
BY Lemma D. (Assistant Prof. of Biostatistics) 17
What is an ecological study?
An ecological study is an epidemiological study in which the unit of
analysis is a population rather than an individual.
- For instance, an ecological study may look at the association
between smoking and lung cancer deaths in different countries.
• An ecological study is appropriate for initial investigation of causal
hypothesis.
• Uses data from entire population to compare disease frequencies –
• 1. Between different population during the same period of time, or
• 2. In the same population at different points in time.
• Does not provide individual data, rather presents average exposure level
in the community.
• Cause could not be ascertained.
BY Lemma D. (Assistant Prof. of Biostatistics) 18
Examples-----
• Group-level measures include the rate of cancer incidence, the
mean level of hypertension, the average sunlight exposure at
specific geographic location compared between two communities
• Average per capita fat consumption and breast cancer rates
compared between two communities.
• Comparing incidence of dental cares in relation to fluoride
content of the water among towns in the rift valley.
BY Lemma D. (Assistant Prof. of Biostatistics) 19
0
2000
4000
6000
8000
10000
12000
14000
16000
18000
2006 2008 2010 2012 2014
percapita fat consumption and breast
cancer death
per capita fat consumption
average breast cancer death
0
2000
4000
6000
8000
10000
12000
14000
16000
18000
0 200 400 600 800
Number
of
ITN
distributed
Reported malaria morbidity
What type of ecological study was conducted?
BY Lemma D. (Assistant Prof. of Biostatistics) 20
Ecological analyses are only of value when the groups or communities being
compared are relatively heterogeneous in their mean levels of exposure to
outcome variable.
 For this reason, they have been used most extensively for between-country
rather than within-–country comparisons.
 Within–country comparisons:
ex: The People's Republic of China
-- because there are wide variations in disease rates from one region to
another, accompanying substantial differences in culture, behavior and
lifestyle.
BY Lemma D. (Assistant Prof. of Biostatistics) 21
More examples
BY Lemma D. (Assistant Prof. of Biostatistics) 22
Strength
• Can be done quickly and inexpensively, often using available data.
• May be best design to study health effects of environmental
exposures, eg
• Do heat waves increase death rate?
• Does soft drinks increase heart disease?
• Do economic recessions increase suicide rate?
• Such questions only sensibly addressed at population (or
community) level
BY Lemma D. (Assistant Prof. of Biostatistics) 23
Limitations
• Beyond the logical problem of the ecological fallacy, there are methodological
difficulties in ecological studies, particularly when used to draw inferences at the level
of the individual.
• Confounding is a particular problem in ecological studies of diet and diseases
associated with industrialization.
• Between-country comparisons may be restricted by the absence of comparable data,
usually on dietary intake.
• Within-country comparisons may yet be restricted by the limited size of the
population in each region and the consequent instability in rates, as well as by
homogeneity of exposures within the country as a whole.
BY Lemma D. (Assistant Prof. of Biostatistics) 24
Types of Descriptive …Cont’d
• Case report or case series
• Detailed report of a single patient (case report) or a group of
patients (case series) with a given disease
Used for
• Document unusual medical occurrences
• Gives the first clues in the identification of new disease and adverse
effects of exposures
• An important link between clinical medicine and epidemiology
• Most common types of studies
BY Lemma D. (Assistant Prof. of Biostatistics) 25
Case Report
• Case report is like storytelling in medicine
• Should be clear, short and useful for its purpose
• Is the written form of the verbal presentation of a case history
• Case reports are the lowest cadre in the world of evidence-based
medicine
• Can be powerful and instructional
BY Lemma D. (Assistant Prof. of Biostatistics) 26
Possible Reasons For a Case Report
• Very rare disease
• Association of diseases
• Rare presentations of more common diseases
• Outcome of a novel treatment
• Reporting a particular outcome of a case management
• Mistakes, complications and lessons learned
• A new disease entity
BY Lemma D. (Assistant Prof. of Biostatistics) 27
Case series
o Case-series - usually a coherent and consecutive set of cases of a disease (or
similar problem) which derive from either the practice of one or more
healthcare professionals or a defined healthcare setting e.g. a hospital or family
practice.
o A case series is, effectively, a register of cases.
o Analyse cases together to learn about the disease.
o Clinical case series are of value in epidemiology.
o Studying symptoms and signs.
o Creating case definitions.
o Clinical education, audit and research.
BY Lemma D. (Assistant Prof. of Biostatistics) 28
Case Report
Case Series
Descriptive
Epidemiology Study
One case of unusual
findings
Multiple cases of
findings
Population-based
cases with denominator
BY Lemma D. (Assistant Prof. of Biostatistics) 30
• Case reports/case series
Advantages
• Simple, quick, inexpensive
• Formulate hypothesis
 Disadvantages
• Can’t be used to test hypotheses
• Based on the experience of one or few people (small
sample size)
• Lacks comparison group
BY Lemma D. (Assistant Prof. of Biostatistics) 31
Individual Assignment
Discuss the following concepts
Cross level inference
Macroscopic generalization
Regression dilution bias
Ecological fallacy/bias
Atomistic fallacy/bias
BY Lemma D. (Assistant Prof. of Biostatistics) 32
Cross sectional study
33
BY Lemma D. (Assistant Prof. of Biostatistics)
Timing of analytical study
BY Lemma D. (Assistant Prof. of Biostatistics) 34
Cross-sectional Study
• Data collected at a single point in time
• Describes associations
• Prevalence
Cross-sectional studies are useful to generate a
hypothesis rather than to test it
For factors that remain unaltered overtime (e.g., sex,
race, blood group) it can produce a valid association
A “Snapshot”
BY Lemma D. (Assistant Prof. of Biostatistics) 35
Cross-sectional/design
Comparison groups are formed after data collection
The object of comparison are prevalence of exposure or
disease
Groups are compared either by exposure or disease
status
Cross-sectional studies are also called prevalence studies
Cross-sectional studies are characterized by concurrent
classification of groups
36
BY Lemma D. (Assistant Prof. of Biostatistics)
37
Defined population
Collect data on exposure and disease status
Exposed
Have disease
Exposed
Have no disease
Not exposed
Have disease
Not exposed
Have no disease
Study begins
BY Lemma D. (Assistant Prof. of Biostatistics)
Analysis/Measure of association
Odds ratio
Odds of disease among exposed group
Odds of disease among non exposed
Odds of exposure among disease group
Odds of exposure among non diseased group
Disease condition
D+ D-
Exposure(D+) a B
Exposure(D-) c d
38
BY Lemma D. (Assistant Prof. of Biostatistics)
Cross-sectional…
Types of cross-sectional studies
1. Single cross-sectional studies
• Determine single proportion/mean in a single population at a
single point in time
2. Comparative cross-sectional studies
• Determine two proportions/means in two populations at a single
point in time
3. Time-series cross-sectional studies
• Determine a single proportion/mean in a single population at
multiple points in time
39
BY Lemma D. (Assistant Prof. of Biostatistics)
Cross-sectional…
Advantages of cross-sectional studies
• Less expensive
• Less time consuming
• Provides more information
• Describes well
• Generates hypothesis
40
BY Lemma D. (Assistant Prof. of Biostatistics)
Cross-sectional…
Limitations of cross-sectional studies
• Antecedent-consequence uncertainty
“Chicken or egg dilemma”
• Data dredging leading to inappropriate comparison
• More vulnerable to bias
• Impractical for rare diseases and rare exposure – because we
need to take very large sample size
• Miss diseases still in latent period
• Recall of previous exposure may be difficult
41
BY Lemma D. (Assistant Prof. of Biostatistics)
Case control study
BY Lemma D. (Assistant Prof. of Biostatistics) 42
Case-control studies
• Subjects are selected with respect to the presence
(cases) or absence (controls) of disease, and then
inquiries are made about past exposure
• We compare diseased (cases) and non-diseased
(controls) to find out the level of exposure
• Exposure status is traced backward in time
43
BY Lemma D. (Assistant Prof. of Biostatistics)
44
BY Lemma D. (Assistant Prof. of
Biostatistics) 44
Case-control…
Steps in conducting case-control studies
I. Define who is a case
• Establish strict diagnostic criteria
• All who fulfil the criteria will be “case population
• Those who don’t fulfil will be “control population”
II. Select a sample of cases from case population
• This sample must be representative of the case population
45
BY Lemma D. (Assistant Prof. of Biostatistics)
Case-control…
Sources of cases
1. Hospitals (Health institution)
• Cost-less
• Bias-more
2. Population (Community)
• Cost-more
• Bias-less
46
BY Lemma D. (Assistant Prof. of Biostatistics)
Case-control…
III. Select controls from a control population
• Should be representative of control population
• Should be similar to cases except outcome
• Should be selected by the same method as cases
Sources of controls
1. Hospital (Health institution) controls
• Readily available
• Low recall bias
• More cooperative
47
BY Lemma D. (Assistant Prof. of Biostatistics)
Case-control…
However, hospital controls are
• Less representative
• More confounding
2. Population (community) controls
• More representative
• Less confounding
• Costly and time consuming
• More recall bias
• Less cooperative
48
BY Lemma D. (Assistant Prof. of Biostatistics)
Case-control…
IV. Measure the level of exposure in cases & controls
• Review or interview for exposure status
• Use same method for case and controls
V. Compare the exposure between cases & controls
• Prepare 2X2 table
• Calculate OR
• Perform statistical tests
49
BY Lemma D. (Assistant Prof. of Biostatistics)
Comparison is made primarily by estimating the relative risk as
computed by the odds ratio.
Odds is defined as the probability that an event will occur divided by
the probability that it will not occur.
In a case–control study, we typically calculate the odds of exposure
in cases (a/b) compared to the odds of exposure in non-cases(c/d).
Two possible outcomes for an exposed person: case or not
Odds=a/b
Two possible outcomes for an unexposed person: case or not
Odds=c/d
Analysis of case-control studies
50
BY Lemma D. (Assistant Prof. of
Biostatistics) 50
Analysis 2X2
51
Cases Controls Total
Exposed a b a+b
Unexposed c d c+d
Total a+c b+d a+b+c+d
Odds of exposure in cases = a/c
Odds of exposure in controls = b/d
Odds Ratio = a/c = ad
b/d bc
BY Lemma D. (Assistant Prof. of
Biostatistics) 51
52
BY Lemma D. (Assistant Prof. of Biostatistics)
53
BY Lemma D. (Assistant Prof. of Biostatistics)
54
Interpretation of results
• Odds ratio of > 1 means odds of exposure for cases is
higher than for controls – exposure is a risk factor
• Odds ratio of < 1 means odds of exposure for cases is
lower than for controls – exposure is preventive
• Odds ratio =1 means the odds of exposure is the same
in cases and controls – No association between
exposure and outcome
BY Lemma D. (Assistant Prof. of
Biostatistics) 54
Case-control…
Types of case-control studies
I. Based on case identification
1. Retrospective case-control
• Uses prevalent cases
• Increased sample size
• Difficult to establish temporal sequence
• Useful for rare outcomes
55
BY Lemma D. (Assistant Prof. of Biostatistics)
Case-control…
2. Prospective case-control
• Uses incident cases
• Establish temporal sequence
• Recall is not a serious problem
• Records are easily obtainable
56
BY Lemma D. (Assistant Prof. of Biostatistics)
Case-control…
II. Based on matching
 Matching: Relating cases and controls with respect to
certain variable
1. Matched case-control studies
2. Unmatched case-control studies
57
BY Lemma D. (Assistant Prof. of Biostatistics)
Discuss
• Nested case-control study
BY Lemma D. (Assistant Prof. of Biostatistics) 58
Common bias in case-control studies
o Information bias
- recall bias
- non-response bias
o Selection bias
- using different criteria to select cases and
controls
- the probability of selecting a real case and control
59
BY Lemma D. (Assistant Prof. of
Biostatistics) 59
Case-control…
Advantages of case-control studies
Optimal for evaluation of rare diseases
Examines multiple factors of a single disease
Quick and inexpensive
Relatively simple to carry out
Guarantee the number of people with disease
60
BY Lemma D. (Assistant Prof. of Biostatistics)
Case-control…
Limitations of case-control studies
o Inefficient for evaluation of rare exposure
o Can’t directly compute risk
o Difficult to establish temporal sequence(retrospective case
control)
o Determining exposure will often rely on memory
61
BY Lemma D. (Assistant Prof. of Biostatistics)
Design the following case-control study use picture
• Determinants of Abortion among Clients Coming for Abortion Service at HF Hospital, Ethiopia: A
Case-Control Study
62
BY Lemma D. (Assistant Prof. of Biostatistics)
Cohort study
63
BY Lemma D. (Assistant Prof. of Biostatistics)
Definition of cohort studies
 A cohort study is an observational research design which begins when a
cohort initially free of disease (outcome of interest) are classified according to
a given exposure and then followed (traced) over time
 The investigator compares whether the sub-sequent development of a new
cases of disease (other outcome of interest) differs between the exposed and
non-exposed cohorts
For example if a researcher want to investigate weather drinking more than
five cup of coffee/exposure per day in pregnancy resulted in fetal
abnormality/outcome
BY Lemma D. (Assistant Prof. of Biostatistics) 64
Time
Population
at risk
People
without
the
outcome
Pregnant
mothers
Exposed
Drink more
than five cup of
Coffee per day
Not Exposed
Not drink
any coffee
Diseased
Give abnormal
baby
Not diseased
Give normal baby
Diseased
Give abnormal
baby
Not diseased
Give normal baby
Direction of enquiry
Design of cohort studies
= == > If we want to know weather exposure to drinking coffee during
pregnancy will result in abnormal birth
65
Basic futures of cohort studies
“Disease free” or “without outcome” population at entry
Selected by exposure status rather than outcome status
Exposure example – deriving after drinking alcohol
- sleeping without using bed net
- feeding kids without washing our hands
- not using glove during injection
Follow up is needed to determine the incidence of the outcome
Compares incidence rates among exposed against non-exposed groups
66
BY Lemma D. (Assistant Prof. of
Biostatistics) 66
Cohort…
• Two types of cohort studies
1. Prospective (classical)
• Outcome hasn’t occurred at the beginning of the study
• It is the commonest and more reliable
2. Retrospective (Historical)
• Both exposure and disease has occurred before the beginning of
the study
• Faster and more economical
• Data usually incomplete and in accurate
67
BY Lemma D. (Assistant Prof. of Biostatistics)
Cohort…
Steps in conducting cohort studies
1. Define exposure
2. Select exposed group
3. Select non-exposed group
4. Follow and collect data on outcome
5. Compare outcome b/n exposed & non-exposed
68
BY Lemma D. (Assistant Prof. of Biostatistics)
Follow up period of cohort studies
oThe follow-up is the most critical and demanding part of a cohort
study
oLost to follow-up should be kept to an absolute minimum (< 10-
15%)
oChanges in the level of exposure to key risk factors, after the
initial survey and during the follow-up period, are a potentially
important source of random bias
69
BY Lemma D. (Assistant Prof. of
Biostatistics) 69
Ascertainment of outcome of interest
• The aim of good case ascertainment is to ensure that the process
of finding cases, whether deaths, illness episodes, or people with a
characteristic, is as complete as possible
• Must have a firm outcome criteria and standard diagnostic
procedure which are equally applied for exposed and non-exposed
individuals
o Any outcome measurement should be done equally both to the
exposed and non-exposed groups
70
BY Lemma D. (Assistant Prof. of
Biostatistics) 70
Analysis of cohort studies
oThe primary objective of the analysis of cohort study data is to
compare disease occurrence in the exposed and unexposed
groups
o It is a direct measurement of a risk to develop the outcome of
interest
oCalculation and comparison of rates of the incidence of the
outcome for exposed and non-exposed subjects using relative
risk (RR) as measure of association
71
BY Lemma D. (Assistant Prof. of
Biostatistics) 71
Relative Risk…
incidence of a disease among exposed a/(a+b)
incidence of a disease among non-exposed c/(c+d)
a b
c d
RR =
Disease
Yes (+) No (-)
Exposure
Yes (+)
No (-)
. a .
RR = a + b
.
. c .
c + d
a + b
c + d
72
BY Lemma D. (Assistant Prof. of
Biostatistics) 72
Strength of cohort studies:
oParticularly efficient when exposure is rare
oCan examine multiple effects of a single exposure
oMinimize bias in outcome measurement if prospective
oAllows direct measurement of incidence (risk)
oCan elucidate temporal relationship between exposure and
outcome of interest (if prospective )
BY Lemma D. (Assistant Prof. of
Biostatistics) 73
Limitation of cohort studies:
oCostly and time consuming if disease is rare and/or long latency
period (if prospective)
oValidity of the results can be seriously affected by loss to follow up
(if prospective)
oRelatively statistically inefficient unless disease is common (need
large sample size)
oIf retrospective, requires availability of adequate records
oExposure status may change during the course of study
BY Lemma D. (Assistant Prof. of
Biostatistics) 74
Discuss
• Case Cohort studies
BY Lemma D. (Assistant Prof. of
Biostatistics)
75
Experimental study
76
BY Lemma D. (Assistant Prof. of Biostatistics)
Experimental studies
o Individuals are allocated in to treatment and control groups by the
investigator
o ” Investigators must formulate a hypothesis before launching an
experimental study
- Ho: New drug “A” can not threat vivax malaria
- Ha : New drug “A” can threat vivax malaria
• If properly done, experimental studies can produce high quality data
• They are the gold standard study design
77
BY Lemma D. (Assistant Prof. of Biostatistics)
78
Design of experiential study
BY Lemma D. (Assistant Prof. of
Biostatistics) 78
Study groups in interventional studies
The comparison groups in intervention study are known as the
intervention group and the control group
oThe intervention group receives therapeutic or preventive
intervention such as health education, diet and physical exercise
etc…
oThe control group shall be offered the best known alternative or
placebo activity with no known effect on the outcome variable
79
BY Lemma D. (Assistant Prof. of
Biostatistics) 79
Example
Question: Does salted drinking water affect blood
pressure (BP) in mice?
Experiment:
1. Provide a mouse with water containing 1% NaCl and plain
water
2. Wait 14 days.
3. Measure BP.
80
BY Lemma D. (Assistant Prof. of Biostatistics) 80
Comparison/control
Good experiments are comparative.
• Compare BP in mice fed salt water to BP in mice fed plain
water.
Ideally, the experimental group is compared to concurrent
controls (rather than to historical controls).
81
BY Lemma D. (Assistant Prof. of Biostatistics) 81
Experimental…
Experimental studies can be
1. Therapeutic trials
• Conducted on patients
• To determine the effect of treatment on disease
2. Preventive trials/prophylactic trial
• Conducted on healthy people
• To determine the effect of prevention on risk(drug for prevention,
health education, healthy diet )
3. Safety trial
- Conducted on healthy or patients
- To determine the safety issue of the treatment or preventive drug
82
BY Lemma D. (Assistant Prof. of Biostatistics)
Experimental…
Three different ways of classifying intervention studies
I. Based on population studies
• Clinical trial: on patients in clinical settings(treatment is used as
an exposure and recovering (survival) from a disease is the
outcome)
• Field trial: used in testing medicine for preventive purpose and
the subjects are healthy people. During filed trial health
promotion (preventive interventions) are used as an exposure
and disease occurrence is used as an outcome. Eg; vaccine trial
• Community trial: the unite of study is the community not an
individual(Fluoridation of water to prevent dental caries)
83
BY Lemma D. (Assistant Prof. of Biostatistics)
Experimental…
II. Based on design
• Uncontrolled trial: no control (self-control)
• Non-randomized controlled: allocation not random
• Randomized control: Allocation random
III. Based on objective
• Phase I: to determine toxic effect
• Phase II: to determine therapeutic effect
• Phase III: to determine applicability
84
BY Lemma D. (Assistant Prof. of Biostatistics)
Steps of interventional studies
1. Selection of study population
2. Allocation of treatment regimen
3. Maintenance and assessment of compliance
4. Ascertainment of outcomes
5. Analysis & conclusion of experimental studies
85
BY Lemma D. (Assistant Prof. of Biostatistics)
Experimental…
Challenges in intervention studies
• Ethical issues
• Harmful treatment shouldn’t be given
• Useful treatment shouldn’t be denied
• Feasibility issues
• Getting adequate subjects
• Achieving satisfactory compliance
• Cost issues
• Experimental studies are expensive
86
BY Lemma D. (Assistant Prof. of Biostatistics)
Experimental…
• The quality of “Gold standard” in experimental studies can be
achieved through
• Randomization
• Blinding
• Placebo
87
BY Lemma D. (Assistant Prof. of Biostatistics)
Experimental…
1. Randomization: random allocation of study subjects in to treatment & control
groups
Advantage: Avoids bias & confounding
Increases confidence on results
2. Levels of blinding
• Non-blinded/open: All (the observer, study subjects and data analyst) know
which intervention a patient is receiving (common in community trials).
• Single blinded: The observer is aware but the study subjects is not aware of
treatment assignment.
• Double blinded: Neither the observer nor the study subjects is aware of
treatment assignment
• Triple blinded: The observer, study subjects and data analyst are not aware of
treatment assignment. Advantage: Avoids observation bias 88
BY Lemma D. (Assistant Prof. of Biostatistics)
Experimental…
Placebo: an inert material indistinguishable from
active treatment
Placebo effect: tendency to report favourable
response regardless of physiological efficacy
• Placebo is used as blinding procedure
89
BY Lemma D. (Assistant Prof. of Biostatistics)
Analysis of experimental studies
==== Two types
1. Intent to treat/ones randomized then analyzed/treatment assignment analysis
– All participants randomized will be considered for analysis weather or not
they take full treatment coarse.
- It answers treatment effectiveness – how many of the participant assigned to
treatment group or placebo group develop the outcome of interest to the
study
2. Efficacy analysis – the analysis base only on participant take the whole treatment
coarse or comply
- It answers the question of treatment efficacy – how many of the participants
who take full dose of treatment was cured/develop the outcome under study
90
BY Lemma D. (Assistant Prof. of
Biostatistics) 90
What is the advantage of an intent-to-treat analysis over
efficacy analysis?
o First, it preserves the benefits of randomization (it preserves baseline
comparability of the groups for known and unknown confounders)
o Second, it maintains the statistical power of the original study
population
o Third, because good and poor compliers differ from one another on
important prognostic factors, it helps ensure that the study results are
unbiased
91
BY Lemma D. (Assistant Prof. of
Biostatistics) 91
Example
• Investigator wants to know the effectiveness of new drug “A”
therapeutic effect in treating p. falciparum over the previous
coartem. He randomly allocate 80 malaria patients to treatment
group and 80 malaria patients to control/coartem/ group. Finally
he found good prognosis in 40 patients who took new drug ”A”
and in 10 patents who took previous coartem.
1. What type of study was conducted
2. Create two-by-two table
3. What is the appropriate measure of association
4. Calculate and interpret the result
5. Test a hypothesis which depicts there is no prognosis difference
between drug “A” and the coartem
92
BY Lemma D. (Assistant Prof. of
Biostatistics) 92
2.Measures of association
BY Lemma D. (Assistant Prof. of Biostatistics) 93
2X2 table
Disease
Yes (+) No (+) Total
Exposure Yes (+) a b a+b
No (+) c d c+d
Total a+c b+d a+b+c+d
94
BY Lemma D. (Assistant Prof. of Biostatistics)
Cells
A= Exposed, and diseased
B= Exposed, Not diseased
C= Not exposed, diseased
D= Not exposed, Not diseased
95
Marginal totals
a+b= Exposed
c+d= Non-exposed
a+c= Diseased
b+d= Non-diseased
Grand total
n = a+b+c+d
BY Lemma D. (Assistant Prof. of Biostatistics)
Relative risk (RR)
 Expresses risk of developing a diseases in exposed group (a + b)
as compared to non-exposed group (c + d)
RR= Incidence (risk) among exposed
Incidence (risk) among non-exposed
RR= a/(a+b)
c/(c+d)
96
BY Lemma D. (Assistant Prof. of Biostatistics)
Interpretation of relative risk
What does a RR of 2 mean?
Risk in exposed =RRX Risk in non-exposed
RR of 2 means
Risk in exposed=2X Risk in non-exposed
Thus a relative risk of 2 means the exposed group is two times
at a higher risk when compared to non-exposed
97
Strength of association
- High if RR>3
- Moderate if RR is between 1.5 & 2.9
- Weak if RR is between 1.2 & 1.4
BY Lemma D. (Assistant Prof. of Biostatistics)
Odds ratio (OR)
 Odds ratio is the ratio of odds of exposure among
diseased to odds of exposure among non-diseased
 Odds of an event E is the ratio of probability of the
event to its complement
Odds=P(E)/P(E’)=P(E)/(1-P(E))
98
BY Lemma D. (Assistant Prof. of Biostatistics)
Odds ratio…
Odds of exposure among exposed=a/c
Odds of exposure among non-diseased=b/d
OR = Odds of exposure among diseased
Odds of exposure among non-diseased
OR= (a/c)/(b/d)
OR= ad/bc (it is also called cross-product ratio)
Interpretation of OR is the same as that of RR
99
BY Lemma D. (Assistant Prof. of Biostatistics)
Odds ratio…
 RR can be best estimated by OR if the following conditions are
fulfilled
1. Controls are representative of general population
2. Selected cases are representative of all cases
3. The disease is rare
100
BY Lemma D. (Assistant Prof. of Biostatistics)
Absolute Measures of Risk
oAbsolute risk/attributable risk/risk difference: a measure of
association indicating ;
oAbsolute difference of diseases in exposed group than unexposed
group
=== assuming the association between the exposure and
disease is causal
oIs also called as excess risk of developing diseases among exposed
groups
101
BY Lemma D. (Assistant Prof. of
Biostatistics) 101
Attributable Risk (AR)
AR indicates how much of the risk is due to /attributable/ to the
exposure
Quantifies the excess risk in the exposed that can be attributable
to the exposure by removing the risk of the disease occurred due
to other causes
AR= Risk (incidence) in exposed- Risk (incidence) in non-
exposed
Attributable risk is also called risk difference
102
AR= a/(a+b) - c/(c+d)
BY Lemma D. (Assistant Prof. of Biostatistics)
Interpreting AR
What does attributable risk of 10 mean?
10 of the exposed cases are attributable to the exposure
By removing the exposure one can prevent 10 cases from
getting the disease
103
BY Lemma D. (Assistant Prof. of Biostatistics)
Attributable risk percent (AR%)
Estimates the proportion of disease among the exposed that is
attributable to the exposure
The proportion of the disease in the exposed that can be
eliminated by eliminating the exposure
104
AR%= (Risk in exposed – Risk in non-exposed)X100%
Risk in exposed
BY Lemma D. (Assistant Prof. of Biostatistics)
Interpretation of AR%
What does AR% of 10% mean?
10% of the disease can be attributed to the exposure
10% of the disease can be eliminated if we avoid the
exposure
105
BY Lemma D. (Assistant Prof. of Biostatistics)
Population Attributable Risk (PAR)
Estimates the rate of disease in total population that
is attributable to the exposure
106
PAR = Risk in population – Risk in unexposed
PAR = ARX prevalence rate of exposure
BY Lemma D. (Assistant Prof. of Biostatistics)
Population attributable risk percent (PAR%)
Estimates the proportion of disease in the study
population that is attributable to exposure and thus
could be eliminated if the exposure were eliminated
107
PAR%= Risk in population – Risk in unexposed X 100
Risk in population
PAR%= AR%*proportion of exposed cases
PAR%(case control) = Prevalence of exposure in a population(OR-1) x 100
Prevalence of exposure in a population(OR-1)+ 1
BY Lemma D. (Assistant Prof. of Biostatistics)
Possible outcomes in studying the relationship
between exposure & disease
1. No association
RR=1
AR=0
2. Positive association
RR>1
AR>0
3. Negative association
RR<1 (fraction)
AR<0 (Negative)
108
BY Lemma D. (Assistant Prof. of Biostatistics)
Risk Vs Preventive factors
A risk factor is any factor positively associated with a disease
(RR>1)
It is associated with an increased occurrence of a disease
A preventive factor is any factor negatively associated with a
disease (RR<1)
It is associated with a decreased occurrence of a disease
Risk and preventive factors may (not) amenable to change
(e.g. Smoking, age)
109
BY Lemma D. (Assistant Prof. of Biostatistics)
Test of significance/Chi-square statistics
Chi-square tests whether there is an association between two
categorical variables
- Ho: There is no association between row & column variables
- Ha: There is an association between row and column variables
Chi-square statistic has a degree of freedom (r-1)(c-1), where r is
number of rows & c number of columns
110
BY Lemma D. (Assistant Prof. of Biostatistics)
Chi-Square…
Χ 2= Σ (O - E)2
E
O: Observed cells
E: Expected cells
Expected value = (Row total)X(Column total)
Grand total
For a 2X2, table
Χcal 2 = (/ad-bc/-n/2)2n
(a+b)(a+c)(c+d)(b+d)
111
BY Lemma D. (Assistant Prof. of Biostatistics)
Importance of Chi-square
If the calculated chi-square value is greater than the
critical or P<0.05 we say that there is association
Chi-square statistics tells only whether there is
association. It doesn’t tell us how much strong an
association is.
112
BY Lemma D. (Assistant Prof. of Biostatistics)
Example
Table 1: data from a cohort study of measles vaccination and measles
case among childrens age less than 5 years
Measles
Yes No Total
Measles vaccination
Yes 27 455 482
No 77 1831 1908
Total 104 2286 2390
113
BY Lemma D. (Assistant Prof. of
Biostatistics) 113
Calculate
 AR
- AR = Ie - Io
- AR=27/482 – 77/1908 = 0.01566 = 1566/105
- Thus, the excess occurrence of measles among non vaccinated children attributable to
their non vaccination is 1566 per 100,000.
 AR%
- AR% = AR x 100 = (Ie – Io) x 100
Ie Ie
- AR% = 1566/105 x 1OO = 27.96%
27/482
- If non vaccination causes measles, about 28% of measles among under-five
children who didn’t vaccinated can be attributable to their non vaccination
and could therefore be eliminated if we could vaccinate our children.
114
BY Lemma D. (Assistant Prof. of
Biostatistics) 114
3. The PAR of measles associated with their non vaccination (Table 1) is:
PAR = IT - Io = 104/2390 – 77/1908 = 316/105/year
-Thus, if we vaccinate our children, the excess annual incidence rate of measles
that could be eliminated among under-five children in this study is 316 per
100,000.
4. PAR% = PAR x 100
IT
= 316 x 100 = 7.3%
4351.5
- Thus, if non vaccination causes measles, about 7 percent of all measles cases in
the study population could be prevented if all were vaccinated.
115
BY Lemma D. (Assistant Prof. of
Biostatistics) 115
Interpretation of measure of association
RR/ OR:
1. RR/ OR > 1, the exposure is risk
2. RR/ OR = 1, there is no association
3. RR/ OR < 1, the exposure is preventive
4. If confidence interval of RR/ OR includes the null (1),
then there is no statistical significant association
5. If confidence interval of RR/ OR is far from the null (1),
it is a sign of presence of statistical significant
association between exposure and outcome
116
BY Lemma D. (Assistant Prof. of
Biostatistics) 116
Interpretation…
AR/ PAR:
1. AR/ PAR > 0, the exposure is attributing/risk
2. AR/ PAR = 0, there is no attribution
3. AR/ PAR < 0, the exposure is preventive
117
In general the strength of association can be considered:
High - if the RR/OR is 3.0 or more
Moderate – if the RR/OR is from 1.5 to 2.9
Weak – if the RR/OR is from 1.2 to 1.4
BY Lemma D. (Assistant Prof. of
Biostatistics) 117
Self-Exercise
Suppose that a cohort study of 400 smokers and 600 non-
smokers documented the incidence of hypertension over a
period of 10 years.
The following table summarizes the data at the end of the study
period:
118
BY Lemma D. (Assistant Prof. of
Biostatistics) 118
Based on the above information, calculate and
interpret the following measures of
association:
1. Relative risk (RR)
2. Attributable risk (AR) and/or preventive fraction (PF)
3. Attributable risk percent (AR%)
4. Population attributable risk (PAR)
5. Population attributable risk percent (PAR%)
119
BY Lemma D. (Assistant Prof. of
Biostatistics) 119
Precaution!
“The attributable risk should be estimated
only when there is reasonable certainty that
the association is causal”
120
BY Lemma D. (Assistant Prof. of
Biostatistics) 120
3. Evaluation of Evidence
(Judgment of causality)
121
BY Lemma D. (Assistant Prof. of Biostatistics)
One of the major purposes of epidemiological studies is-
- Discovering the causes of disease
 Judge whether an association between exposure and a disease is
causal.
Cause of a disease is a factors which plays a role of producing a
particular disease.
- Sufficient Vs necessary causes
- A sufficient cause is not usually a single factor.
- A necessary cause, is a factor that is necessary (or with out
which) the disease doesn’t exist or occur
122
BY Lemma D. (Assistant Prof. of Biostatistics)
Concept of Cause
123
Exposure to
Bacteria
Tissue
invasion
Genetic Factor
Malnutrition
Crowded
Housing
Poverty
Susceptible
Host
Infection Tuberculosis
Risk factors for Tuberculosis Mechanism for tuberculosis
 The term “risk factor” is commonly used to describe factors that
are positively associated with the risk of development of a disease,
but that may not be sufficient to cause the disease.
BY Lemma D. (Assistant Prof. of Biostatistics)
Effect of a factor as a causation
1. Independent effect
• When a factor showed its effect directly.
• Effect seen without being distorted by a confounder.
124
Exposure Outcome
BY Lemma D. (Assistant Prof. of Biostatistics)
2. Confounding effect
• It is a variable that alters the relationship between an exposure
and an outcome variable
• It is usually independently associated with the dependent variable
• Measured effect of an exposure is distorted because of association
of the exposure with other factor (confounder) that influences the
outcome
125
Exposure Outcome
Confounder
BY Lemma D. (Assistant Prof. of Biostatistics)
3. Mediation
• Like a confounder, it is associated to both the exposure and the
outcome, but it is a path of action.
• It is distinguished by careful consideration of causal pathways.
• Knowledge of biological plausibility about the mediator is
necessary
126
Atherosclerosis
Cigarette fibrinogen
mediator
Exposure outcome
BY Lemma D. (Assistant Prof. of Biostatistics)
4. Interaction (effect modification)
• Two or more factors acting together to cause, prevent or control a
disease
• The effect of two or more causes acting together is often greater than
would be expected on the basis of summing the individual effects.
Example
• Smocking and asbestos dust Vs Lung cancer.
• Smoking having RR= 2.0 to develop lung cancer
• Exposure to asbestos having RR= 1.7 to develop lung cancer
• Combination of smoking & exposure to asbestos together having a
RR of > 3.7 to develop lung cancer is an interaction
127
BY Lemma D. (Assistant Prof. of Biostatistics)
Judgment of Causality
Scientific proof, is difficult to obtain; because :-
1. No ‘clean’ experimental environment.
- Difficult to test hypothesis with absolute certainty
2. Principally strong observational studies and interventional
studies are limited substantially through ethical
considerations and feasibility
 difficult to constitute proof
128
BY Lemma D. (Assistant Prof. of Biostatistics)
Possible explanations for observed association
•Chance
•Bias
•Confounding
The observed
association
between
exposure and
outcome can
be due to:
129
BY Lemma D. (Assistant Prof. of Biostatistics)
Accuracy of measurement
=  Accuracy = Validity + Precision
= Validity is the extent to which a measured value
actually reflects truth
• Internal validity
• External validity
= There are two
types of validity
130
BY Lemma D. (Assistant Prof. of Biostatistics)
Types of validity
Internal validity:
 Is the degree to which a measured value is true within the sample
External validity:
 Is the extent to which a measured value apply beyond the sample
 This is related to generalizability
Precision
Precision is the extent to which random error alters the
measurement of effects
131
BY Lemma D. (Assistant Prof. of Biostatistics)
Judgment of causality
Judgment of causality has two steps
1. Check whether the observed association between
exposure and disease is Valid (Rule out chance, bias and
confounding)
2. Check whether the observed association is causal (Bradford
hill criteria)
132
BY Lemma D. (Assistant Prof. of Biostatistics)
Role of chance
 The role of chance as an alternative explanation for an association
emerges from sampling variability
 Evaluation of the role of chance is mainly the domain of statistics
and involves
1. Test of statistical significance
2. Estimation of confidence interval
133
BY Lemma D. (Assistant Prof. of Biostatistics)
1. Test of statistical significance
P-value quantifies the degree to which chance accounts for observed association
P-value is the probability of obtaining a result at least as extreme as the observed
by chance alone
P<0.05/0.01 indicates statistical significance for medical research
A very small difference may be significant if you have large sample
A large difference may not achieve statistical significance if you have small sample
==== So
One can’t make a definite decision based on p-value only
134
BY Lemma D. (Assistant Prof. of Biostatistics)
2. Estimation of confidence interval
 Confidence interval represents the range within which true
magnitude of effect lies within a certain degree of assurance
 It is more informative than p-value because it reflects on
both the size of the sample , magnitude of effect and
direction of the effect
135
BY Lemma D. (Assistant Prof. of Biostatistics)
Role of bias
Bias is any systematic error in the design, conduct or analysis of
an epidemiologic study that results in an incorrect estimate of
association between exposure and disease
Unlike chance bias can’t be statistically evaluated
There are two major types of bias
1. Selection bias
2. Information bias
136
BY Lemma D. (Assistant Prof. of Biostatistics)
Selection bias
 Any systematic error that arises in the process of identifying the study
population
 It affects the representativeness of the study
 It occurs when there is a difference between sample and population with
respect to a variable
Examples of selection bias:
1. Volunteer bias
2. Non-response bias
3. Berkeson’s bias – hospitalized individuals may have more than one
condition
4. Healthy worker bias – study purely conducted on factory workers
5. Prevalence-incidence bias – missing cases due to death and recovery
137
BY Lemma D. (Assistant Prof. of Biostatistics)
Information/observation/bias
Any systematic error in the measurement of information on exposure or disease
Examples of information bias:
1. Interviewer bias/observer bias
2. Recall bias / Response bias
3. Social desirability bias
4. Placebo effect
5. Surveillance bias- In follow up studies, if we give more attention for those
exposed groups
6. Misclassification bias- differential/non differential
7. Hawthorn effect- if our data collection is based on observation-
individuals will act differently if they know they are being observed
8. Lead time bias
9. Length bias
138
BY Lemma D. (Assistant Prof. of Biostatistics)
Ways to minimize bias
• Choose appropriate study design
• Use strict and randomized sampling procedure
• Choose and stick to standardized questioner/ ascertaining
instrument
• Train and blind your interviewers;
• Ascertain outcome on a regular period of time (lose to follow up
minimized)
139
BY Lemma D. (Assistant Prof. of Biostatistics)
Role of confounding
140
 Confounding is the third variable that affect the true
association between exposure and outcome
 Age (the confounder) is strongly and independently
associated both with the outcome (wasting) and with the
exposure (feeding pattern)
 If left uncontrolled, the confounder would have produced a
spurious association between exposure and disease
Age
wasting
Feeding pattern
BY Lemma D. (Assistant Prof. of Biostatistics)
Confounding – The General Rule
• The confounding variable is a risk factor for the outcome
AND
• The confounding variable is associated with the exposure
BUT
• Is not an intermediate variable in the causal pathway
between exposure and outcome
141
BY Lemma D. (Assistant Prof. of Biostatistics)
Control of confounding variables
• Randomization
• Restriction
• Matching
During
designing
stage:
• Standardization
• Stratification/pooling
• Multivariate analysis
• Matched analysis
During
analysis
stage
142
BY Lemma D. (Assistant Prof. of Biostatistics)
A. In the Study Design
1. Randomization
 It is related to process of selection of study subjects
 Randomization is a process of selection of study subjects without looking to
the outcome or exposure status
 It is through simple random sampling methods
 When randomization is properly applied, possible confounders will be
distributed equally in each group
 Confounding effect could be eliminated
 It is rarely possible except in RCT
143
BY Lemma D. (Assistant Prof. of Biostatistics)
2. Restriction
 It is restricting to certain population (gender, certain age
group)
 Reduces eligible subject pool
 Requires narrow range on restriction variables
 Some restriction variables may actually be of scientific
interest e.g., gender
144
BY Lemma D. (Assistant Prof. of Biostatistics)
3. Matching
Technique that selects subjects so that the distribution of potential
confounders is similar in both groups
Can be used in any design but most often used in case/control studies
where ‘n’ is smaller
Matching can be expensive and time consuming
Can limit the ability of the study to investigate the matching factors
themselves
Only controls confounding of matching factors
145
BY Lemma D. (Assistant Prof. of Biostatistics)
2. In the Analysis
1. Stratification
It is method of analysis, that adjusts analysis in the presence
and absence of possible confounder
The process of analysis is done first in a combined (crudely),
then in the presence and at last in the absence (stratified) of
the possible confounding factor.
146
BY Lemma D. (Assistant Prof. of Biostatistics)
• Multiple linear regression model:
Y =  + 1 X1 + 2 X2 + 3 X3
assumes an ADDITIVE RISK association E  D
• Logistic regression model:
Log (Y / 1-Y) =  + 1 X1 + 2 X2 + 3 X3
assumes a MULTIPLICATIVE RISK association E  D
• Proportional Hazards - Survival regression model:
Log Incidence Rate (t) = (t) + 1 X1 + 2 X2 + 3 X3
assumes a MULTIPLICATIVE RISK association E  D at time (t)
147
2. Multivariable Adjustment
BY Lemma D. (Assistant Prof. of Biostatistics)
Types/effects of Confounding
• Negative
• Positive
• Qualitative
148
BY Lemma D. (Assistant Prof. of Biostatistics)
Positive Confounding
149
o Leads to appearance or strengthening of E/D association; exaggerates
effect of E on D.
o Causes magnitude of observed, crude E~D association to be more
extreme than true association.; observed RR (OR, IDR, etc) further
away from the null than true (adjusted) RR.
R
R adj
ˆ R
R crude
ˆ
R
R adj
ˆ
R
R crude
ˆ null
BY Lemma D. (Assistant Prof. of Biostatistics)
Negative Confounding
150
o Leads to apparent absence or weakening of E/D association;
underestimate effect of E on D.
o Causes magnitude of observed E~D association to be less extreme
than underlying association; observed RR/OR closer to the null than
true (adjusted) RR/OR.
R
R adj
ˆ
R
R crude
ˆ
R
R adj
ˆ R
R crude
ˆ null
BY Lemma D. (Assistant Prof. of Biostatistics)
Qualitative (Cross-over) Confounding
151
o An extreme case of confounding which leads to an inversion of direction
of association.
o An actual positive association between E and D appears to be a
negative association; an actual negative association between E and D
appears to be a positive association.
R
R adj
ˆ
R
R crude
ˆ
R
R adj
ˆ
R
R crude
ˆ
null
BY Lemma D. (Assistant Prof. of Biostatistics)
Establishing a Causal Association
• Once we found that chance, bias and confounding are all
determined to be unlikely, then we can conclude that a
valid statistical association exists.
• We should then apply judgment of causality
152
BY Lemma D. (Assistant Prof. of Biostatistics)
Bradford-Hill criteria
It is the statement of epidemiological criteria of a causal association
formulated in 1965 by Austin Bradford Hill (1897-1991)
This criteria include;
1. Strength of the Association;
The stronger the association the more likely that it is a causal.
Strong --- The more it is far from unity.
--- If RR/OR > 1.5 and < 0.5
Weak If RR/OR > 0.5 and < 1.5
153
BY Lemma D. (Assistant Prof. of Biostatistics)
Cont…
2. Consistency of relationship;
 The same association should be demonstrated by other studies
both with different methods, settings and different investigators.
 Special methods of combining of a number of well designed studies
exist, Meta Analysis.
 Meta analysis of RCT
 Meta analysis of observational studies
154
BY Lemma D. (Assistant Prof. of Biostatistics)
155
BY Lemma D. (Assistant Prof. of Biostatistics)
156
BY Lemma D. (Assistant Prof. of Biostatistics)
Cont…
3. Specificity of the association;
• Single exposure single disease
• This works more to most living organisms as causes.
Plasmodium Sp. Malaria
HIV AIDS
4. Temporal relationship
o It is crucial that the cause must precede the outcome
o This is usually problematic in cross-sectional and case-control
designs.
157
BY Lemma D. (Assistant Prof. of Biostatistics)
158
BY Lemma D. (Assistant Prof. of Biostatistics)
Cont…
5. Dose response relationship
• The risk of disease increases with increasing exposure to a
causal agent.
e.g. Cigarette smocking dose response
159
BY Lemma D. (Assistant Prof. of Biostatistics)
Cont…
6. Biological Plausibility:
 Hypothesis should be coherent with what is known about the
disease; both biologically and using laboratory.
 Knowledge about physiology, biology and pathology should
support the cause-effect relationship
160
BY Lemma D. (Assistant Prof. of Biostatistics)
Cont…
7. Study design;
It is most important to consider.
161
BY Lemma D. (Assistant Prof. of Biostatistics)
Cont…
8. Reversibility
• Removal of a possible cause results in a reduced disease risk
eg. Cessation of cigarette smoking is associated with
reduction in risk of Lung cancer relative to those who continue.
• If the cause leads to rapid irreversible changes (as in HIV infection),
then reversibility cannot be a condition for causality.
162
BY Lemma D. (Assistant Prof. of Biostatistics)
Cont…
Judging the evidence
• There are no completely reliable criteria for determining whether an
association is causal or not.
• In judging the different aspects of causation,
• The correct temporal relationship is essential,
• Once this has been found, weight should be given to
• Plausibility,
• Consistency, and
• dose-response relationship
163
BY Lemma D. (Assistant Prof. of Biostatistics)
Reading assignment
1. Conditional confounder
2. Residual confounder, how residual confounder?
3. Departure from additive
4. Departure from multiplication
5. Antagonist
6. Synergy
164
BY Lemma D. (Assistant Prof. of Biostatistics)

Epidemiological Study Design.pptx

  • 1.
    Epidemiological Study Design For BlendedMPH students, 2022 1 BY Lemma D. (Assistant Prof. of Biostatistics)
  • 2.
    Study design •Study designis the arrangement of conditions for the collection and analysis of data to provide the most accurate answer to a question in the most economical way. 2 BY Lemma D. (Assistant Prof. of Biostatistics)
  • 3.
    Types of Epidemiologicstudy designs I. Based on objective/focus/research question 1. Descriptive studies • Describe: who, when, where & how many 2. Analytic studies • Analyse: How and why 3 BY Lemma D. (Assistant Prof. of Biostatistics)
  • 4.
    Types… II. Based onthe role of the investigator 1. Observational studies • The investigator observes the nature • No intervention 2. Intervention/Experimental studies • Investigator intervenes • He has control over the situation 4 BY Lemma D. (Assistant Prof. of Biostatistics)
  • 5.
    Types… III. Based ontiming 1. One-time (one-spot) studies • Conducted at a point in time • An individual is observed at once 2. Longitudinal (Follow-up) studies • Conducted in a period of time • Individuals are followed over a period of time 5 BY Lemma D. (Assistant Prof. of Biostatistics)
  • 6.
    Types… IV. Based onthe direction of follow-up/data collection 1. Prospective • Conducted forward in time 2. Retrospective • Conducted backwards in time 6 BY Lemma D. (Assistant Prof. of Biostatistics)
  • 7.
    Types… V. Based onthe type of data they generate 1. Qualitative studies • Generate contextual data • Also called exploratory studies 2. Quantitative studies • Generate numerical data • Also called explanatory studies 7 BY Lemma D. (Assistant Prof. of Biostatistics)
  • 8.
    Types… VI. Based onstudy setting 1. Community-based studies • Conducted in communities 2. Institution-based studies • Conducted in institution settings 3. Laboratory-based studies • Conducted in major laboratories 8 BY Lemma D. (Assistant Prof. of Biostatistics)
  • 9.
    Study Design Sequence Casereports Case series Descriptive epidemiology Analytic epidemiology Clinical trials Animal study Lab study Cohort Case- control Cross- sectional Hypothesis formation Hypothesis testing BY Lemma D. (Assistant Prof. of Biostatistics) 9
  • 10.
    Descriptive Studies Case-control Studies CohortStudies Develop hypothesis Investigate it’s relationship to outcomes Define it’s meaning with exposures Clinical trials Test link experimentally Increasing Knowledge of Disease/Exposure BY Lemma D. (Assistant Prof. of Biostatistics) 10
  • 11.
    Descriptive study designs 11 BYLemma D. (Assistant Prof. of Biostatistics)
  • 12.
    Descriptive Studies Person Time Cases 0 5 10 15 20 25 12 3 4 5 6 7 8 9 10 0 200 400 600 800 1000 1200 0-4 '5-14 '15- 44 '45- 64 '64+ Age Group Who? Where? When? BY Lemma D. (Assistant Prof. of Biostatistics) 12
  • 13.
    Characteristics of Persons “Whois getting the disease?”  Age, sex, religion, socio-economic status, race • Young Vs old, males Vs females, rich vs poor, more educated vs less educated, black Vs white, etc BY Lemma D. (Assistant Prof. of Biostatistics) 13
  • 14.
    Characteristics of Place “Where are the rates of disease highest/ lowest?” • Urban vs rural, some regions more affected than others? • National vs international? • High altitude or low altitude? • Polluted areas or unpolluted areas? • Mountainous vs valley • Adequate rainfall or little rainfall areas?  Differences in frequency of diseases are related to variations in climate, altitude, topography, geology and in general environment. BY Lemma D. (Assistant Prof. of Biostatistics) 14
  • 15.
    Characteristics of Time “Whendoes the disease occur commonly/ rarely?” Was there a sudden increase over a shorter period of time?  Is the problem greater during the rainy or dry season?  “Is the frequency of the disease now different from the corresponding frequency in the past?” Is the problem gradually increasing/ decreasing? BY Lemma D. (Assistant Prof. of Biostatistics) 15
  • 16.
    Uses of DescriptiveStudies Describe the pattern of disease occurrence Describe the problem in terms of person, place and time Generate numbers of events (frequency) Help to calculate ratio, proportion and rates Program planning / resource allocation Generate hypothesis to be studied by analytic methods BY Lemma D. (Assistant Prof. of Biostatistics) 16
  • 17.
    Categories of descriptiveepidemiological studies 1. Population as a study subject o Correlational /ecological studies 2. Individual as study subjects o Case report / Case series o Cross-sectional survey BY Lemma D. (Assistant Prof. of Biostatistics) 17
  • 18.
    What is anecological study? An ecological study is an epidemiological study in which the unit of analysis is a population rather than an individual. - For instance, an ecological study may look at the association between smoking and lung cancer deaths in different countries. • An ecological study is appropriate for initial investigation of causal hypothesis. • Uses data from entire population to compare disease frequencies – • 1. Between different population during the same period of time, or • 2. In the same population at different points in time. • Does not provide individual data, rather presents average exposure level in the community. • Cause could not be ascertained. BY Lemma D. (Assistant Prof. of Biostatistics) 18
  • 19.
    Examples----- • Group-level measuresinclude the rate of cancer incidence, the mean level of hypertension, the average sunlight exposure at specific geographic location compared between two communities • Average per capita fat consumption and breast cancer rates compared between two communities. • Comparing incidence of dental cares in relation to fluoride content of the water among towns in the rift valley. BY Lemma D. (Assistant Prof. of Biostatistics) 19
  • 20.
    0 2000 4000 6000 8000 10000 12000 14000 16000 18000 2006 2008 20102012 2014 percapita fat consumption and breast cancer death per capita fat consumption average breast cancer death 0 2000 4000 6000 8000 10000 12000 14000 16000 18000 0 200 400 600 800 Number of ITN distributed Reported malaria morbidity What type of ecological study was conducted? BY Lemma D. (Assistant Prof. of Biostatistics) 20
  • 21.
    Ecological analyses areonly of value when the groups or communities being compared are relatively heterogeneous in their mean levels of exposure to outcome variable.  For this reason, they have been used most extensively for between-country rather than within-–country comparisons.  Within–country comparisons: ex: The People's Republic of China -- because there are wide variations in disease rates from one region to another, accompanying substantial differences in culture, behavior and lifestyle. BY Lemma D. (Assistant Prof. of Biostatistics) 21
  • 22.
    More examples BY LemmaD. (Assistant Prof. of Biostatistics) 22
  • 23.
    Strength • Can bedone quickly and inexpensively, often using available data. • May be best design to study health effects of environmental exposures, eg • Do heat waves increase death rate? • Does soft drinks increase heart disease? • Do economic recessions increase suicide rate? • Such questions only sensibly addressed at population (or community) level BY Lemma D. (Assistant Prof. of Biostatistics) 23
  • 24.
    Limitations • Beyond thelogical problem of the ecological fallacy, there are methodological difficulties in ecological studies, particularly when used to draw inferences at the level of the individual. • Confounding is a particular problem in ecological studies of diet and diseases associated with industrialization. • Between-country comparisons may be restricted by the absence of comparable data, usually on dietary intake. • Within-country comparisons may yet be restricted by the limited size of the population in each region and the consequent instability in rates, as well as by homogeneity of exposures within the country as a whole. BY Lemma D. (Assistant Prof. of Biostatistics) 24
  • 25.
    Types of Descriptive…Cont’d • Case report or case series • Detailed report of a single patient (case report) or a group of patients (case series) with a given disease Used for • Document unusual medical occurrences • Gives the first clues in the identification of new disease and adverse effects of exposures • An important link between clinical medicine and epidemiology • Most common types of studies BY Lemma D. (Assistant Prof. of Biostatistics) 25
  • 26.
    Case Report • Casereport is like storytelling in medicine • Should be clear, short and useful for its purpose • Is the written form of the verbal presentation of a case history • Case reports are the lowest cadre in the world of evidence-based medicine • Can be powerful and instructional BY Lemma D. (Assistant Prof. of Biostatistics) 26
  • 27.
    Possible Reasons Fora Case Report • Very rare disease • Association of diseases • Rare presentations of more common diseases • Outcome of a novel treatment • Reporting a particular outcome of a case management • Mistakes, complications and lessons learned • A new disease entity BY Lemma D. (Assistant Prof. of Biostatistics) 27
  • 28.
    Case series o Case-series- usually a coherent and consecutive set of cases of a disease (or similar problem) which derive from either the practice of one or more healthcare professionals or a defined healthcare setting e.g. a hospital or family practice. o A case series is, effectively, a register of cases. o Analyse cases together to learn about the disease. o Clinical case series are of value in epidemiology. o Studying symptoms and signs. o Creating case definitions. o Clinical education, audit and research. BY Lemma D. (Assistant Prof. of Biostatistics) 28
  • 29.
    Case Report Case Series Descriptive EpidemiologyStudy One case of unusual findings Multiple cases of findings Population-based cases with denominator BY Lemma D. (Assistant Prof. of Biostatistics) 30
  • 30.
    • Case reports/caseseries Advantages • Simple, quick, inexpensive • Formulate hypothesis  Disadvantages • Can’t be used to test hypotheses • Based on the experience of one or few people (small sample size) • Lacks comparison group BY Lemma D. (Assistant Prof. of Biostatistics) 31
  • 31.
    Individual Assignment Discuss thefollowing concepts Cross level inference Macroscopic generalization Regression dilution bias Ecological fallacy/bias Atomistic fallacy/bias BY Lemma D. (Assistant Prof. of Biostatistics) 32
  • 32.
    Cross sectional study 33 BYLemma D. (Assistant Prof. of Biostatistics)
  • 33.
    Timing of analyticalstudy BY Lemma D. (Assistant Prof. of Biostatistics) 34
  • 34.
    Cross-sectional Study • Datacollected at a single point in time • Describes associations • Prevalence Cross-sectional studies are useful to generate a hypothesis rather than to test it For factors that remain unaltered overtime (e.g., sex, race, blood group) it can produce a valid association A “Snapshot” BY Lemma D. (Assistant Prof. of Biostatistics) 35
  • 35.
    Cross-sectional/design Comparison groups areformed after data collection The object of comparison are prevalence of exposure or disease Groups are compared either by exposure or disease status Cross-sectional studies are also called prevalence studies Cross-sectional studies are characterized by concurrent classification of groups 36 BY Lemma D. (Assistant Prof. of Biostatistics)
  • 36.
    37 Defined population Collect dataon exposure and disease status Exposed Have disease Exposed Have no disease Not exposed Have disease Not exposed Have no disease Study begins BY Lemma D. (Assistant Prof. of Biostatistics)
  • 37.
    Analysis/Measure of association Oddsratio Odds of disease among exposed group Odds of disease among non exposed Odds of exposure among disease group Odds of exposure among non diseased group Disease condition D+ D- Exposure(D+) a B Exposure(D-) c d 38 BY Lemma D. (Assistant Prof. of Biostatistics)
  • 38.
    Cross-sectional… Types of cross-sectionalstudies 1. Single cross-sectional studies • Determine single proportion/mean in a single population at a single point in time 2. Comparative cross-sectional studies • Determine two proportions/means in two populations at a single point in time 3. Time-series cross-sectional studies • Determine a single proportion/mean in a single population at multiple points in time 39 BY Lemma D. (Assistant Prof. of Biostatistics)
  • 39.
    Cross-sectional… Advantages of cross-sectionalstudies • Less expensive • Less time consuming • Provides more information • Describes well • Generates hypothesis 40 BY Lemma D. (Assistant Prof. of Biostatistics)
  • 40.
    Cross-sectional… Limitations of cross-sectionalstudies • Antecedent-consequence uncertainty “Chicken or egg dilemma” • Data dredging leading to inappropriate comparison • More vulnerable to bias • Impractical for rare diseases and rare exposure – because we need to take very large sample size • Miss diseases still in latent period • Recall of previous exposure may be difficult 41 BY Lemma D. (Assistant Prof. of Biostatistics)
  • 41.
    Case control study BYLemma D. (Assistant Prof. of Biostatistics) 42
  • 42.
    Case-control studies • Subjectsare selected with respect to the presence (cases) or absence (controls) of disease, and then inquiries are made about past exposure • We compare diseased (cases) and non-diseased (controls) to find out the level of exposure • Exposure status is traced backward in time 43 BY Lemma D. (Assistant Prof. of Biostatistics)
  • 43.
    44 BY Lemma D.(Assistant Prof. of Biostatistics) 44
  • 44.
    Case-control… Steps in conductingcase-control studies I. Define who is a case • Establish strict diagnostic criteria • All who fulfil the criteria will be “case population • Those who don’t fulfil will be “control population” II. Select a sample of cases from case population • This sample must be representative of the case population 45 BY Lemma D. (Assistant Prof. of Biostatistics)
  • 45.
    Case-control… Sources of cases 1.Hospitals (Health institution) • Cost-less • Bias-more 2. Population (Community) • Cost-more • Bias-less 46 BY Lemma D. (Assistant Prof. of Biostatistics)
  • 46.
    Case-control… III. Select controlsfrom a control population • Should be representative of control population • Should be similar to cases except outcome • Should be selected by the same method as cases Sources of controls 1. Hospital (Health institution) controls • Readily available • Low recall bias • More cooperative 47 BY Lemma D. (Assistant Prof. of Biostatistics)
  • 47.
    Case-control… However, hospital controlsare • Less representative • More confounding 2. Population (community) controls • More representative • Less confounding • Costly and time consuming • More recall bias • Less cooperative 48 BY Lemma D. (Assistant Prof. of Biostatistics)
  • 48.
    Case-control… IV. Measure thelevel of exposure in cases & controls • Review or interview for exposure status • Use same method for case and controls V. Compare the exposure between cases & controls • Prepare 2X2 table • Calculate OR • Perform statistical tests 49 BY Lemma D. (Assistant Prof. of Biostatistics)
  • 49.
    Comparison is madeprimarily by estimating the relative risk as computed by the odds ratio. Odds is defined as the probability that an event will occur divided by the probability that it will not occur. In a case–control study, we typically calculate the odds of exposure in cases (a/b) compared to the odds of exposure in non-cases(c/d). Two possible outcomes for an exposed person: case or not Odds=a/b Two possible outcomes for an unexposed person: case or not Odds=c/d Analysis of case-control studies 50 BY Lemma D. (Assistant Prof. of Biostatistics) 50
  • 50.
    Analysis 2X2 51 Cases ControlsTotal Exposed a b a+b Unexposed c d c+d Total a+c b+d a+b+c+d Odds of exposure in cases = a/c Odds of exposure in controls = b/d Odds Ratio = a/c = ad b/d bc BY Lemma D. (Assistant Prof. of Biostatistics) 51
  • 51.
    52 BY Lemma D.(Assistant Prof. of Biostatistics)
  • 52.
    53 BY Lemma D.(Assistant Prof. of Biostatistics)
  • 53.
    54 Interpretation of results •Odds ratio of > 1 means odds of exposure for cases is higher than for controls – exposure is a risk factor • Odds ratio of < 1 means odds of exposure for cases is lower than for controls – exposure is preventive • Odds ratio =1 means the odds of exposure is the same in cases and controls – No association between exposure and outcome BY Lemma D. (Assistant Prof. of Biostatistics) 54
  • 54.
    Case-control… Types of case-controlstudies I. Based on case identification 1. Retrospective case-control • Uses prevalent cases • Increased sample size • Difficult to establish temporal sequence • Useful for rare outcomes 55 BY Lemma D. (Assistant Prof. of Biostatistics)
  • 55.
    Case-control… 2. Prospective case-control •Uses incident cases • Establish temporal sequence • Recall is not a serious problem • Records are easily obtainable 56 BY Lemma D. (Assistant Prof. of Biostatistics)
  • 56.
    Case-control… II. Based onmatching  Matching: Relating cases and controls with respect to certain variable 1. Matched case-control studies 2. Unmatched case-control studies 57 BY Lemma D. (Assistant Prof. of Biostatistics)
  • 57.
    Discuss • Nested case-controlstudy BY Lemma D. (Assistant Prof. of Biostatistics) 58
  • 58.
    Common bias incase-control studies o Information bias - recall bias - non-response bias o Selection bias - using different criteria to select cases and controls - the probability of selecting a real case and control 59 BY Lemma D. (Assistant Prof. of Biostatistics) 59
  • 59.
    Case-control… Advantages of case-controlstudies Optimal for evaluation of rare diseases Examines multiple factors of a single disease Quick and inexpensive Relatively simple to carry out Guarantee the number of people with disease 60 BY Lemma D. (Assistant Prof. of Biostatistics)
  • 60.
    Case-control… Limitations of case-controlstudies o Inefficient for evaluation of rare exposure o Can’t directly compute risk o Difficult to establish temporal sequence(retrospective case control) o Determining exposure will often rely on memory 61 BY Lemma D. (Assistant Prof. of Biostatistics)
  • 61.
    Design the followingcase-control study use picture • Determinants of Abortion among Clients Coming for Abortion Service at HF Hospital, Ethiopia: A Case-Control Study 62 BY Lemma D. (Assistant Prof. of Biostatistics)
  • 62.
    Cohort study 63 BY LemmaD. (Assistant Prof. of Biostatistics)
  • 63.
    Definition of cohortstudies  A cohort study is an observational research design which begins when a cohort initially free of disease (outcome of interest) are classified according to a given exposure and then followed (traced) over time  The investigator compares whether the sub-sequent development of a new cases of disease (other outcome of interest) differs between the exposed and non-exposed cohorts For example if a researcher want to investigate weather drinking more than five cup of coffee/exposure per day in pregnancy resulted in fetal abnormality/outcome BY Lemma D. (Assistant Prof. of Biostatistics) 64
  • 64.
    Time Population at risk People without the outcome Pregnant mothers Exposed Drink more thanfive cup of Coffee per day Not Exposed Not drink any coffee Diseased Give abnormal baby Not diseased Give normal baby Diseased Give abnormal baby Not diseased Give normal baby Direction of enquiry Design of cohort studies = == > If we want to know weather exposure to drinking coffee during pregnancy will result in abnormal birth 65
  • 65.
    Basic futures ofcohort studies “Disease free” or “without outcome” population at entry Selected by exposure status rather than outcome status Exposure example – deriving after drinking alcohol - sleeping without using bed net - feeding kids without washing our hands - not using glove during injection Follow up is needed to determine the incidence of the outcome Compares incidence rates among exposed against non-exposed groups 66 BY Lemma D. (Assistant Prof. of Biostatistics) 66
  • 66.
    Cohort… • Two typesof cohort studies 1. Prospective (classical) • Outcome hasn’t occurred at the beginning of the study • It is the commonest and more reliable 2. Retrospective (Historical) • Both exposure and disease has occurred before the beginning of the study • Faster and more economical • Data usually incomplete and in accurate 67 BY Lemma D. (Assistant Prof. of Biostatistics)
  • 67.
    Cohort… Steps in conductingcohort studies 1. Define exposure 2. Select exposed group 3. Select non-exposed group 4. Follow and collect data on outcome 5. Compare outcome b/n exposed & non-exposed 68 BY Lemma D. (Assistant Prof. of Biostatistics)
  • 68.
    Follow up periodof cohort studies oThe follow-up is the most critical and demanding part of a cohort study oLost to follow-up should be kept to an absolute minimum (< 10- 15%) oChanges in the level of exposure to key risk factors, after the initial survey and during the follow-up period, are a potentially important source of random bias 69 BY Lemma D. (Assistant Prof. of Biostatistics) 69
  • 69.
    Ascertainment of outcomeof interest • The aim of good case ascertainment is to ensure that the process of finding cases, whether deaths, illness episodes, or people with a characteristic, is as complete as possible • Must have a firm outcome criteria and standard diagnostic procedure which are equally applied for exposed and non-exposed individuals o Any outcome measurement should be done equally both to the exposed and non-exposed groups 70 BY Lemma D. (Assistant Prof. of Biostatistics) 70
  • 70.
    Analysis of cohortstudies oThe primary objective of the analysis of cohort study data is to compare disease occurrence in the exposed and unexposed groups o It is a direct measurement of a risk to develop the outcome of interest oCalculation and comparison of rates of the incidence of the outcome for exposed and non-exposed subjects using relative risk (RR) as measure of association 71 BY Lemma D. (Assistant Prof. of Biostatistics) 71
  • 71.
    Relative Risk… incidence ofa disease among exposed a/(a+b) incidence of a disease among non-exposed c/(c+d) a b c d RR = Disease Yes (+) No (-) Exposure Yes (+) No (-) . a . RR = a + b . . c . c + d a + b c + d 72 BY Lemma D. (Assistant Prof. of Biostatistics) 72
  • 72.
    Strength of cohortstudies: oParticularly efficient when exposure is rare oCan examine multiple effects of a single exposure oMinimize bias in outcome measurement if prospective oAllows direct measurement of incidence (risk) oCan elucidate temporal relationship between exposure and outcome of interest (if prospective ) BY Lemma D. (Assistant Prof. of Biostatistics) 73
  • 73.
    Limitation of cohortstudies: oCostly and time consuming if disease is rare and/or long latency period (if prospective) oValidity of the results can be seriously affected by loss to follow up (if prospective) oRelatively statistically inefficient unless disease is common (need large sample size) oIf retrospective, requires availability of adequate records oExposure status may change during the course of study BY Lemma D. (Assistant Prof. of Biostatistics) 74
  • 74.
    Discuss • Case Cohortstudies BY Lemma D. (Assistant Prof. of Biostatistics) 75
  • 75.
    Experimental study 76 BY LemmaD. (Assistant Prof. of Biostatistics)
  • 76.
    Experimental studies o Individualsare allocated in to treatment and control groups by the investigator o ” Investigators must formulate a hypothesis before launching an experimental study - Ho: New drug “A” can not threat vivax malaria - Ha : New drug “A” can threat vivax malaria • If properly done, experimental studies can produce high quality data • They are the gold standard study design 77 BY Lemma D. (Assistant Prof. of Biostatistics)
  • 77.
    78 Design of experientialstudy BY Lemma D. (Assistant Prof. of Biostatistics) 78
  • 78.
    Study groups ininterventional studies The comparison groups in intervention study are known as the intervention group and the control group oThe intervention group receives therapeutic or preventive intervention such as health education, diet and physical exercise etc… oThe control group shall be offered the best known alternative or placebo activity with no known effect on the outcome variable 79 BY Lemma D. (Assistant Prof. of Biostatistics) 79
  • 79.
    Example Question: Does salteddrinking water affect blood pressure (BP) in mice? Experiment: 1. Provide a mouse with water containing 1% NaCl and plain water 2. Wait 14 days. 3. Measure BP. 80 BY Lemma D. (Assistant Prof. of Biostatistics) 80
  • 80.
    Comparison/control Good experiments arecomparative. • Compare BP in mice fed salt water to BP in mice fed plain water. Ideally, the experimental group is compared to concurrent controls (rather than to historical controls). 81 BY Lemma D. (Assistant Prof. of Biostatistics) 81
  • 81.
    Experimental… Experimental studies canbe 1. Therapeutic trials • Conducted on patients • To determine the effect of treatment on disease 2. Preventive trials/prophylactic trial • Conducted on healthy people • To determine the effect of prevention on risk(drug for prevention, health education, healthy diet ) 3. Safety trial - Conducted on healthy or patients - To determine the safety issue of the treatment or preventive drug 82 BY Lemma D. (Assistant Prof. of Biostatistics)
  • 82.
    Experimental… Three different waysof classifying intervention studies I. Based on population studies • Clinical trial: on patients in clinical settings(treatment is used as an exposure and recovering (survival) from a disease is the outcome) • Field trial: used in testing medicine for preventive purpose and the subjects are healthy people. During filed trial health promotion (preventive interventions) are used as an exposure and disease occurrence is used as an outcome. Eg; vaccine trial • Community trial: the unite of study is the community not an individual(Fluoridation of water to prevent dental caries) 83 BY Lemma D. (Assistant Prof. of Biostatistics)
  • 83.
    Experimental… II. Based ondesign • Uncontrolled trial: no control (self-control) • Non-randomized controlled: allocation not random • Randomized control: Allocation random III. Based on objective • Phase I: to determine toxic effect • Phase II: to determine therapeutic effect • Phase III: to determine applicability 84 BY Lemma D. (Assistant Prof. of Biostatistics)
  • 84.
    Steps of interventionalstudies 1. Selection of study population 2. Allocation of treatment regimen 3. Maintenance and assessment of compliance 4. Ascertainment of outcomes 5. Analysis & conclusion of experimental studies 85 BY Lemma D. (Assistant Prof. of Biostatistics)
  • 85.
    Experimental… Challenges in interventionstudies • Ethical issues • Harmful treatment shouldn’t be given • Useful treatment shouldn’t be denied • Feasibility issues • Getting adequate subjects • Achieving satisfactory compliance • Cost issues • Experimental studies are expensive 86 BY Lemma D. (Assistant Prof. of Biostatistics)
  • 86.
    Experimental… • The qualityof “Gold standard” in experimental studies can be achieved through • Randomization • Blinding • Placebo 87 BY Lemma D. (Assistant Prof. of Biostatistics)
  • 87.
    Experimental… 1. Randomization: randomallocation of study subjects in to treatment & control groups Advantage: Avoids bias & confounding Increases confidence on results 2. Levels of blinding • Non-blinded/open: All (the observer, study subjects and data analyst) know which intervention a patient is receiving (common in community trials). • Single blinded: The observer is aware but the study subjects is not aware of treatment assignment. • Double blinded: Neither the observer nor the study subjects is aware of treatment assignment • Triple blinded: The observer, study subjects and data analyst are not aware of treatment assignment. Advantage: Avoids observation bias 88 BY Lemma D. (Assistant Prof. of Biostatistics)
  • 88.
    Experimental… Placebo: an inertmaterial indistinguishable from active treatment Placebo effect: tendency to report favourable response regardless of physiological efficacy • Placebo is used as blinding procedure 89 BY Lemma D. (Assistant Prof. of Biostatistics)
  • 89.
    Analysis of experimentalstudies ==== Two types 1. Intent to treat/ones randomized then analyzed/treatment assignment analysis – All participants randomized will be considered for analysis weather or not they take full treatment coarse. - It answers treatment effectiveness – how many of the participant assigned to treatment group or placebo group develop the outcome of interest to the study 2. Efficacy analysis – the analysis base only on participant take the whole treatment coarse or comply - It answers the question of treatment efficacy – how many of the participants who take full dose of treatment was cured/develop the outcome under study 90 BY Lemma D. (Assistant Prof. of Biostatistics) 90
  • 90.
    What is theadvantage of an intent-to-treat analysis over efficacy analysis? o First, it preserves the benefits of randomization (it preserves baseline comparability of the groups for known and unknown confounders) o Second, it maintains the statistical power of the original study population o Third, because good and poor compliers differ from one another on important prognostic factors, it helps ensure that the study results are unbiased 91 BY Lemma D. (Assistant Prof. of Biostatistics) 91
  • 91.
    Example • Investigator wantsto know the effectiveness of new drug “A” therapeutic effect in treating p. falciparum over the previous coartem. He randomly allocate 80 malaria patients to treatment group and 80 malaria patients to control/coartem/ group. Finally he found good prognosis in 40 patients who took new drug ”A” and in 10 patents who took previous coartem. 1. What type of study was conducted 2. Create two-by-two table 3. What is the appropriate measure of association 4. Calculate and interpret the result 5. Test a hypothesis which depicts there is no prognosis difference between drug “A” and the coartem 92 BY Lemma D. (Assistant Prof. of Biostatistics) 92
  • 92.
    2.Measures of association BYLemma D. (Assistant Prof. of Biostatistics) 93
  • 93.
    2X2 table Disease Yes (+)No (+) Total Exposure Yes (+) a b a+b No (+) c d c+d Total a+c b+d a+b+c+d 94 BY Lemma D. (Assistant Prof. of Biostatistics)
  • 94.
    Cells A= Exposed, anddiseased B= Exposed, Not diseased C= Not exposed, diseased D= Not exposed, Not diseased 95 Marginal totals a+b= Exposed c+d= Non-exposed a+c= Diseased b+d= Non-diseased Grand total n = a+b+c+d BY Lemma D. (Assistant Prof. of Biostatistics)
  • 95.
    Relative risk (RR) Expresses risk of developing a diseases in exposed group (a + b) as compared to non-exposed group (c + d) RR= Incidence (risk) among exposed Incidence (risk) among non-exposed RR= a/(a+b) c/(c+d) 96 BY Lemma D. (Assistant Prof. of Biostatistics)
  • 96.
    Interpretation of relativerisk What does a RR of 2 mean? Risk in exposed =RRX Risk in non-exposed RR of 2 means Risk in exposed=2X Risk in non-exposed Thus a relative risk of 2 means the exposed group is two times at a higher risk when compared to non-exposed 97 Strength of association - High if RR>3 - Moderate if RR is between 1.5 & 2.9 - Weak if RR is between 1.2 & 1.4 BY Lemma D. (Assistant Prof. of Biostatistics)
  • 97.
    Odds ratio (OR) Odds ratio is the ratio of odds of exposure among diseased to odds of exposure among non-diseased  Odds of an event E is the ratio of probability of the event to its complement Odds=P(E)/P(E’)=P(E)/(1-P(E)) 98 BY Lemma D. (Assistant Prof. of Biostatistics)
  • 98.
    Odds ratio… Odds ofexposure among exposed=a/c Odds of exposure among non-diseased=b/d OR = Odds of exposure among diseased Odds of exposure among non-diseased OR= (a/c)/(b/d) OR= ad/bc (it is also called cross-product ratio) Interpretation of OR is the same as that of RR 99 BY Lemma D. (Assistant Prof. of Biostatistics)
  • 99.
    Odds ratio…  RRcan be best estimated by OR if the following conditions are fulfilled 1. Controls are representative of general population 2. Selected cases are representative of all cases 3. The disease is rare 100 BY Lemma D. (Assistant Prof. of Biostatistics)
  • 100.
    Absolute Measures ofRisk oAbsolute risk/attributable risk/risk difference: a measure of association indicating ; oAbsolute difference of diseases in exposed group than unexposed group === assuming the association between the exposure and disease is causal oIs also called as excess risk of developing diseases among exposed groups 101 BY Lemma D. (Assistant Prof. of Biostatistics) 101
  • 101.
    Attributable Risk (AR) ARindicates how much of the risk is due to /attributable/ to the exposure Quantifies the excess risk in the exposed that can be attributable to the exposure by removing the risk of the disease occurred due to other causes AR= Risk (incidence) in exposed- Risk (incidence) in non- exposed Attributable risk is also called risk difference 102 AR= a/(a+b) - c/(c+d) BY Lemma D. (Assistant Prof. of Biostatistics)
  • 102.
    Interpreting AR What doesattributable risk of 10 mean? 10 of the exposed cases are attributable to the exposure By removing the exposure one can prevent 10 cases from getting the disease 103 BY Lemma D. (Assistant Prof. of Biostatistics)
  • 103.
    Attributable risk percent(AR%) Estimates the proportion of disease among the exposed that is attributable to the exposure The proportion of the disease in the exposed that can be eliminated by eliminating the exposure 104 AR%= (Risk in exposed – Risk in non-exposed)X100% Risk in exposed BY Lemma D. (Assistant Prof. of Biostatistics)
  • 104.
    Interpretation of AR% Whatdoes AR% of 10% mean? 10% of the disease can be attributed to the exposure 10% of the disease can be eliminated if we avoid the exposure 105 BY Lemma D. (Assistant Prof. of Biostatistics)
  • 105.
    Population Attributable Risk(PAR) Estimates the rate of disease in total population that is attributable to the exposure 106 PAR = Risk in population – Risk in unexposed PAR = ARX prevalence rate of exposure BY Lemma D. (Assistant Prof. of Biostatistics)
  • 106.
    Population attributable riskpercent (PAR%) Estimates the proportion of disease in the study population that is attributable to exposure and thus could be eliminated if the exposure were eliminated 107 PAR%= Risk in population – Risk in unexposed X 100 Risk in population PAR%= AR%*proportion of exposed cases PAR%(case control) = Prevalence of exposure in a population(OR-1) x 100 Prevalence of exposure in a population(OR-1)+ 1 BY Lemma D. (Assistant Prof. of Biostatistics)
  • 107.
    Possible outcomes instudying the relationship between exposure & disease 1. No association RR=1 AR=0 2. Positive association RR>1 AR>0 3. Negative association RR<1 (fraction) AR<0 (Negative) 108 BY Lemma D. (Assistant Prof. of Biostatistics)
  • 108.
    Risk Vs Preventivefactors A risk factor is any factor positively associated with a disease (RR>1) It is associated with an increased occurrence of a disease A preventive factor is any factor negatively associated with a disease (RR<1) It is associated with a decreased occurrence of a disease Risk and preventive factors may (not) amenable to change (e.g. Smoking, age) 109 BY Lemma D. (Assistant Prof. of Biostatistics)
  • 109.
    Test of significance/Chi-squarestatistics Chi-square tests whether there is an association between two categorical variables - Ho: There is no association between row & column variables - Ha: There is an association between row and column variables Chi-square statistic has a degree of freedom (r-1)(c-1), where r is number of rows & c number of columns 110 BY Lemma D. (Assistant Prof. of Biostatistics)
  • 110.
    Chi-Square… Χ 2= Σ(O - E)2 E O: Observed cells E: Expected cells Expected value = (Row total)X(Column total) Grand total For a 2X2, table Χcal 2 = (/ad-bc/-n/2)2n (a+b)(a+c)(c+d)(b+d) 111 BY Lemma D. (Assistant Prof. of Biostatistics)
  • 111.
    Importance of Chi-square Ifthe calculated chi-square value is greater than the critical or P<0.05 we say that there is association Chi-square statistics tells only whether there is association. It doesn’t tell us how much strong an association is. 112 BY Lemma D. (Assistant Prof. of Biostatistics)
  • 112.
    Example Table 1: datafrom a cohort study of measles vaccination and measles case among childrens age less than 5 years Measles Yes No Total Measles vaccination Yes 27 455 482 No 77 1831 1908 Total 104 2286 2390 113 BY Lemma D. (Assistant Prof. of Biostatistics) 113
  • 113.
    Calculate  AR - AR= Ie - Io - AR=27/482 – 77/1908 = 0.01566 = 1566/105 - Thus, the excess occurrence of measles among non vaccinated children attributable to their non vaccination is 1566 per 100,000.  AR% - AR% = AR x 100 = (Ie – Io) x 100 Ie Ie - AR% = 1566/105 x 1OO = 27.96% 27/482 - If non vaccination causes measles, about 28% of measles among under-five children who didn’t vaccinated can be attributable to their non vaccination and could therefore be eliminated if we could vaccinate our children. 114 BY Lemma D. (Assistant Prof. of Biostatistics) 114
  • 114.
    3. The PARof measles associated with their non vaccination (Table 1) is: PAR = IT - Io = 104/2390 – 77/1908 = 316/105/year -Thus, if we vaccinate our children, the excess annual incidence rate of measles that could be eliminated among under-five children in this study is 316 per 100,000. 4. PAR% = PAR x 100 IT = 316 x 100 = 7.3% 4351.5 - Thus, if non vaccination causes measles, about 7 percent of all measles cases in the study population could be prevented if all were vaccinated. 115 BY Lemma D. (Assistant Prof. of Biostatistics) 115
  • 115.
    Interpretation of measureof association RR/ OR: 1. RR/ OR > 1, the exposure is risk 2. RR/ OR = 1, there is no association 3. RR/ OR < 1, the exposure is preventive 4. If confidence interval of RR/ OR includes the null (1), then there is no statistical significant association 5. If confidence interval of RR/ OR is far from the null (1), it is a sign of presence of statistical significant association between exposure and outcome 116 BY Lemma D. (Assistant Prof. of Biostatistics) 116
  • 116.
    Interpretation… AR/ PAR: 1. AR/PAR > 0, the exposure is attributing/risk 2. AR/ PAR = 0, there is no attribution 3. AR/ PAR < 0, the exposure is preventive 117 In general the strength of association can be considered: High - if the RR/OR is 3.0 or more Moderate – if the RR/OR is from 1.5 to 2.9 Weak – if the RR/OR is from 1.2 to 1.4 BY Lemma D. (Assistant Prof. of Biostatistics) 117
  • 117.
    Self-Exercise Suppose that acohort study of 400 smokers and 600 non- smokers documented the incidence of hypertension over a period of 10 years. The following table summarizes the data at the end of the study period: 118 BY Lemma D. (Assistant Prof. of Biostatistics) 118
  • 118.
    Based on theabove information, calculate and interpret the following measures of association: 1. Relative risk (RR) 2. Attributable risk (AR) and/or preventive fraction (PF) 3. Attributable risk percent (AR%) 4. Population attributable risk (PAR) 5. Population attributable risk percent (PAR%) 119 BY Lemma D. (Assistant Prof. of Biostatistics) 119
  • 119.
    Precaution! “The attributable riskshould be estimated only when there is reasonable certainty that the association is causal” 120 BY Lemma D. (Assistant Prof. of Biostatistics) 120
  • 120.
    3. Evaluation ofEvidence (Judgment of causality) 121 BY Lemma D. (Assistant Prof. of Biostatistics)
  • 121.
    One of themajor purposes of epidemiological studies is- - Discovering the causes of disease  Judge whether an association between exposure and a disease is causal. Cause of a disease is a factors which plays a role of producing a particular disease. - Sufficient Vs necessary causes - A sufficient cause is not usually a single factor. - A necessary cause, is a factor that is necessary (or with out which) the disease doesn’t exist or occur 122 BY Lemma D. (Assistant Prof. of Biostatistics)
  • 122.
    Concept of Cause 123 Exposureto Bacteria Tissue invasion Genetic Factor Malnutrition Crowded Housing Poverty Susceptible Host Infection Tuberculosis Risk factors for Tuberculosis Mechanism for tuberculosis  The term “risk factor” is commonly used to describe factors that are positively associated with the risk of development of a disease, but that may not be sufficient to cause the disease. BY Lemma D. (Assistant Prof. of Biostatistics)
  • 123.
    Effect of afactor as a causation 1. Independent effect • When a factor showed its effect directly. • Effect seen without being distorted by a confounder. 124 Exposure Outcome BY Lemma D. (Assistant Prof. of Biostatistics)
  • 124.
    2. Confounding effect •It is a variable that alters the relationship between an exposure and an outcome variable • It is usually independently associated with the dependent variable • Measured effect of an exposure is distorted because of association of the exposure with other factor (confounder) that influences the outcome 125 Exposure Outcome Confounder BY Lemma D. (Assistant Prof. of Biostatistics)
  • 125.
    3. Mediation • Likea confounder, it is associated to both the exposure and the outcome, but it is a path of action. • It is distinguished by careful consideration of causal pathways. • Knowledge of biological plausibility about the mediator is necessary 126 Atherosclerosis Cigarette fibrinogen mediator Exposure outcome BY Lemma D. (Assistant Prof. of Biostatistics)
  • 126.
    4. Interaction (effectmodification) • Two or more factors acting together to cause, prevent or control a disease • The effect of two or more causes acting together is often greater than would be expected on the basis of summing the individual effects. Example • Smocking and asbestos dust Vs Lung cancer. • Smoking having RR= 2.0 to develop lung cancer • Exposure to asbestos having RR= 1.7 to develop lung cancer • Combination of smoking & exposure to asbestos together having a RR of > 3.7 to develop lung cancer is an interaction 127 BY Lemma D. (Assistant Prof. of Biostatistics)
  • 127.
    Judgment of Causality Scientificproof, is difficult to obtain; because :- 1. No ‘clean’ experimental environment. - Difficult to test hypothesis with absolute certainty 2. Principally strong observational studies and interventional studies are limited substantially through ethical considerations and feasibility  difficult to constitute proof 128 BY Lemma D. (Assistant Prof. of Biostatistics)
  • 128.
    Possible explanations forobserved association •Chance •Bias •Confounding The observed association between exposure and outcome can be due to: 129 BY Lemma D. (Assistant Prof. of Biostatistics)
  • 129.
    Accuracy of measurement = Accuracy = Validity + Precision = Validity is the extent to which a measured value actually reflects truth • Internal validity • External validity = There are two types of validity 130 BY Lemma D. (Assistant Prof. of Biostatistics)
  • 130.
    Types of validity Internalvalidity:  Is the degree to which a measured value is true within the sample External validity:  Is the extent to which a measured value apply beyond the sample  This is related to generalizability Precision Precision is the extent to which random error alters the measurement of effects 131 BY Lemma D. (Assistant Prof. of Biostatistics)
  • 131.
    Judgment of causality Judgmentof causality has two steps 1. Check whether the observed association between exposure and disease is Valid (Rule out chance, bias and confounding) 2. Check whether the observed association is causal (Bradford hill criteria) 132 BY Lemma D. (Assistant Prof. of Biostatistics)
  • 132.
    Role of chance The role of chance as an alternative explanation for an association emerges from sampling variability  Evaluation of the role of chance is mainly the domain of statistics and involves 1. Test of statistical significance 2. Estimation of confidence interval 133 BY Lemma D. (Assistant Prof. of Biostatistics)
  • 133.
    1. Test ofstatistical significance P-value quantifies the degree to which chance accounts for observed association P-value is the probability of obtaining a result at least as extreme as the observed by chance alone P<0.05/0.01 indicates statistical significance for medical research A very small difference may be significant if you have large sample A large difference may not achieve statistical significance if you have small sample ==== So One can’t make a definite decision based on p-value only 134 BY Lemma D. (Assistant Prof. of Biostatistics)
  • 134.
    2. Estimation ofconfidence interval  Confidence interval represents the range within which true magnitude of effect lies within a certain degree of assurance  It is more informative than p-value because it reflects on both the size of the sample , magnitude of effect and direction of the effect 135 BY Lemma D. (Assistant Prof. of Biostatistics)
  • 135.
    Role of bias Biasis any systematic error in the design, conduct or analysis of an epidemiologic study that results in an incorrect estimate of association between exposure and disease Unlike chance bias can’t be statistically evaluated There are two major types of bias 1. Selection bias 2. Information bias 136 BY Lemma D. (Assistant Prof. of Biostatistics)
  • 136.
    Selection bias  Anysystematic error that arises in the process of identifying the study population  It affects the representativeness of the study  It occurs when there is a difference between sample and population with respect to a variable Examples of selection bias: 1. Volunteer bias 2. Non-response bias 3. Berkeson’s bias – hospitalized individuals may have more than one condition 4. Healthy worker bias – study purely conducted on factory workers 5. Prevalence-incidence bias – missing cases due to death and recovery 137 BY Lemma D. (Assistant Prof. of Biostatistics)
  • 137.
    Information/observation/bias Any systematic errorin the measurement of information on exposure or disease Examples of information bias: 1. Interviewer bias/observer bias 2. Recall bias / Response bias 3. Social desirability bias 4. Placebo effect 5. Surveillance bias- In follow up studies, if we give more attention for those exposed groups 6. Misclassification bias- differential/non differential 7. Hawthorn effect- if our data collection is based on observation- individuals will act differently if they know they are being observed 8. Lead time bias 9. Length bias 138 BY Lemma D. (Assistant Prof. of Biostatistics)
  • 138.
    Ways to minimizebias • Choose appropriate study design • Use strict and randomized sampling procedure • Choose and stick to standardized questioner/ ascertaining instrument • Train and blind your interviewers; • Ascertain outcome on a regular period of time (lose to follow up minimized) 139 BY Lemma D. (Assistant Prof. of Biostatistics)
  • 139.
    Role of confounding 140 Confounding is the third variable that affect the true association between exposure and outcome  Age (the confounder) is strongly and independently associated both with the outcome (wasting) and with the exposure (feeding pattern)  If left uncontrolled, the confounder would have produced a spurious association between exposure and disease Age wasting Feeding pattern BY Lemma D. (Assistant Prof. of Biostatistics)
  • 140.
    Confounding – TheGeneral Rule • The confounding variable is a risk factor for the outcome AND • The confounding variable is associated with the exposure BUT • Is not an intermediate variable in the causal pathway between exposure and outcome 141 BY Lemma D. (Assistant Prof. of Biostatistics)
  • 141.
    Control of confoundingvariables • Randomization • Restriction • Matching During designing stage: • Standardization • Stratification/pooling • Multivariate analysis • Matched analysis During analysis stage 142 BY Lemma D. (Assistant Prof. of Biostatistics)
  • 142.
    A. In theStudy Design 1. Randomization  It is related to process of selection of study subjects  Randomization is a process of selection of study subjects without looking to the outcome or exposure status  It is through simple random sampling methods  When randomization is properly applied, possible confounders will be distributed equally in each group  Confounding effect could be eliminated  It is rarely possible except in RCT 143 BY Lemma D. (Assistant Prof. of Biostatistics)
  • 143.
    2. Restriction  Itis restricting to certain population (gender, certain age group)  Reduces eligible subject pool  Requires narrow range on restriction variables  Some restriction variables may actually be of scientific interest e.g., gender 144 BY Lemma D. (Assistant Prof. of Biostatistics)
  • 144.
    3. Matching Technique thatselects subjects so that the distribution of potential confounders is similar in both groups Can be used in any design but most often used in case/control studies where ‘n’ is smaller Matching can be expensive and time consuming Can limit the ability of the study to investigate the matching factors themselves Only controls confounding of matching factors 145 BY Lemma D. (Assistant Prof. of Biostatistics)
  • 145.
    2. In theAnalysis 1. Stratification It is method of analysis, that adjusts analysis in the presence and absence of possible confounder The process of analysis is done first in a combined (crudely), then in the presence and at last in the absence (stratified) of the possible confounding factor. 146 BY Lemma D. (Assistant Prof. of Biostatistics)
  • 146.
    • Multiple linearregression model: Y =  + 1 X1 + 2 X2 + 3 X3 assumes an ADDITIVE RISK association E  D • Logistic regression model: Log (Y / 1-Y) =  + 1 X1 + 2 X2 + 3 X3 assumes a MULTIPLICATIVE RISK association E  D • Proportional Hazards - Survival regression model: Log Incidence Rate (t) = (t) + 1 X1 + 2 X2 + 3 X3 assumes a MULTIPLICATIVE RISK association E  D at time (t) 147 2. Multivariable Adjustment BY Lemma D. (Assistant Prof. of Biostatistics)
  • 147.
    Types/effects of Confounding •Negative • Positive • Qualitative 148 BY Lemma D. (Assistant Prof. of Biostatistics)
  • 148.
    Positive Confounding 149 o Leadsto appearance or strengthening of E/D association; exaggerates effect of E on D. o Causes magnitude of observed, crude E~D association to be more extreme than true association.; observed RR (OR, IDR, etc) further away from the null than true (adjusted) RR. R R adj ˆ R R crude ˆ R R adj ˆ R R crude ˆ null BY Lemma D. (Assistant Prof. of Biostatistics)
  • 149.
    Negative Confounding 150 o Leadsto apparent absence or weakening of E/D association; underestimate effect of E on D. o Causes magnitude of observed E~D association to be less extreme than underlying association; observed RR/OR closer to the null than true (adjusted) RR/OR. R R adj ˆ R R crude ˆ R R adj ˆ R R crude ˆ null BY Lemma D. (Assistant Prof. of Biostatistics)
  • 150.
    Qualitative (Cross-over) Confounding 151 oAn extreme case of confounding which leads to an inversion of direction of association. o An actual positive association between E and D appears to be a negative association; an actual negative association between E and D appears to be a positive association. R R adj ˆ R R crude ˆ R R adj ˆ R R crude ˆ null BY Lemma D. (Assistant Prof. of Biostatistics)
  • 151.
    Establishing a CausalAssociation • Once we found that chance, bias and confounding are all determined to be unlikely, then we can conclude that a valid statistical association exists. • We should then apply judgment of causality 152 BY Lemma D. (Assistant Prof. of Biostatistics)
  • 152.
    Bradford-Hill criteria It isthe statement of epidemiological criteria of a causal association formulated in 1965 by Austin Bradford Hill (1897-1991) This criteria include; 1. Strength of the Association; The stronger the association the more likely that it is a causal. Strong --- The more it is far from unity. --- If RR/OR > 1.5 and < 0.5 Weak If RR/OR > 0.5 and < 1.5 153 BY Lemma D. (Assistant Prof. of Biostatistics)
  • 153.
    Cont… 2. Consistency ofrelationship;  The same association should be demonstrated by other studies both with different methods, settings and different investigators.  Special methods of combining of a number of well designed studies exist, Meta Analysis.  Meta analysis of RCT  Meta analysis of observational studies 154 BY Lemma D. (Assistant Prof. of Biostatistics)
  • 154.
    155 BY Lemma D.(Assistant Prof. of Biostatistics)
  • 155.
    156 BY Lemma D.(Assistant Prof. of Biostatistics)
  • 156.
    Cont… 3. Specificity ofthe association; • Single exposure single disease • This works more to most living organisms as causes. Plasmodium Sp. Malaria HIV AIDS 4. Temporal relationship o It is crucial that the cause must precede the outcome o This is usually problematic in cross-sectional and case-control designs. 157 BY Lemma D. (Assistant Prof. of Biostatistics)
  • 157.
    158 BY Lemma D.(Assistant Prof. of Biostatistics)
  • 158.
    Cont… 5. Dose responserelationship • The risk of disease increases with increasing exposure to a causal agent. e.g. Cigarette smocking dose response 159 BY Lemma D. (Assistant Prof. of Biostatistics)
  • 159.
    Cont… 6. Biological Plausibility: Hypothesis should be coherent with what is known about the disease; both biologically and using laboratory.  Knowledge about physiology, biology and pathology should support the cause-effect relationship 160 BY Lemma D. (Assistant Prof. of Biostatistics)
  • 160.
    Cont… 7. Study design; Itis most important to consider. 161 BY Lemma D. (Assistant Prof. of Biostatistics)
  • 161.
    Cont… 8. Reversibility • Removalof a possible cause results in a reduced disease risk eg. Cessation of cigarette smoking is associated with reduction in risk of Lung cancer relative to those who continue. • If the cause leads to rapid irreversible changes (as in HIV infection), then reversibility cannot be a condition for causality. 162 BY Lemma D. (Assistant Prof. of Biostatistics)
  • 162.
    Cont… Judging the evidence •There are no completely reliable criteria for determining whether an association is causal or not. • In judging the different aspects of causation, • The correct temporal relationship is essential, • Once this has been found, weight should be given to • Plausibility, • Consistency, and • dose-response relationship 163 BY Lemma D. (Assistant Prof. of Biostatistics)
  • 163.
    Reading assignment 1. Conditionalconfounder 2. Residual confounder, how residual confounder? 3. Departure from additive 4. Departure from multiplication 5. Antagonist 6. Synergy 164 BY Lemma D. (Assistant Prof. of Biostatistics)