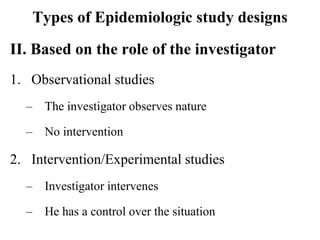
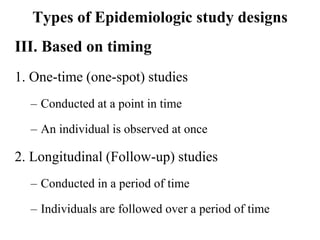
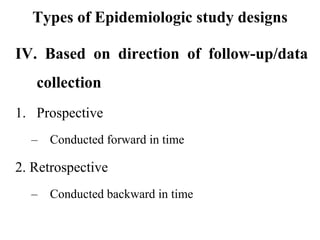
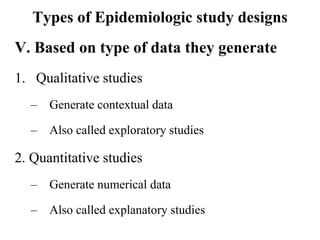
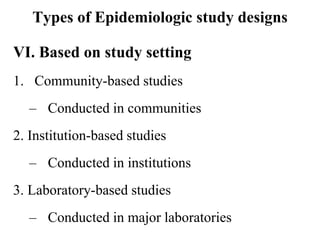
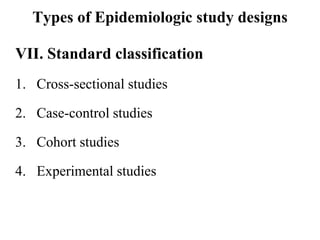
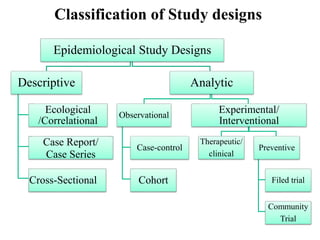
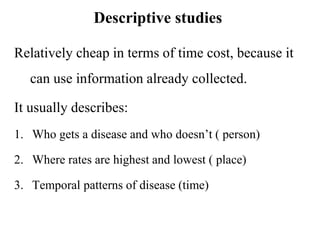
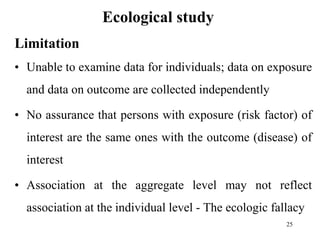
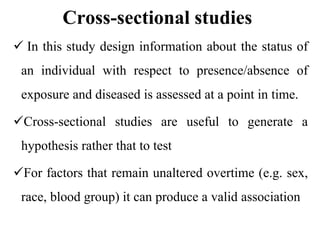
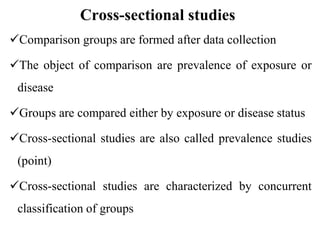
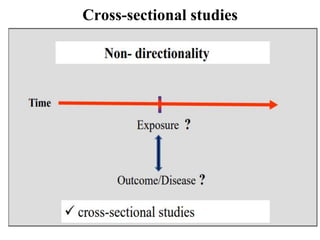
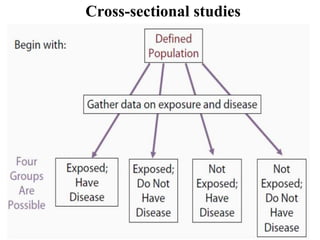
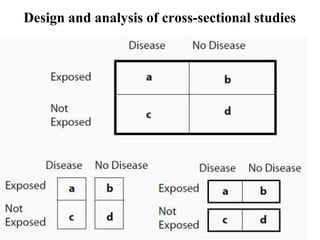
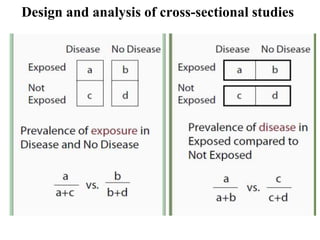
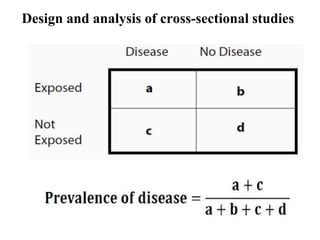
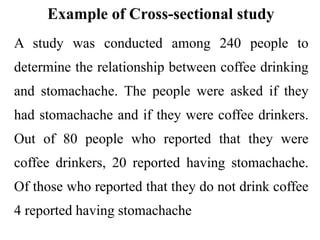
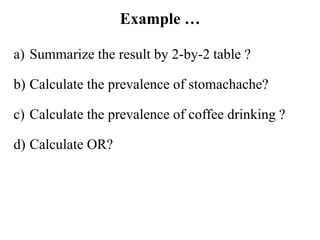
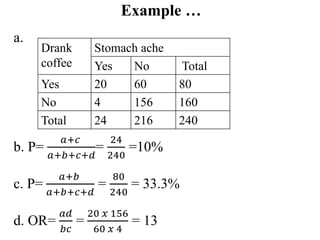
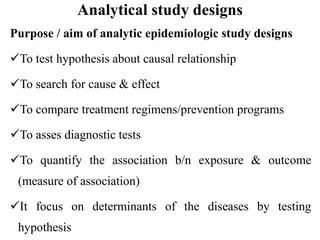
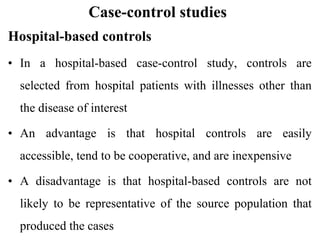
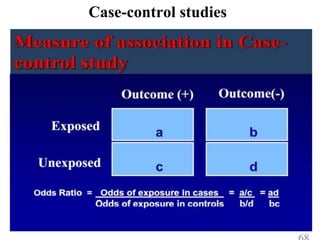
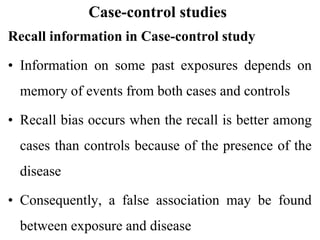
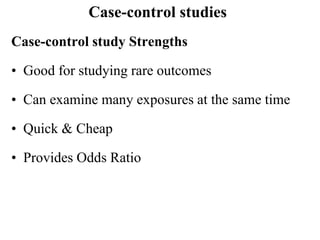
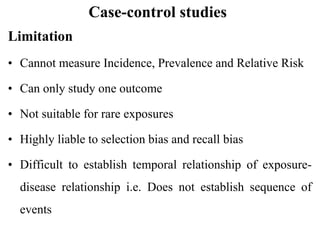
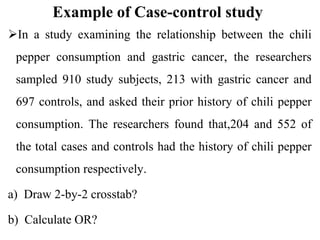
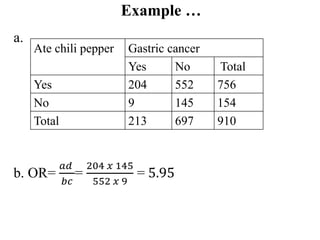
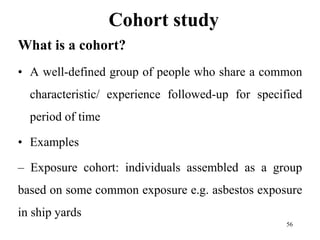
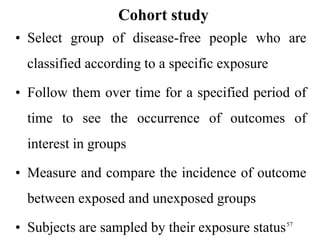
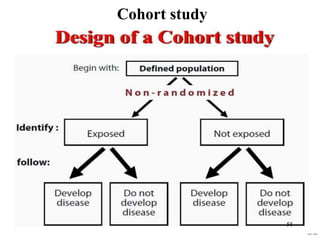
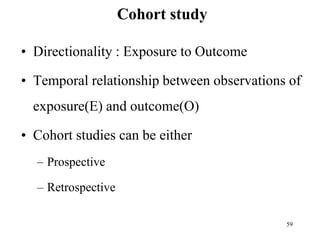
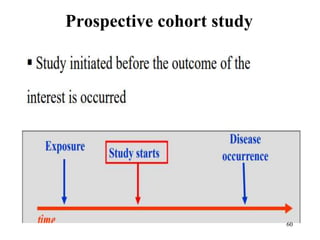
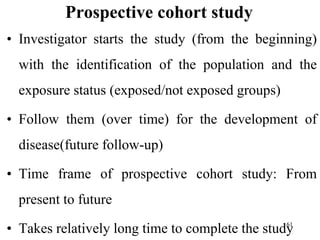
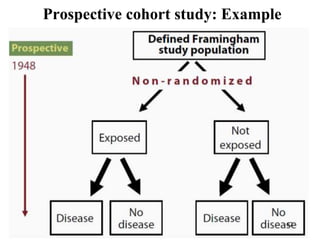
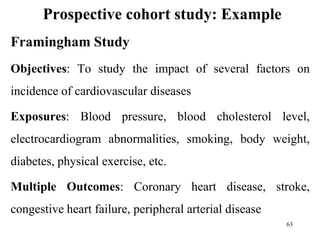
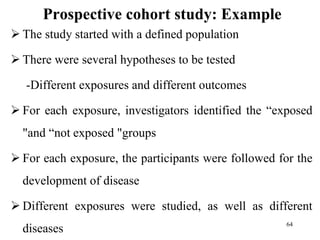
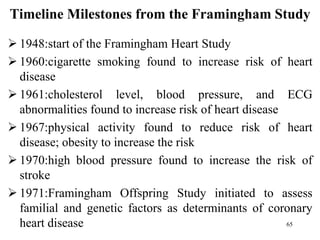
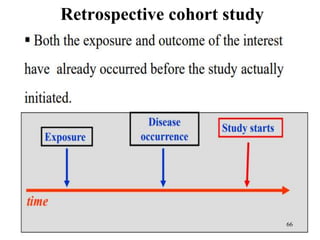
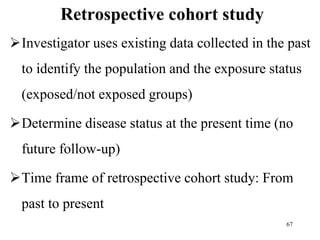
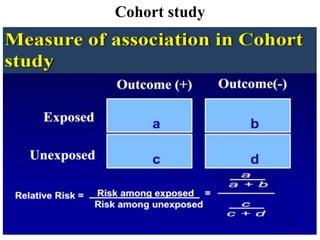
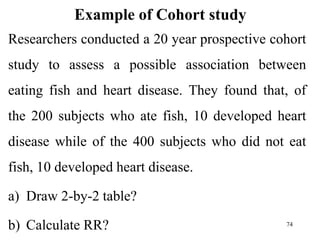
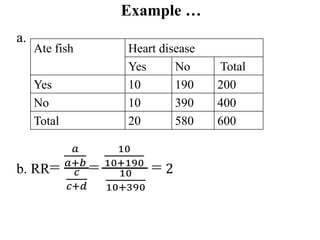
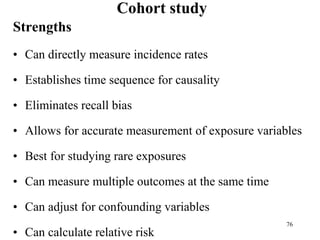
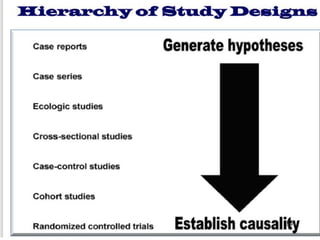
EPIDEMIOLOGY
Epidemiological study designs
Sewnet Getaye (BSC,MPH)
Email: sgetaye@gmail.com
1
Session Objectives
After completing this session learners will be able to
 Understand epidemiological study designs
 Differentiate the type of study design used by
investigators
 Identify the merits and demerits of each study
designs
 Apply epidemiological study designs to conduct a
study.
Study design
Definition
A study design is a specific plan or protocol for
conducting the study, which allows the investigator
to translate the conceptual hypothesis into an
operational one.
Types of Epidemiologic study designs
I. Based on objective/focus/research
question
1. Descriptive studies
– Describe: who, when, where & how many
2. Analytic studies
– Analyse: How and why
Types of Epidemiologic study designs
II. Based on the role of the investigator
1. Observational studies
– The investigator observes nature
– No intervention
2. Intervention/Experimental studies
– Investigator intervenes
– He has a control over the situation
Types of Epidemiologic study designs
III. Based on timing
1. One-time (one-spot) studies
– Conducted at a point in time
– An individual is observed at once
2. Longitudinal (Follow-up) studies
– Conducted in a period of time
– Individuals are followed over a period of time
Types of Epidemiologic study designs
IV. Based on direction of follow-up/data
collection
1. Prospective
– Conducted forward in time
2. Retrospective
– Conducted backward in time
Types of Epidemiologic study designs
V. Based on type of data they generate
1. Qualitative studies
– Generate contextual data
– Also called exploratory studies
2. Quantitative studies
– Generate numerical data
– Also called explanatory studies
Types of Epidemiologic study designs
VI. Based on study setting
1. Community-based studies
– Conducted in communities
2. Institution-based studies
– Conducted in institutions
3. Laboratory-based studies
– Conducted in major laboratories
Types of Epidemiologic study designs
VII. Standard classification
1. Cross-sectional studies
2. Case-control studies
3. Cohort studies
4. Experimental studies
Classification of Study designs
Epidemiological Study Designs
Descriptive
Ecological
/Correlational
Case Report/
Case Series
Cross-Sectional
Analytic
Observational
Case-control
Cohort
Experimental/
Interventional
Therapeutic/
clinical
Preventive
Filed trial
Community
Trial
Descriptive studies
Relatively cheap in terms of time cost, because it
can use information already collected.
It usually describes:
1. Who gets a disease and who doesn’t ( person)
2. Where rates are highest and lowest ( place)
3. Temporal patterns of disease (time)
Descriptive studies
 It is the most common form of study in
medical literatures
 There are three forms of descriptive study
designs
1. Correlational /ecological design ( use population as
study subject)
2. Case report and/or case series studies
3. Cross-sectional survey
Case report and case series
• Case reports describe the experience of a single
patient
• Case series describe the experience of a group
of patients with similar diagnosis
• Both document unusual occurrences
14
Case report
• It is the study of health profile of a single individual using
a careful and detailed report by one or more clinicians
• It is made using a history, physical examination and lab
investigation
• Report is usually documented if there is unusual medical
occurrence, thus it may be first clue for identification of a
new disease
• It is useful in constructing a natural history of individual
disease. 15
Case report
Eg. The first one AIDS cases in USA.
 One young, previously healthy homosexual man was
diagnosed as having Pneumocysti carinii pneumonia at
Los Angeles hospital in 1980. This form of pneumonia
had been seen almost exclusively among older men and
women whose immune systems were suppressed. This
unusual circumstance suggested that this individual was
actually suffering with a previously unknown disease,
subsequently it was called AIDS
16
Case series
• First case report may stimulate compilation of
additional case reports….a case series
e.g. occurrence of Pneumocystis carinii on young,
homosexual man with no history of immune
deficiency stimulated the collection of additional
similar cases
• Collection of case reports in a short period of
time 17
Case series
• Describes characteristics of a number of
patients with a given disease
• Similar to case report, it is usually made on
cases having new and/ or unusual disease
• It is often used to detect the emergence of new
disease or an epidemics
18
Case series
Eg. The first five AIDS cases in USA.
• Five young, previously healthy homosexual men were diagnosed
as having Pneumocysti carinii pneumonia at Los Angeles hospital
during a six month period from 1980 to 1981. This form of
pneumonia had been seen almost exclusively among older men and
women whose immune systems were suppressed. This unusual
circumstance suggested that these individuals were actually
suffering with a previously unknown disease, subsequently it was
called AIDS.
19
Case report / series
Advantages:
• Use available clinical data
• Detailed individual data
• Useful for the recognition of new diseases
• Suggest need for investigation (hypothesis generation)
Disadvantages:
• May reflect experience of one person or one clinician
• No explicit comparison group
• Difficult to compute rate as the denominator is not 20
Ecological study
• Based on aggregate measures of exposure and outcome
from several populations
• The units of analysis are populations or groups of
people rather than individuals
• Correlations are obtained between exposure rates and
disease rates among different groups or populations
• Compare populations in different countries at the same
time or the same population on one country at different
times 21
Ecological study
Example
• Suppose air pollution is higher in Baltimore than in Tampa, but
mortality from lung disease is lower in Baltimore than in Tampa.
It would be fallacious to conclude that air pollution protects
against lung disease deaths.
• It is possible that persons dying of lung disease in Tampa may
have moved from cities with high air pollution or that another risk
factor for lung disease – such as smoking – is more prevalent in
Tampa than Baltimore. We do not know the cumulative exposures
of cases and non-cases in either city.
22
Ecological study
Ecologic Fallacy:
• Observations made at the group level may not
represent the exposure-disease relationship at
the individual level
• The ecologic fallacy occurs when incorrect
inferences about the individual are made from
group level data
23
Ecological study
Ecological study Strength
• Easy to do
• Quick and inexpensive
• Often use already available information
• Generate hypotheses for additional study
24
Ecological study
Limitation
• Unable to examine data for individuals; data on exposure
and data on outcome are collected independently
• No assurance that persons with exposure (risk factor) of
interest are the same ones with the outcome (disease) of
interest
• Association at the aggregate level may not reflect
association at the individual level - The ecologic fallacy
25
Cross-sectional studies
 In this study design information about the status of
an individual with respect to presence/absence of
exposure and diseased is assessed at a point in time.
Cross-sectional studies are useful to generate a
hypothesis rather that to test
For factors that remain unaltered overtime (e.g. sex,
race, blood group) it can produce a valid association
Cross-sectional studies
Comparison groups are formed after data collection
The object of comparison are prevalence of exposure or
disease
Groups are compared either by exposure or disease status
Cross-sectional studies are also called prevalence studies
(point)
Cross-sectional studies are characterized by concurrent
classification of groups
Cross-sectional studies
Design and analysis of cross-sectional studies
Measure of association in cross-sectional studies: -Odds
ratio
Cross-sectional studies
Uses of Cross-Sectional Studies
Hypothesis generation
Estimation of the magnitude and distribution of a
health problem
Intervention planning
Cross-sectional studies
Advantages of cross-sectional studies
• Less time consuming
• Less expensive
• Provides more information
• Describes well
• Generates hypothesis
Cross-sectional studies
Limitations of cross-sectional studies
• Antecedent-consequence uncertainty
“Chicken or egg dilemma”
• Data dredge leading to inappropriate
comparison
• More vulnerable to bias
Example of Cross-sectional study
A study was conducted among 240 people to
determine the relationship between coffee drinking
and stomachache. The people were asked if they
had stomachache and if they were coffee drinkers.
Out of 80 people who reported that they were
coffee drinkers, 20 reported having stomachache.
Of those who reported that they do not drink coffee
4 reported having stomachache
Example …
a) Summarize the result by 2-by-2 table ?
b) Calculate the prevalence of stomachache?
c) Calculate the prevalence of coffee drinking ?
d) Calculate OR?
Example …
a.
b. P=
𝑎+𝑐
𝑎+𝑏+𝑐+𝑑
=
24
240
=10%
c. P=
𝑎+𝑏
𝑎+𝑏+𝑐+𝑑
=
80
240
= 33.3%
d. OR=
𝑎𝑑
𝑏𝑐
=
20 𝑥 156
60 𝑥 4
= 13
Drank
coffee
Stomach ache
Yes No Total
Yes 20 60 80
No 4 156 160
Total 24 216 240
Analytical study designs
Purpose / aim of analytic epidemiologic study designs
To test hypothesis about causal relationship
To search for cause & effect
To compare treatment regimens/prevention programs
To asses diagnostic tests
To quantify the association b/n exposure & outcome
(measure of association)
It focus on determinants of the diseases by testing
hypothesis
Case-control studies
• Subjects are selected with respect to the presence
(cases) or absence (controls) of disease, and then
inquiries are made about past exposure
• We compare diseased (cases) and non-diseased
(controls) to find out the level of exposure
• Exposure status is traced backward in time
Case-control studies
In case-control study design the disease status is
fixed by the investigator prior to the data collection
while exposure status to the expected risk factor is
random
Case-control studies
Features to look for in a Case-control study
Is selection bias present?
• Are cases and controls similar in all important respects except
the disease in question?
Is information bias present?
• Is information about exposures gathered in the same way for
cases and controls?
Is confounding factors present?
• Could the results be accounted for by the presence of a factors
associated with both the exposure and outcome but not directly
involved in the causal pathway?
Case-control studies
Steps in a case control study
• Define the study’s objectives
• Identify and select “cases”:
• Select “controls”
• Collect data: measure level of “exposure” in both cases
and controls
• Analyze data: compare the exposure frequencies in those
with and without disease
Case-control studies
Choosing cases and controls in case-control study
• Ideally, cases are selected from a clearly defined
population, often called the source population, and
controls are selected from the same population that
yielded the cases
• Control group should be representative of the
population from which the cases are derived,
typically called the source population
Case-control studies
Choosing controls
• Two common types of controls are population based and
hospital-based controls
Population-based controls
• In population-based case-control study, controls are
selected from the community
• An advantage is that cases and controls come from the
same source population, so they are similar in some way
• A disadvantage is that it is difficult to obtain population
lists and to identify and enroll subjects
Case-control studies
Hospital-based controls
• In a hospital-based case-control study, controls are
selected from hospital patients with illnesses other than
the disease of interest
• An advantage is that hospital controls are easily
accessible, tend to be cooperative, and are inexpensive
• A disadvantage is that hospital-based controls are not
likely to be representative of the source population that
produced the cases
Case-control studies
Recall information in Case-control study
• Information on some past exposures depends on
memory of events from both cases and controls
• Recall bias occurs when the recall is better among
cases than controls because of the presence of the
disease
• Consequently, a false association may be found
between exposure and disease
Case-control studies
Case-control study Strengths
• Good for studying rare outcomes
• Can examine many exposures at the same time
• Quick & Cheap
• Provides Odds Ratio
Case-control studies
Limitation
• Cannot measure Incidence, Prevalence and Relative Risk
• Can only study one outcome
• Not suitable for rare exposures
• Highly liable to selection bias and recall bias
• Difficult to establish temporal relationship of exposure-
disease relationship i.e. Does not establish sequence of
events
Example of Case-control study
In a study examining the relationship between the chili
pepper consumption and gastric cancer, the researchers
sampled 910 study subjects, 213 with gastric cancer and
697 controls, and asked their prior history of chili pepper
consumption. The researchers found that,204 and 552 of
the total cases and controls had the history of chili pepper
consumption respectively.
a) Draw 2-by-2 crosstab?
b) Calculate OR?
Example …
a.
b. OR=
𝑎𝑑
𝑏𝑐
=
204 𝑥 145
552 𝑥 9
= 5.95
Ate chili pepper Gastric cancer
Yes No Total
Yes 204 552 756
No 9 145 154
Total 213 697 910
Cohort study
What is a cohort?
• A well-defined group of people who share a common
characteristic/ experience followed-up for specified
period of time
• Examples
– Exposure cohort: individuals assembled as a group
based on some common exposure e.g. asbestos exposure
in ship yards
56
Cohort study
• Select group of disease-free people who are
classified according to a specific exposure
• Follow them over time for a specified period of
time to see the occurrence of outcomes of
interest in groups
• Measure and compare the incidence of outcome
between exposed and unexposed groups
• Subjects are sampled by their exposure status57
Cohort study
58
Cohort study
• Directionality : Exposure to Outcome
• Temporal relationship between observations of
exposure(E) and outcome(O)
• Cohort studies can be either
– Prospective
– Retrospective
59
Prospective cohort study
60
Prospective cohort study
• Investigator starts the study (from the beginning)
with the identification of the population and the
exposure status (exposed/not exposed groups)
• Follow them (over time) for the development of
disease(future follow-up)
• Time frame of prospective cohort study: From
present to future
• Takes relatively long time to complete the study
61
Prospective cohort study: Example
62
Prospective cohort study: Example
Framingham Study
Objectives: To study the impact of several factors on
incidence of cardiovascular diseases
Exposures: Blood pressure, blood cholesterol level,
electrocardiogram abnormalities, smoking, body weight,
diabetes, physical exercise, etc.
Multiple Outcomes: Coronary heart disease, stroke,
congestive heart failure, peripheral arterial disease
63
Prospective cohort study: Example
 The study started with a defined population
 There were several hypotheses to be tested
-Different exposures and different outcomes
 For each exposure, investigators identified the “exposed
"and “not exposed "groups
 For each exposure, the participants were followed for the
development of disease
 Different exposures were studied, as well as different
diseases 64
Timeline Milestones from the Framingham Study
 1948:start of the Framingham Heart Study
 1960:cigarette smoking found to increase risk of heart
disease
 1961:cholesterol level, blood pressure, and ECG
abnormalities found to increase risk of heart disease
 1967:physical activity found to reduce risk of heart
disease; obesity to increase the risk
 1970:high blood pressure found to increase the risk of
stroke
 1971:Framingham Offspring Study initiated to assess
familial and genetic factors as determinants of coronary
heart disease 65
Retrospective cohort study
66
Retrospective cohort study
Investigator uses existing data collected in the past
to identify the population and the exposure status
(exposed/not exposed groups)
Determine disease status at the present time (no
future follow-up)
Time frame of retrospective cohort study: From
past to present
67
Is Prospective or Retrospective cohort
study????????????
In an "outcomes" analysis of coronary bypass
surgery, health services researchers identified charts
of all patients diagnosed with three vessel disease at
three major clinical centers during the past ten years.
These patients are separated into those who initially
were treated surgically and those who were initially
treated medically. Aggregate results for mortality
and a variety of other outcome variables were
compiled for each group, to produce prognostic
profiles for those initially treated medically vs. those
who received immediate surgery. 68
Is Prospective or Retrospective cohort
study????????????
The pediatricians wanted to determine if there is a
difference in the incidence of croup between the
babies who are breastfed and those who are not
breastfed. They followed a group of babies who are
breastfed for six months following birth compared
to another group of babies who are not breastfed for
six months following birth. All the babies were free
of croup when the pediatricians started the study. Of
100 breastfed babies, 2 babies developed the croup
while of 50 babies who are not breastfed, 5
developed the croup. 69
Cohort study
Features to look for in a cohort study
• Is selection bias present?
• Are the exposed and unexposed groups similar in
all important respects except the exposure status?
• What steps were taken to minimize information
bias?
• Is the outcome identified in the same way for
both groups?
70
Cohort study
• How complete was the follow-up of both groups?
• What effort were made to limit loss to follow-up?
• Was loss to follow-up similar in both groups?
• Were potential cofounding factor present and controlled
in the analysis?
• Did the investigators anticipated and gather information
on potential confounding factors?
• What method(s) were used to assess and control
confounding? 71
Cohort study
Steps in a cohort study
• Define the study’s objectives
• Identify the study cohort
• Measure level of exposure and categorize cohort into
“exposed” and “unexposed” groups
• Follow groups
• Measure outcome or “disease” (dependent) variable
• Analyze data: compare incidence rates in the different
exposure groups
72
Cohort study
73
Example of Cohort study
Researchers conducted a 20 year prospective cohort
study to assess a possible association between
eating fish and heart disease. They found that, of
the 200 subjects who ate fish, 10 developed heart
disease while of the 400 subjects who did not eat
fish, 10 developed heart disease.
a) Draw 2-by-2 table?
b) Calculate RR? 74
Example …
a.
b. RR=
𝑎
𝑎+𝑏
𝑐
𝑐+𝑑
=
10
10+190
10
10+390
= 2
Ate fish Heart disease
Yes No Total
Yes 10 190 200
No 10 390 400
Total 20 580 600
Cohort study
Strengths
• Can directly measure incidence rates
• Establishes time sequence for causality
• Eliminates recall bias
• Allows for accurate measurement of exposure variables
• Best for studying rare exposures
• Can measure multiple outcomes at the same time
• Can adjust for confounding variables
• Can calculate relative risk
76
Cohort study
Limitation
• Expensive
• Time consuming
• Relatively poor for studying rare diseases or outcomes
• Selection bias
• Exposure may change over time
• Disease may have a long pre-clinical phase
• Potential for loss of study subjects to follow-up
• May require large study groups
77
Experimental study design
• A study in which a population is selected for a planned
trial of a regimen, whose effects are measured by
comparing the outcome of the regimen in the
experimental group versus the outcome of another
regimen in the control group
• Such designs are differentiated from observational
designs by the fact that there is manipulation of the study
factor (exposure), and randomization (random
allocation) of subjects to treatment (exposure) groups78
Experimental study design
79
Experimental study design
80
Experimental study design
• The investigator assigns the exposure variable ß
Prospective in nature
• Randomized Clinical Trial(RCT): individual
study subject
• Community Intervention Trial(CIT): study
subject is the “community”
81
Experimental study design
Why performed?
1. Provide stronger evidence of the effect (outcome)
compared to observational designs, with maximum
confidence and assurance
2. Yield more valid results, as variation is minimized and
bias controlled
3. Determine whether experimental treatments are safe and
effective under “controlled environments” (as opposed to
“natural settings” in observational designs) 82
Experimental study design
Steps in an Experimental study
• Define the study’s objectives
• Identify the target population
• Recruit volunteers from the target population
• Random allocation of volunteers into two groups
(assign study subjects to exposure and non-
exposure group)
83
Experimental study design
• Assign exposure (independent) variable. Consider
blinding
• Follow groups prospectively
• Measure outcome (dependent) variable
• Analyze data: compare incidence rates in
exposed (treated) and unexposed (untreated)
84
Experimental study design
• Time frame of Experimental study: From
present to future
• Random allocation
• Blinding
• The most serious objections to Experimental
studies are ethical issues
85
Experimental study design
86
Experimental study design
Strengths:
• Best measure of causal relationship
• Best design for controlling bias and confounding
• Can measure multiple outcomes
Limitation :
• High cost and time-consuming
• Ethical issues may be a problem
87
Example of Experimental study
• Researchers are interested in determining whether
the advice given during routine physical
examination is effective in encouraging patients to
stop smoking. In a study of current smokers, one
group of patients was given a brief talk about
hazards of smoking and was encouraged to quit. A
second group received no advice pertaining to
smoking. All the patients were given a follow up
examination/assessing. In a sample of 114 patients
who received advice, 11 reported, they had quit
smoking and in a sample of 96 patients who had
not received advice, 7 quit smoking. 88
89

epidemiological study designs.PPpresentationsX

  • 1.
    EPIDEMIOLOGY Epidemiological study designs SewnetGetaye (BSC,MPH) Email: sgetaye@gmail.com 1
  • 2.
    Session Objectives After completingthis session learners will be able to  Understand epidemiological study designs  Differentiate the type of study design used by investigators  Identify the merits and demerits of each study designs  Apply epidemiological study designs to conduct a study.
  • 3.
    Study design Definition A studydesign is a specific plan or protocol for conducting the study, which allows the investigator to translate the conceptual hypothesis into an operational one.
  • 4.
    Types of Epidemiologicstudy designs I. Based on objective/focus/research question 1. Descriptive studies – Describe: who, when, where & how many 2. Analytic studies – Analyse: How and why
  • 5.
    Types of Epidemiologicstudy designs II. Based on the role of the investigator 1. Observational studies – The investigator observes nature – No intervention 2. Intervention/Experimental studies – Investigator intervenes – He has a control over the situation
  • 6.
    Types of Epidemiologicstudy designs III. Based on timing 1. One-time (one-spot) studies – Conducted at a point in time – An individual is observed at once 2. Longitudinal (Follow-up) studies – Conducted in a period of time – Individuals are followed over a period of time
  • 7.
    Types of Epidemiologicstudy designs IV. Based on direction of follow-up/data collection 1. Prospective – Conducted forward in time 2. Retrospective – Conducted backward in time
  • 8.
    Types of Epidemiologicstudy designs V. Based on type of data they generate 1. Qualitative studies – Generate contextual data – Also called exploratory studies 2. Quantitative studies – Generate numerical data – Also called explanatory studies
  • 9.
    Types of Epidemiologicstudy designs VI. Based on study setting 1. Community-based studies – Conducted in communities 2. Institution-based studies – Conducted in institutions 3. Laboratory-based studies – Conducted in major laboratories
  • 10.
    Types of Epidemiologicstudy designs VII. Standard classification 1. Cross-sectional studies 2. Case-control studies 3. Cohort studies 4. Experimental studies
  • 11.
    Classification of Studydesigns Epidemiological Study Designs Descriptive Ecological /Correlational Case Report/ Case Series Cross-Sectional Analytic Observational Case-control Cohort Experimental/ Interventional Therapeutic/ clinical Preventive Filed trial Community Trial
  • 12.
    Descriptive studies Relatively cheapin terms of time cost, because it can use information already collected. It usually describes: 1. Who gets a disease and who doesn’t ( person) 2. Where rates are highest and lowest ( place) 3. Temporal patterns of disease (time)
  • 13.
    Descriptive studies  Itis the most common form of study in medical literatures  There are three forms of descriptive study designs 1. Correlational /ecological design ( use population as study subject) 2. Case report and/or case series studies 3. Cross-sectional survey
  • 14.
    Case report andcase series • Case reports describe the experience of a single patient • Case series describe the experience of a group of patients with similar diagnosis • Both document unusual occurrences 14
  • 15.
    Case report • Itis the study of health profile of a single individual using a careful and detailed report by one or more clinicians • It is made using a history, physical examination and lab investigation • Report is usually documented if there is unusual medical occurrence, thus it may be first clue for identification of a new disease • It is useful in constructing a natural history of individual disease. 15
  • 16.
    Case report Eg. Thefirst one AIDS cases in USA.  One young, previously healthy homosexual man was diagnosed as having Pneumocysti carinii pneumonia at Los Angeles hospital in 1980. This form of pneumonia had been seen almost exclusively among older men and women whose immune systems were suppressed. This unusual circumstance suggested that this individual was actually suffering with a previously unknown disease, subsequently it was called AIDS 16
  • 17.
    Case series • Firstcase report may stimulate compilation of additional case reports….a case series e.g. occurrence of Pneumocystis carinii on young, homosexual man with no history of immune deficiency stimulated the collection of additional similar cases • Collection of case reports in a short period of time 17
  • 18.
    Case series • Describescharacteristics of a number of patients with a given disease • Similar to case report, it is usually made on cases having new and/ or unusual disease • It is often used to detect the emergence of new disease or an epidemics 18
  • 19.
    Case series Eg. Thefirst five AIDS cases in USA. • Five young, previously healthy homosexual men were diagnosed as having Pneumocysti carinii pneumonia at Los Angeles hospital during a six month period from 1980 to 1981. This form of pneumonia had been seen almost exclusively among older men and women whose immune systems were suppressed. This unusual circumstance suggested that these individuals were actually suffering with a previously unknown disease, subsequently it was called AIDS. 19
  • 20.
    Case report /series Advantages: • Use available clinical data • Detailed individual data • Useful for the recognition of new diseases • Suggest need for investigation (hypothesis generation) Disadvantages: • May reflect experience of one person or one clinician • No explicit comparison group • Difficult to compute rate as the denominator is not 20
  • 21.
    Ecological study • Basedon aggregate measures of exposure and outcome from several populations • The units of analysis are populations or groups of people rather than individuals • Correlations are obtained between exposure rates and disease rates among different groups or populations • Compare populations in different countries at the same time or the same population on one country at different times 21
  • 22.
    Ecological study Example • Supposeair pollution is higher in Baltimore than in Tampa, but mortality from lung disease is lower in Baltimore than in Tampa. It would be fallacious to conclude that air pollution protects against lung disease deaths. • It is possible that persons dying of lung disease in Tampa may have moved from cities with high air pollution or that another risk factor for lung disease – such as smoking – is more prevalent in Tampa than Baltimore. We do not know the cumulative exposures of cases and non-cases in either city. 22
  • 23.
    Ecological study Ecologic Fallacy: •Observations made at the group level may not represent the exposure-disease relationship at the individual level • The ecologic fallacy occurs when incorrect inferences about the individual are made from group level data 23
  • 24.
    Ecological study Ecological studyStrength • Easy to do • Quick and inexpensive • Often use already available information • Generate hypotheses for additional study 24
  • 25.
    Ecological study Limitation • Unableto examine data for individuals; data on exposure and data on outcome are collected independently • No assurance that persons with exposure (risk factor) of interest are the same ones with the outcome (disease) of interest • Association at the aggregate level may not reflect association at the individual level - The ecologic fallacy 25
  • 26.
    Cross-sectional studies  Inthis study design information about the status of an individual with respect to presence/absence of exposure and diseased is assessed at a point in time. Cross-sectional studies are useful to generate a hypothesis rather that to test For factors that remain unaltered overtime (e.g. sex, race, blood group) it can produce a valid association
  • 27.
    Cross-sectional studies Comparison groupsare formed after data collection The object of comparison are prevalence of exposure or disease Groups are compared either by exposure or disease status Cross-sectional studies are also called prevalence studies (point) Cross-sectional studies are characterized by concurrent classification of groups
  • 28.
  • 29.
  • 30.
    Design and analysisof cross-sectional studies
  • 31.
    Design and analysisof cross-sectional studies
  • 32.
    Design and analysisof cross-sectional studies
  • 33.
    Design and analysisof cross-sectional studies Measure of association in cross-sectional studies: -Odds ratio
  • 34.
    Cross-sectional studies Uses ofCross-Sectional Studies Hypothesis generation Estimation of the magnitude and distribution of a health problem Intervention planning
  • 35.
    Cross-sectional studies Advantages ofcross-sectional studies • Less time consuming • Less expensive • Provides more information • Describes well • Generates hypothesis
  • 36.
    Cross-sectional studies Limitations ofcross-sectional studies • Antecedent-consequence uncertainty “Chicken or egg dilemma” • Data dredge leading to inappropriate comparison • More vulnerable to bias
  • 37.
    Example of Cross-sectionalstudy A study was conducted among 240 people to determine the relationship between coffee drinking and stomachache. The people were asked if they had stomachache and if they were coffee drinkers. Out of 80 people who reported that they were coffee drinkers, 20 reported having stomachache. Of those who reported that they do not drink coffee 4 reported having stomachache
  • 38.
    Example … a) Summarizethe result by 2-by-2 table ? b) Calculate the prevalence of stomachache? c) Calculate the prevalence of coffee drinking ? d) Calculate OR?
  • 39.
    Example … a. b. P= 𝑎+𝑐 𝑎+𝑏+𝑐+𝑑 = 24 240 =10% c.P= 𝑎+𝑏 𝑎+𝑏+𝑐+𝑑 = 80 240 = 33.3% d. OR= 𝑎𝑑 𝑏𝑐 = 20 𝑥 156 60 𝑥 4 = 13 Drank coffee Stomach ache Yes No Total Yes 20 60 80 No 4 156 160 Total 24 216 240
  • 40.
    Analytical study designs Purpose/ aim of analytic epidemiologic study designs To test hypothesis about causal relationship To search for cause & effect To compare treatment regimens/prevention programs To asses diagnostic tests To quantify the association b/n exposure & outcome (measure of association) It focus on determinants of the diseases by testing hypothesis
  • 41.
    Case-control studies • Subjectsare selected with respect to the presence (cases) or absence (controls) of disease, and then inquiries are made about past exposure • We compare diseased (cases) and non-diseased (controls) to find out the level of exposure • Exposure status is traced backward in time
  • 42.
  • 43.
    Case-control studies In case-controlstudy design the disease status is fixed by the investigator prior to the data collection while exposure status to the expected risk factor is random
  • 44.
  • 45.
    Case-control studies Features tolook for in a Case-control study Is selection bias present? • Are cases and controls similar in all important respects except the disease in question? Is information bias present? • Is information about exposures gathered in the same way for cases and controls? Is confounding factors present? • Could the results be accounted for by the presence of a factors associated with both the exposure and outcome but not directly involved in the causal pathway?
  • 46.
    Case-control studies Steps ina case control study • Define the study’s objectives • Identify and select “cases”: • Select “controls” • Collect data: measure level of “exposure” in both cases and controls • Analyze data: compare the exposure frequencies in those with and without disease
  • 47.
    Case-control studies Choosing casesand controls in case-control study • Ideally, cases are selected from a clearly defined population, often called the source population, and controls are selected from the same population that yielded the cases • Control group should be representative of the population from which the cases are derived, typically called the source population
  • 48.
    Case-control studies Choosing controls •Two common types of controls are population based and hospital-based controls Population-based controls • In population-based case-control study, controls are selected from the community • An advantage is that cases and controls come from the same source population, so they are similar in some way • A disadvantage is that it is difficult to obtain population lists and to identify and enroll subjects
  • 49.
    Case-control studies Hospital-based controls •In a hospital-based case-control study, controls are selected from hospital patients with illnesses other than the disease of interest • An advantage is that hospital controls are easily accessible, tend to be cooperative, and are inexpensive • A disadvantage is that hospital-based controls are not likely to be representative of the source population that produced the cases
  • 50.
  • 51.
    Case-control studies Recall informationin Case-control study • Information on some past exposures depends on memory of events from both cases and controls • Recall bias occurs when the recall is better among cases than controls because of the presence of the disease • Consequently, a false association may be found between exposure and disease
  • 52.
    Case-control studies Case-control studyStrengths • Good for studying rare outcomes • Can examine many exposures at the same time • Quick & Cheap • Provides Odds Ratio
  • 53.
    Case-control studies Limitation • Cannotmeasure Incidence, Prevalence and Relative Risk • Can only study one outcome • Not suitable for rare exposures • Highly liable to selection bias and recall bias • Difficult to establish temporal relationship of exposure- disease relationship i.e. Does not establish sequence of events
  • 54.
    Example of Case-controlstudy In a study examining the relationship between the chili pepper consumption and gastric cancer, the researchers sampled 910 study subjects, 213 with gastric cancer and 697 controls, and asked their prior history of chili pepper consumption. The researchers found that,204 and 552 of the total cases and controls had the history of chili pepper consumption respectively. a) Draw 2-by-2 crosstab? b) Calculate OR?
  • 55.
    Example … a. b. OR= 𝑎𝑑 𝑏𝑐 = 204𝑥 145 552 𝑥 9 = 5.95 Ate chili pepper Gastric cancer Yes No Total Yes 204 552 756 No 9 145 154 Total 213 697 910
  • 56.
    Cohort study What isa cohort? • A well-defined group of people who share a common characteristic/ experience followed-up for specified period of time • Examples – Exposure cohort: individuals assembled as a group based on some common exposure e.g. asbestos exposure in ship yards 56
  • 57.
    Cohort study • Selectgroup of disease-free people who are classified according to a specific exposure • Follow them over time for a specified period of time to see the occurrence of outcomes of interest in groups • Measure and compare the incidence of outcome between exposed and unexposed groups • Subjects are sampled by their exposure status57
  • 58.
  • 59.
    Cohort study • Directionality: Exposure to Outcome • Temporal relationship between observations of exposure(E) and outcome(O) • Cohort studies can be either – Prospective – Retrospective 59
  • 60.
  • 61.
    Prospective cohort study •Investigator starts the study (from the beginning) with the identification of the population and the exposure status (exposed/not exposed groups) • Follow them (over time) for the development of disease(future follow-up) • Time frame of prospective cohort study: From present to future • Takes relatively long time to complete the study 61
  • 62.
  • 63.
    Prospective cohort study:Example Framingham Study Objectives: To study the impact of several factors on incidence of cardiovascular diseases Exposures: Blood pressure, blood cholesterol level, electrocardiogram abnormalities, smoking, body weight, diabetes, physical exercise, etc. Multiple Outcomes: Coronary heart disease, stroke, congestive heart failure, peripheral arterial disease 63
  • 64.
    Prospective cohort study:Example  The study started with a defined population  There were several hypotheses to be tested -Different exposures and different outcomes  For each exposure, investigators identified the “exposed "and “not exposed "groups  For each exposure, the participants were followed for the development of disease  Different exposures were studied, as well as different diseases 64
  • 65.
    Timeline Milestones fromthe Framingham Study  1948:start of the Framingham Heart Study  1960:cigarette smoking found to increase risk of heart disease  1961:cholesterol level, blood pressure, and ECG abnormalities found to increase risk of heart disease  1967:physical activity found to reduce risk of heart disease; obesity to increase the risk  1970:high blood pressure found to increase the risk of stroke  1971:Framingham Offspring Study initiated to assess familial and genetic factors as determinants of coronary heart disease 65
  • 66.
  • 67.
    Retrospective cohort study Investigatoruses existing data collected in the past to identify the population and the exposure status (exposed/not exposed groups) Determine disease status at the present time (no future follow-up) Time frame of retrospective cohort study: From past to present 67
  • 68.
    Is Prospective orRetrospective cohort study???????????? In an "outcomes" analysis of coronary bypass surgery, health services researchers identified charts of all patients diagnosed with three vessel disease at three major clinical centers during the past ten years. These patients are separated into those who initially were treated surgically and those who were initially treated medically. Aggregate results for mortality and a variety of other outcome variables were compiled for each group, to produce prognostic profiles for those initially treated medically vs. those who received immediate surgery. 68
  • 69.
    Is Prospective orRetrospective cohort study???????????? The pediatricians wanted to determine if there is a difference in the incidence of croup between the babies who are breastfed and those who are not breastfed. They followed a group of babies who are breastfed for six months following birth compared to another group of babies who are not breastfed for six months following birth. All the babies were free of croup when the pediatricians started the study. Of 100 breastfed babies, 2 babies developed the croup while of 50 babies who are not breastfed, 5 developed the croup. 69
  • 70.
    Cohort study Features tolook for in a cohort study • Is selection bias present? • Are the exposed and unexposed groups similar in all important respects except the exposure status? • What steps were taken to minimize information bias? • Is the outcome identified in the same way for both groups? 70
  • 71.
    Cohort study • Howcomplete was the follow-up of both groups? • What effort were made to limit loss to follow-up? • Was loss to follow-up similar in both groups? • Were potential cofounding factor present and controlled in the analysis? • Did the investigators anticipated and gather information on potential confounding factors? • What method(s) were used to assess and control confounding? 71
  • 72.
    Cohort study Steps ina cohort study • Define the study’s objectives • Identify the study cohort • Measure level of exposure and categorize cohort into “exposed” and “unexposed” groups • Follow groups • Measure outcome or “disease” (dependent) variable • Analyze data: compare incidence rates in the different exposure groups 72
  • 73.
  • 74.
    Example of Cohortstudy Researchers conducted a 20 year prospective cohort study to assess a possible association between eating fish and heart disease. They found that, of the 200 subjects who ate fish, 10 developed heart disease while of the 400 subjects who did not eat fish, 10 developed heart disease. a) Draw 2-by-2 table? b) Calculate RR? 74
  • 75.
    Example … a. b. RR= 𝑎 𝑎+𝑏 𝑐 𝑐+𝑑 = 10 10+190 10 10+390 =2 Ate fish Heart disease Yes No Total Yes 10 190 200 No 10 390 400 Total 20 580 600
  • 76.
    Cohort study Strengths • Candirectly measure incidence rates • Establishes time sequence for causality • Eliminates recall bias • Allows for accurate measurement of exposure variables • Best for studying rare exposures • Can measure multiple outcomes at the same time • Can adjust for confounding variables • Can calculate relative risk 76
  • 77.
    Cohort study Limitation • Expensive •Time consuming • Relatively poor for studying rare diseases or outcomes • Selection bias • Exposure may change over time • Disease may have a long pre-clinical phase • Potential for loss of study subjects to follow-up • May require large study groups 77
  • 78.
    Experimental study design •A study in which a population is selected for a planned trial of a regimen, whose effects are measured by comparing the outcome of the regimen in the experimental group versus the outcome of another regimen in the control group • Such designs are differentiated from observational designs by the fact that there is manipulation of the study factor (exposure), and randomization (random allocation) of subjects to treatment (exposure) groups78
  • 79.
  • 80.
  • 81.
    Experimental study design •The investigator assigns the exposure variable ß Prospective in nature • Randomized Clinical Trial(RCT): individual study subject • Community Intervention Trial(CIT): study subject is the “community” 81
  • 82.
    Experimental study design Whyperformed? 1. Provide stronger evidence of the effect (outcome) compared to observational designs, with maximum confidence and assurance 2. Yield more valid results, as variation is minimized and bias controlled 3. Determine whether experimental treatments are safe and effective under “controlled environments” (as opposed to “natural settings” in observational designs) 82
  • 83.
    Experimental study design Stepsin an Experimental study • Define the study’s objectives • Identify the target population • Recruit volunteers from the target population • Random allocation of volunteers into two groups (assign study subjects to exposure and non- exposure group) 83
  • 84.
    Experimental study design •Assign exposure (independent) variable. Consider blinding • Follow groups prospectively • Measure outcome (dependent) variable • Analyze data: compare incidence rates in exposed (treated) and unexposed (untreated) 84
  • 85.
    Experimental study design •Time frame of Experimental study: From present to future • Random allocation • Blinding • The most serious objections to Experimental studies are ethical issues 85
  • 86.
  • 87.
    Experimental study design Strengths: •Best measure of causal relationship • Best design for controlling bias and confounding • Can measure multiple outcomes Limitation : • High cost and time-consuming • Ethical issues may be a problem 87
  • 88.
    Example of Experimentalstudy • Researchers are interested in determining whether the advice given during routine physical examination is effective in encouraging patients to stop smoking. In a study of current smokers, one group of patients was given a brief talk about hazards of smoking and was encouraged to quit. A second group received no advice pertaining to smoking. All the patients were given a follow up examination/assessing. In a sample of 114 patients who received advice, 11 reported, they had quit smoking and in a sample of 96 patients who had not received advice, 7 quit smoking. 88
  • 89.