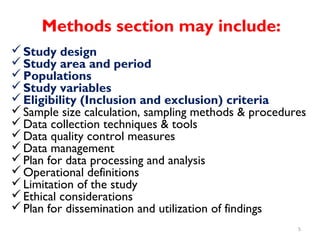
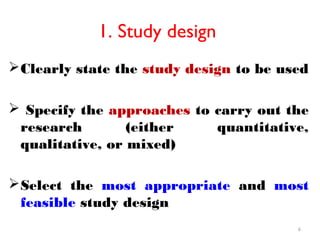
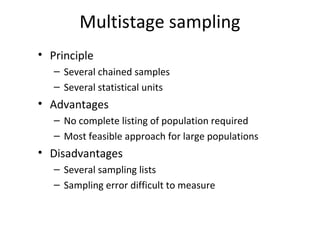
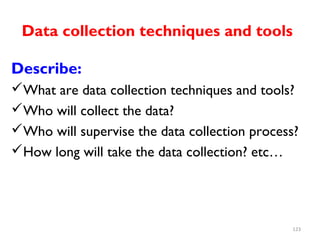
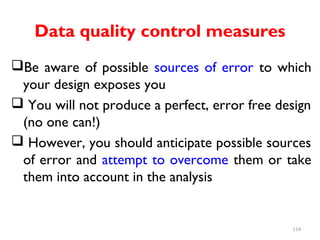
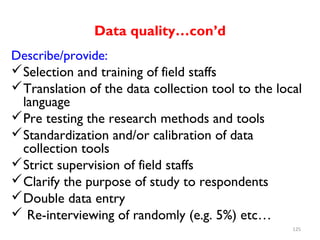
The document discusses research methodology and methods and materials sections of research proposals. It provides details on what should be included in the methods and materials section such as the study design, population, variables, data collection plan, and limitations. The methods section is important as it shows how the research will achieve its objectives and answer the research questions.
A great presentation from a well versed friend in research and EBM, Dr Yaser Faden.
This is a simple introduction to study design with an accompanying workshop to simplify the different types of research study designs.
A great presentation from a well versed friend in research and EBM, Dr Yaser Faden.
This is a simple introduction to study design with an accompanying workshop to simplify the different types of research study designs.
Sample Project Proposal Template by Fida KarimFida Karim 🇵🇰
Project Proposal template-training on proposal writing and resource mobilization by fida karim (1)
training on proposal writing & resource mobilization ,
Sample Project Proposal Template by Fida Karim,
Sample Proposal Template by Fida Karim
Methods refers to ways through which messages are conveyed to achieve a desired behavioral changes in a target audience.
In health education it is not enough to decide what will be done; by whom and when, we also need to decide how it will be done (methods).
The most ambitious definition of health is that proposed by WHO in 1948: “health is a state of complete physical, mental, and social well-being and not merely the absence of disease or infirmity.” but,
Practical definitions of health and disease are needed in epidemiology, which concentrates on aspects of health that are easily measurable and amenable to improvement.
Definitions of health states used by epidemiologists tend to be simple.
These lecture slides, by Dr Sidra Arshad, offer a quick overview of physiological basis of a normal electrocardiogram.
Learning objectives:
1. Define an electrocardiogram (ECG) and electrocardiography
2. Describe how dipoles generated by the heart produce the waveforms of the ECG
3. Describe the components of a normal electrocardiogram of a typical bipolar leads (limb II)
4. Differentiate between intervals and segments
5. Enlist some common indications for obtaining an ECG
Study Resources:
1. Chapter 11, Guyton and Hall Textbook of Medical Physiology, 14th edition
2. Chapter 9, Human Physiology - From Cells to Systems, Lauralee Sherwood, 9th edition
3. Chapter 29, Ganong’s Review of Medical Physiology, 26th edition
4. Electrocardiogram, StatPearls - https://www.ncbi.nlm.nih.gov/books/NBK549803/
5. ECG in Medical Practice by ABM Abdullah, 4th edition
6. ECG Basics, http://www.nataliescasebook.com/tag/e-c-g-basics
micro teaching on communication m.sc nursing.pdfAnurag Sharma
Microteaching is a unique model of practice teaching. It is a viable instrument for the. desired change in the teaching behavior or the behavior potential which, in specified types of real. classroom situations, tends to facilitate the achievement of specified types of objectives.
Title: Sense of Smell
Presenter: Dr. Faiza, Assistant Professor of Physiology
Qualifications:
MBBS (Best Graduate, AIMC Lahore)
FCPS Physiology
ICMT, CHPE, DHPE (STMU)
MPH (GC University, Faisalabad)
MBA (Virtual University of Pakistan)
Learning Objectives:
Describe the primary categories of smells and the concept of odor blindness.
Explain the structure and location of the olfactory membrane and mucosa, including the types and roles of cells involved in olfaction.
Describe the pathway and mechanisms of olfactory signal transmission from the olfactory receptors to the brain.
Illustrate the biochemical cascade triggered by odorant binding to olfactory receptors, including the role of G-proteins and second messengers in generating an action potential.
Identify different types of olfactory disorders such as anosmia, hyposmia, hyperosmia, and dysosmia, including their potential causes.
Key Topics:
Olfactory Genes:
3% of the human genome accounts for olfactory genes.
400 genes for odorant receptors.
Olfactory Membrane:
Located in the superior part of the nasal cavity.
Medially: Folds downward along the superior septum.
Laterally: Folds over the superior turbinate and upper surface of the middle turbinate.
Total surface area: 5-10 square centimeters.
Olfactory Mucosa:
Olfactory Cells: Bipolar nerve cells derived from the CNS (100 million), with 4-25 olfactory cilia per cell.
Sustentacular Cells: Produce mucus and maintain ionic and molecular environment.
Basal Cells: Replace worn-out olfactory cells with an average lifespan of 1-2 months.
Bowman’s Gland: Secretes mucus.
Stimulation of Olfactory Cells:
Odorant dissolves in mucus and attaches to receptors on olfactory cilia.
Involves a cascade effect through G-proteins and second messengers, leading to depolarization and action potential generation in the olfactory nerve.
Quality of a Good Odorant:
Small (3-20 Carbon atoms), volatile, water-soluble, and lipid-soluble.
Facilitated by odorant-binding proteins in mucus.
Membrane Potential and Action Potential:
Resting membrane potential: -55mV.
Action potential frequency in the olfactory nerve increases with odorant strength.
Adaptation Towards the Sense of Smell:
Rapid adaptation within the first second, with further slow adaptation.
Psychological adaptation greater than receptor adaptation, involving feedback inhibition from the central nervous system.
Primary Sensations of Smell:
Camphoraceous, Musky, Floral, Pepperminty, Ethereal, Pungent, Putrid.
Odor Detection Threshold:
Examples: Hydrogen sulfide (0.0005 ppm), Methyl-mercaptan (0.002 ppm).
Some toxic substances are odorless at lethal concentrations.
Characteristics of Smell:
Odor blindness for single substances due to lack of appropriate receptor protein.
Behavioral and emotional influences of smell.
Transmission of Olfactory Signals:
From olfactory cells to glomeruli in the olfactory bulb, involving lateral inhibition.
Primitive, less old, and new olfactory systems with different path
Pulmonary Thromboembolism - etilogy, types, medical- Surgical and nursing man...VarunMahajani
Disruption of blood supply to lung alveoli due to blockage of one or more pulmonary blood vessels is called as Pulmonary thromboembolism. In this presentation we will discuss its causes, types and its management in depth.
Report Back from SGO 2024: What’s the Latest in Cervical Cancer?bkling
Are you curious about what’s new in cervical cancer research or unsure what the findings mean? Join Dr. Emily Ko, a gynecologic oncologist at Penn Medicine, to learn about the latest updates from the Society of Gynecologic Oncology (SGO) 2024 Annual Meeting on Women’s Cancer. Dr. Ko will discuss what the research presented at the conference means for you and answer your questions about the new developments.
- Video recording of this lecture in English language: https://youtu.be/lK81BzxMqdo
- Video recording of this lecture in Arabic language: https://youtu.be/Ve4P0COk9OI
- Link to download the book free: https://nephrotube.blogspot.com/p/nephrotube-nephrology-books.html
- Link to NephroTube website: www.NephroTube.com
- Link to NephroTube social media accounts: https://nephrotube.blogspot.com/p/join-nephrotube-on-social-media.html
Factory Supply Best Quality Pmk Oil CAS 28578–16–7 PMK Powder in Stockrebeccabio
Factory Supply Best Quality Pmk Oil CAS 28578–16–7 PMK Powder in Stock
Telegram: bmksupplier
signal: +85264872720
threema: TUD4A6YC
You can contact me on Telegram or Threema
Communicate promptly and reply
Free of customs clearance, Double Clearance 100% pass delivery to USA, Canada, Spain, Germany, Netherland, Poland, Italy, Sweden, UK, Czech Republic, Australia, Mexico, Russia, Ukraine, Kazakhstan.Door to door service
Hot Selling Organic intermediates
These simplified slides by Dr. Sidra Arshad present an overview of the non-respiratory functions of the respiratory tract.
Learning objectives:
1. Enlist the non-respiratory functions of the respiratory tract
2. Briefly explain how these functions are carried out
3. Discuss the significance of dead space
4. Differentiate between minute ventilation and alveolar ventilation
5. Describe the cough and sneeze reflexes
Study Resources:
1. Chapter 39, Guyton and Hall Textbook of Medical Physiology, 14th edition
2. Chapter 34, Ganong’s Review of Medical Physiology, 26th edition
3. Chapter 17, Human Physiology by Lauralee Sherwood, 9th edition
4. Non-respiratory functions of the lungs https://academic.oup.com/bjaed/article/13/3/98/278874
Explore natural remedies for syphilis treatment in Singapore. Discover alternative therapies, herbal remedies, and lifestyle changes that may complement conventional treatments. Learn about holistic approaches to managing syphilis symptoms and supporting overall health.
Title: Sense of Taste
Presenter: Dr. Faiza, Assistant Professor of Physiology
Qualifications:
MBBS (Best Graduate, AIMC Lahore)
FCPS Physiology
ICMT, CHPE, DHPE (STMU)
MPH (GC University, Faisalabad)
MBA (Virtual University of Pakistan)
Learning Objectives:
Describe the structure and function of taste buds.
Describe the relationship between the taste threshold and taste index of common substances.
Explain the chemical basis and signal transduction of taste perception for each type of primary taste sensation.
Recognize different abnormalities of taste perception and their causes.
Key Topics:
Significance of Taste Sensation:
Differentiation between pleasant and harmful food
Influence on behavior
Selection of food based on metabolic needs
Receptors of Taste:
Taste buds on the tongue
Influence of sense of smell, texture of food, and pain stimulation (e.g., by pepper)
Primary and Secondary Taste Sensations:
Primary taste sensations: Sweet, Sour, Salty, Bitter, Umami
Chemical basis and signal transduction mechanisms for each taste
Taste Threshold and Index:
Taste threshold values for Sweet (sucrose), Salty (NaCl), Sour (HCl), and Bitter (Quinine)
Taste index relationship: Inversely proportional to taste threshold
Taste Blindness:
Inability to taste certain substances, particularly thiourea compounds
Example: Phenylthiocarbamide
Structure and Function of Taste Buds:
Composition: Epithelial cells, Sustentacular/Supporting cells, Taste cells, Basal cells
Features: Taste pores, Taste hairs/microvilli, and Taste nerve fibers
Location of Taste Buds:
Found in papillae of the tongue (Fungiform, Circumvallate, Foliate)
Also present on the palate, tonsillar pillars, epiglottis, and proximal esophagus
Mechanism of Taste Stimulation:
Interaction of taste substances with receptors on microvilli
Signal transduction pathways for Umami, Sweet, Bitter, Sour, and Salty tastes
Taste Sensitivity and Adaptation:
Decrease in sensitivity with age
Rapid adaptation of taste sensation
Role of Saliva in Taste:
Dissolution of tastants to reach receptors
Washing away the stimulus
Taste Preferences and Aversions:
Mechanisms behind taste preference and aversion
Influence of receptors and neural pathways
Impact of Sensory Nerve Damage:
Degeneration of taste buds if the sensory nerve fiber is cut
Abnormalities of Taste Detection:
Conditions: Ageusia, Hypogeusia, Dysgeusia (parageusia)
Causes: Nerve damage, neurological disorders, infections, poor oral hygiene, adverse drug effects, deficiencies, aging, tobacco use, altered neurotransmitter levels
Neurotransmitters and Taste Threshold:
Effects of serotonin (5-HT) and norepinephrine (NE) on taste sensitivity
Supertasters:
25% of the population with heightened sensitivity to taste, especially bitterness
Increased number of fungiform papillae
MANAGEMENT OF ATRIOVENTRICULAR CONDUCTION BLOCK.pdfJim Jacob Roy
Cardiac conduction defects can occur due to various causes.
Atrioventricular conduction blocks ( AV blocks ) are classified into 3 types.
This document describes the acute management of AV block.
ARTIFICIAL INTELLIGENCE IN HEALTHCARE.pdfAnujkumaranit
Artificial intelligence (AI) refers to the simulation of human intelligence processes by machines, especially computer systems. It encompasses tasks such as learning, reasoning, problem-solving, perception, and language understanding. AI technologies are revolutionizing various fields, from healthcare to finance, by enabling machines to perform tasks that typically require human intelligence.
2. Components of a research proposal
Title
Summary
Introduction
Objective
Methods and materials
Ethical consideration
Dissemination and utilization of findings
Work plan
Budget
References
Annexes
2
3. Methods and Materials
The methods or procedures section is really the heart of
the research proposal
Methods/procedures show how you will
achieve the objectives and
answer the research question
Indicates the methodological steps you will take
to answer every question,
to test every hypothesis or
to address every objective
3
4. Methods and Materials…
• There should be a very clear link between the
methods you describe in this section and the
objectives you have previously defined.
• Be explicit in your writing and state exactly how
– the methods you have chosen will fulfil your objectives &
– It will help to deal with the needs/problems on which your
proposal is focused
5. Methods section may include:
Study design
Study area and period
Populations
Study variables
Eligibility (Inclusion and exclusion) criteria
Sample size calculation, sampling methods & procedures
Data collection techniques & tools
Data quality control measures
Data management
Plan for data processing and analysis
Operational definitions
Limitation of the study
Ethical considerations
Plan for dissemination and utilization of findings
5
6. 1. Study design
Clearly state the study design to be used
Specify the approaches to carry out the
research (either quantitative,
qualitative, or mixed)
Select the most appropriate and most
feasible study design
6
7. Epidemiologic studies
• Help to answer questions:
– How big is the problem (magnitude)?
– Who has the problem? When and where?
– What causes the problem?
– Are certain factors associated with the problem?
– What will happen if the suspected factors are removed
or reduced?
– What is the effect of a particular intervention on the
problem? New drug? Health education?
– What are the possible solutions?
8. • The selection of study design depends on:
• The type of problem
• The current knowledge about the problem
• Availability of resources
• Different research questions may require
different study designs
o The selection of an appropriate study design for the
study is the most important decision the investigator
has to make.
9. 2. Population
The population under consideration should be
clearly defined in terms of place, time, and other
relevant criteria
In this sub-section, identify:
– Source (Reference or target population)
population
– Study population
– Sampling unit: unit measurement of source
population
– Study unit: a direct source of information
10. Study population
Sampling unit: unit measurement of source population
Study unit: a direct source of information
11.
12. Eligibility criteria
Inclusion criteria:
– identify eligible subjects for the study
Exclusion criteria:
– to systematically exclude subjects from the
study population
–justify why exclusion is important
–Exclusion is from the domain
12
13. Study Variables
• A variable is a characteristic of a person,
object or phenomenon, which can take on
different values.
• Variables may be:
– Numerical (values can be expressed in numbers-
eg. Age, income
– Non-numerical characteristics (categorical)
e.g. sex, treatment outcome
14. Variables
• In health research we often look for associations.
• Hence, it is important to make a distinction between
dependent and independent variables.
15. Independent variable(X) :
• Also known as predictor = explanatory
variables
• a variable that attempts to explain the
variation in dependent variable (Y).
• factor that influence the outcome variable
16. Dependent variable (Y)/outcome variable:Dependent variable (Y)/outcome variable:
It is the outcomeIt is the outcome ((response)response) of a study,of a study, vary
in relation to the independent variables, and
results can be predicted
17. Dependent…
• Eg. Association between smoking and lung
cancer
• Dependent variable= developing lung cancer
(yes, No)
• Independent variable= smoking (yes, No)
20. 1. Descriptive Epidemiology
Describe patterns of disease occurrence within a
population in relation to person, place and time
♣ Used to identify any health problems that may exist
♣ Generates idea(s)/ hypothesis for presence of
association between risk factor and illness
♣Frequently encountered approach
21. 1. Population as study subject
o Correlational /ecological studies
Individual as study subjects
o Case report (Single case)
o Case series (few cases)
o Cross-sectional study (survey)
Categories of descriptive statistics
22. 2. Analytical Epidemiology
Uses comparison groups to establish an association
between risk factors and illness in the two groups
♣ Identify the cause (s) of the problem
♣ Concerned with determinants of disease,
• the reasons for low or high frequency of a disease
♣ Tests hypotheses
23. 2.1 Observational studies = The investigator simply
observes the natural course of events or an outcome
of interest
o Case-control study
o Cohort study
2.2 Experimental / intervention studies = The
investigator allocates the exposure and then follow
the subjects for the subsequent development of
disease
Categories of analytic epidemiological studies
26. Characteristics of Persons
“Who is getting the disease?”
Age, sex, religion, socio-economic status, race
• Young vs old, males vs females, rich vs poor, more
educated vs less educated, black vs white, etc
27. Characteristics of Place
“Where are the rates of disease highest/ lowest?”
• Urban vs rural, some regions more affected than others?
• National vs international?
• High altitude or low altitude?
• Polluted areas or unpolluted areas?
• Mountainous vs valley
• Adequate rainfall or little rainfall areas?
Differences in frequency of diseases are related to variations
in climate, altitude, topography, geology and in general
environment.
28. Characteristics of Time
“When does the disease occur commonly/ rarely?”
Was there a sudden increase over a shorter period of
time?
Is the problem greater during rainy or dry season?
“Is the frequency of the disease now different from the
corresponding frequency in the past?”
Is the problem gradually increasing/ decreasing?
29. Uses of Descriptive Studies
Describe the pattern of disease occurrence
Describe the problem in terms of person, place and
time
Generate numbers of events (frequency)
Help to calculate ratio, proportion and rates
Program planning / resource allocation
Identify problems to be studied by analytic methods
Generate hypothesis
30. Types of Descriptive Studies
• Ecological / Correlational studies
– The unit of observation is the entire population to
compare disease frequency between different groups
• During the same period of time among different
populations or in the same population at different
points in time.
– Comparison of rates (morbidity or mortality) across
geographical areas (or regions).
31. Ecologic / Correlational
• Advantages:
– useful for the formulation of hypotheses
– Quick and inexpensive
– Often use already available information (secondary
data)
32. Ecologic …
– Disadvantages:
• Based on averages and may miss actual contributing
factors
• Unable to link exposure with disease at individual level
• Lack of ability to control for potential confounders
• Presence or absence of correlation does not imply
valid statistical association
33. Types of Descriptive …Cont’d
• Case report or case series
– Detailed report of a single patient (case report) or a
group of patients (case series) with a given disease
– Document unusual medical occurrences
– Gives the first clues in the identification of new disease
and adverse effects of exposures
– An important link between clinical medicine and
epidemiology
– Most common types of studies
34. Types of Descriptive …Cont’d
• Case reports and case series played a
role in the early recognition of AIDS
– In 1980 and 1981, five cases of Pneumocystis carini were
reported among young homosexual men in Los Angeles.
Previously, it occurred in older cancer patients with
compromised immunity
– In 1981, large number of cases of Kaposi’s sarcoma
happened in young homosexual men. Previously this
exclusively occurred in elderly men and women equally
35. Case reports / case series
Advantages
– Simple, quick, inexpensive
– Formulate hypothesis
Disadvantages
– Can’t be used to test hypotheses
– Based on the experience of one or few people
(small sample size), it can be coincidence
– Lacks comparison group
36. Cross-Sectional Studies
• Often called prevalence study. E.g., KAP, DHS, etc
• Collection of data at one point in time at individual level
• Presence or absence of both exposure and disease is
assessed at the same time
• Provide “snapshot” of health experience
• Used to assess the health care status and health care
needs of a population
37. Cross-Sectional Studies
Advantages Disadvantages
• Quick and inexpensive
• Used for planning
• Initial step
• Multiple factors/
outcomes
• Provide early clues for
hypothesis generation
• Temporal relationship of
exposure and disease not
distinguishable (whether
exposure or disease came
first unknown)
• Bias in measuring exposure
• No incidence/ relative risk
• No hypothesis testing
39. Analytical Studies
• Purpose/aim
– Focus on determinants of cause
– Search for cause and effect.
– Answer questions like: Why? How?
– To test whether certain factors are associated with disease or
not
– Test hypothesis about causal relationship
• Proof
– Quantify the association between exposure and outcome
40. Analytical Studies
• Basic features
– Appropriate comparison group needed
• Exposed Vs Control
– It is the use of comparison group that allows
testing of epidemiologic hypotheses
41. Two types of Analytic Studies
Difference lies in the role of the
investigator
- Observational studies
• The investigator simply observes the natural course of an event
• The investigator measures but does not intervene.
– Interventional studies
• The investigator assigns study subjects to exposure and non-
exposure, then follows to measure for disease occurrence.
• The investigator manipulates the intervention or exposure.
42. Observational Studies
• Temporal relationship between observations of
Exposure (E) and Disease (D):
• Direction
– Forward: starts with E
– Backward: starts with D
• Chronological relationship between onset of study and
occurrence of D:
• Timing
– Prospective: study onset -----> D
– Retrospective: D <--------- study onset
43. Observational Studies
Case Control Vs Cohort
– Case-control = Both the exposure and
disease have already occurred at the time of the
study
– Cohort = Disease free exposed and non-
exposed people are followed up to measure the
outcome
45. • Case-Control Study:
– Compares people with disease (case) and without
disease (control)
– to determine the exposure status by looking
backward in time.
• Data are analyzed whether exposure was different for
cases and for controls
• Higher proportion of risk factor among cases than
controls suggests association or lesser proportion of risk
factors among case
• Very common type of epidemiologic studies
48. Selection of cases
• Subjects selected on the basis of disease
• A case should be clearly defined with regard to
specific characteristic of disease
• Needs standard diagnostic criteria
• Sources of Cases:
– hospital setting = hospital-based case-control
– defined general population = population-based
– disease registries with complete records
49. Selection of Controls
• Be comparable to the cases: controls should have the same
characteristics as the cases (except for the disease of interest)
• Must have the same opportunity for exposure as a case
• Must be subject to the same inclusion and exclusion criteria as
cases
• Involves consideration of a number of issues: scientific,
economic and practical considerations
50. • Selection of controls may involve matching:
– Cases and controls have the same (or similar)
characteristics other than the disease
– Ensures comparability
– Age, sex, race, socio-economic status, etc.
• These factors are associated with the incidence of most
diseases
51. Sources of Controls
• Hospital controls: patients attending or admitted to the same
institution for other diseases
• Relatives, friends or neighborhood
• Community (population) controls: selected from the same source
population as the cases
– More expensive
52. Data collection
• Interviews, questionnaires and/or examination; or
surrogates (spouses or mothers of children) or from
medical records
• Should be objective or well standardized
• Better not to know cases or controls (blinding)
• Same procedure for cases and controls should be
applied
53. Case-Control Studies
• Advantages
– Rare disease, e.g., cancer of a specific organ
– Suitable for the evaluation of diseases with long latent
periods
– Quick and inexpensive
– Relatively efficient, small sample size
– Little problem with attrition
– Can examine multiple etiologic exposures
– No ethical problems
54. Case-Control Studies
• Disadvantages
– Inefficient for rare exposures
– No calculation of rates and risks
– In some situations, the temporal relationship
between exposure and disease may be difficult to
establish Temporal E – D uncertainty
– Prone to selection and recall bias
– Selection of control difficult
55. Cohort Studies
• Disease free exposed and non-exposed people
are followed up and then outcome events are
picked up when they occur
• Measure and compare the incidence of disease
in two or more study cohorts
• Usually prospective or forward looking.
• Are also called longitudinal studies.
56. What is a cohort?
• A group of persons
– sharing the same experience
– followed for a specified period of time
• Examples
– birth cohort
– workers at a chemical plant
– graduating university class
– attendants of this course
58. Types of Cohort Studies
• Based on the starting point of the study
– Prospective (classical)
– Retrospective (historical)
59.
60. Prospective Cohort Study
+
-
+ -
ill
exp
+
-
exp
Disease
occurrence
Study startsExposure
occurrence
Prospective assessment
of disease
Selection based
on exposure
Time
64. • Limitations of retrospective cohort:
– All relevant variables may not be available in the
original records
– Difficult to ascertain that the study population was
free from the disease at the start
– Loss of records, incomplete data
65. Data collection for Cohort Studies
• Interview with follow-up
• Medical records monitored over time
• Medical examinations and laboratory testing
• Apply equally to exposed and non-exposed
66. Advantages of cohort studies
• Directly measure relative risk or rate
• Measures of effect have clear meaning and are easily
understandable
• Temporal relationship between exposure & disease is
clear
• Prospective cohort studies less susceptible to selection
bias because outcome not known
• Well suited to rare exposures
67. Disadvantages of cohort studies
• Large sample size
• Inefficient for disease with latency period
• Loss to follow-up
• Exposure can change over time
• Multiple exposures = difficult
• High cost
• Time consuming
68. Summary
• Cohort studies allow measure of risk
• Case-control studies are rapid, but not
measure risk; only estimate RR
• In the ideal world: prefer cohort to case-
control study
• In the real world: case-control studies usually
do the job
69. Experimental/Intervention Studies
o Investigator assigns subjects to exposure and
non-exposure and makes follow up to measure
for the occurrence of a disease.
o It is usually prospective.
o Provides high quality data
o Random allocation
o Assign E randomly, follow for D
70. Source: partially adapted from WHO, 1993
Design of an Experimental Study
Investigator determines
exposure status through
Random allocation
71. When to choose an experimental design?
• Generally reserved for relatively "mature” research
questions
• A lot has to be done before embarking on an
experimental study
72. When to choose an experimental design?
• When:
– the research question cannot be answered by
observational studies
– earlier observational studies have not answered the
research question
– existing knowledge is not sufficient to determine
clinical or public health policy
– an experiment is likely to provide an important
extension of this knowledge
73. Types of Experimental Studies
• Randomized Clinical Trial (RCT)
• Community Intervention Trial (CIT)
74. Randomized Clinical Trial (RCT)
• Randomization is done on individuals
– Each patient is given an equal chance of being assigned to
either group (e.g., treatment vs. placebo)
• Blinding (masking) possible:
– Double-blind = Neither the patients nor the investigators
responsible for outcome assessment know what treatment
she/he is getting
– Single-blind = The investigator alone is aware of the group
to which a participant has been assigned
– Un-blinded = Both the investigator and patient are aware of
the treatment assignment.
• Most common
76. Community Intervention Trials (CITs)
• Randomization is done on groups or
communities rather than individuals
– E.g., New drug or vaccine testing (some communities receive vaccine others
placebo through random assignment)
• Blinding not possible
• Contaminations and co-interventions serious
problems
77. Problems of Intervention Studies
• More difficult to design and conduct
• Ethical issues
– Withholding
– Exposing
• Feasibility
– Very large sample size required
• Cost
– Very expensive
78. Advantages of Intervention Studies
• GOLD STANDARD = Randomized, placebo
controlled, blinded clinical trials
• The ability to assign exposure
• The ability to control confounding
• Findings can be replicated = Generalizability
80. Summary Points on Study Designs
• Two types of epidemiological studies
– Descriptive
– Analytic
• Descriptive
– Case reports/Case series
– Ecological
– Cross-sectional
• Analytical
– Observational: Case-control & Cohort
– Experimental
81. Operational definition
For some variables it is sometimes not possible
to find meaningful categories unless the variables
are made operational with one or more precise
indicators
Operationalizing variables means that you make
them measureable
81
82. Operational Versus standard definition
Standard definitions are widely/universally
accepted definitions of the variable
E.g. “Obesity”-excessive fatness”, “overweight”
However, operational definition is heavily
influenced by considerations of practicability
during measuring
82
83. In general, operational definitions of variables are
used in order to:
– Avoid ambiguity
– Make the variables to be more measurable
Justification is needed for setting cut-off points
Example: Knowledge
83
84. Sample size and sampling techniques
Describe how the sample size is determined
Describe the methods of sample selection
If needed, use diagrams to simplify the sample
selection process (sampling procedures)
84
85. Sample size and sampling...con’d
The key reason for being concerned with
sampling is validity (internal and external validity)
The key word in sampling is representativeness
A representative sample has all the important
characteristics of the population from which it is
drawn
A sample is a representative of the population
under study
85
86. SAMPLE SIZE
Depending on:
1) Variability in the target population.
(If unknown, assume maximum variability)
2) Desired precision in the estimate
3) Desired confidence in the estimate
4) Feasibility
87. αand Confidence Level
α: The significance level of a test: the probability of
rejecting the null hypothesis when it is true
(or the probability of making a Type I error). It is usually
5% (0.05)
Confidence level: The probability that an estimate of a
population parameter is within certain specified limits of
the true value;
(commonly denoted by “1- α”, and is usually 95%).
88. Power and β
Power: The probability of correctly rejecting the
null hypothesis when it is false; commonly denoted
by “1- β”.
β : The probability of failing to reject the null
hypothesis when it is false
(or the probability of making a Type II error).
90. Precision
A measure of how close an estimate is to the true
value of a population parameter.
It may be expressed in absolute terms or relative to
the estimate.
It is denoted by d in sample size determination
91. SAMPLE SIZE
Sample Size Required for Estimating Population Mean
• The objective in interval estimation is to obtain
narrow intervals with high reliability
• The width of the interval is determined by the
magnitude of the quantity
92. Sample Size
Required for Estimating Proportions
• The formula requires the knowledge of p, the
proportion in the population possessing the
characteristic of interest.
– A pilot or preliminary sample. Observations used in the pilot
can be counted as part of the final sample
– Estimates may be available from previous studies and the
upper bound of p can be used in the formula
– If impossible to come with a better estimate, set p = 0.5 in
the formula to yield the maximum value of n
93. Sample Size Required for Estimating Proportions
Assuming random sampling and approximate normality in
the distribution of p,
Where q = 1 – p
n
Zα/2 P q
=
2
2
d
94. Finite Population Correction
• Finite Population Correction (FP)
•
– N = population size
– n = sample size
• Can be ignored when sample size is small in
comparison with the population size
96. Definition of sampling
Procedure by which some members of the
population are selected as representatives of
the entire population
97. Why sampling?
• Due to the variability of characteristics among
items in the population, researchers apply
scientific sample designs in the sample
selection process to reduce the risk of a
distorted view of the population, and they
make inferences about the population based
on the information from the sample survey
data.
98. Advantages of sampling:
• Feasibility: Sampling may be the only feasible method of
collecting the information.
• Reduced cost: Sampling reduces demands on resource such as
finance, personnel, and material.
• Greater accuracy: Sampling may lead to better accuracy of
collecting data
• Sampling error: Precise allowance can be made for sampling
error
• Greater speed: Data can be collected and summarized more
quickly
99. Disadvantages of sampling:
• There is always a sampling error.
• Sampling may create a feeling of
discrimination within the population.
• Sampling may be inadvisable where every unit
in the population is legally required to have a
record.
100. Errors in sampling
• i) Sampling error:
• Errors introduced due to errors in selection of a
sample.
• They cannot be avoided or totally eliminated.
ii) Non-sampling error:
- Observational error
- Respondent error
- Lack of preciseness of definition
- Errors in editing and tabulation of data
101. Concept of representativity
• Time
• Seasonality
• Day of the week
• Time of the day
• Place
• Urban
• Rural
• Persons
• Age
• Sex
• Other demographic characteristics
102. Definition of sampling terms
• Sampling unit
– Basic sampling unit (bsu) around which
sampling is planned
• Sampling frame
– Any list of all the sampling units in the
population
• Sampling scheme
– Method of selecting sampling units from
sampling frame
103. Why do we sample populations?
• Get information from large populations
• Study efficiency
• Obtain more accurate information
104. Type of samples
• Non-probability samples
– Convenience samples
• Biased
• Best or worst scenario
– Subjective samples
• Based on knowledge
• Time/resources constraints
• Probability samples
– Only sampling method that allows to draw
valid conclusions about population
105. Probability sampling:
• It is a sample obtained in a way that ensures
that every member of the population has a
known, non zero probability of being included
in the sample.
• Probability sampling involves the selection of a
sample from a population, based on chance.
• Probability sampling is more complex, more
time-consuming and usually more costly than
non-probability sampling.
106. Probability samples
• Random sampling
• Removes possibility of bias in selection of
subjects
• Each subject has a known probability of
being chosen
• Allows application of statistical theory to
results
107. Sampling error
• No sample is a perfect mirror image of the
population
• Magnitude of error can be measured in
probability samples
• Expressed by standard error
– of mean, proportion, differences, etc
• Function of
– sample size
– amount of variability in measuring factor of
interest
108. Methods used in probability samples
• Simple random sampling
• Systematic sampling
• Stratified sampling
• Cluster sampling
• Multistage sampling
109. Simple random sampling
• Principle
– Equal chance for each statistical unit
• Procedure
– Number all units
– Randomly draw units
• Advantages
– Simple
– Sampling error easily measured
• Disadvantages
– Need complete list of units
– Does not always achieve best representatively when there is
minority
110. Example: Simple random sampling
1 Albert D.
2 Richard D.
3 Belle H.
4 Raymond L.
5 Stéphane B.
6 Albert T.
7 Jean William V.
8 André D.
9 Denis C.
10 Anthony Q.
11 James B.
12 Denis G.
13 Amanda L.
14 Jennifer L.
15 Philippe K.
16 Eve F.
17 Priscilla O.
18 Frank V.L.
19 Brian F.
20 Hellène H.
21 Isabelle R.
22 Jean T.
23 Samanta D.
24 Berthe L.
25 Monique Q.
26 Régine D.
27 Lucille L.
28 Jérémy W.
29 Gilles D.
30 Renaud S.
31 Pierre K.
32 Mike R.
33 Marie M.
34 Gaétan Z.
35 Fidèle D.
36 Maria P.
37 Anne-Marie G.
38 Michel K.
39 Gaston C.
40 Alain M.
41 Olivier P.
42 Geneviève M.
43 Berthe D.
44 Jean Pierre P.
45 Jacques B.
46 François P.
47 Dominique M.
48 Antoine C.
111. Systematic sampling
• Principle
– A unit drawn every k units
– Equal chance of being drawn for each unit
• Procedure
– Calculate sampling interval (k = N/n)
– Draw a random number (≤ k) for starting
– Draw every k units from first unit
• Advantages
– Ensures representativity across list
– Easy to implement
• Disadvantages
– Dangerous if list has cycles
113. Stratified sampling
• Principle
– Classify population into homogeneous subgroups (strata)
– Draw sample in each strata
– Combine results of all strata
• Advantage
– More precise if variable associated with strata
– All subgroups represented, allowing separate conclusions about
each of them
• Disadvantages
– Sampling error difficult to measure
– Loss of precision if very small numbers sampled in individual
strata
114. Example: Stratified sampling
• Determine vaccination coverage in a country
• One sample drawn in each region
• Estimates calculated for each stratum
• Each strata weighted to obtain estimate for
country
115. Cluster sampling
• Principle
– Random sample of groups (“clusters”) of units
– In selected clusters, all units or proportion of units
included
• Advantages
– Simple as no list of units required
– Less travel/resources required
• Disadvantages
– Imprecise if clusters homogeneous
(large design effect)
– Sampling error difficult to measure
116. CLUSTER SAMPLING
The sampling unit is not a subject, but a group (cluster)
of subjects. It is assumed that the variability among clusters
is minimal, while within each cluster is representing the
general population
1. Define the number of clusters to be included
2. Compute a cumulative list with the populations
per each unit and a grand total
3. Divide the grand total by the number of clusters
and obtain the sampling interval
117. CLUSTER SAMPLE
6. By repeating the same procedure, identify all the clusters
7. In each cluster select a random sample using a sampling
frame of subjects (e.g. residents) or households.
4. Choose a random number and identify the first cluster
5. Add the sampling interval and identify the second
cluster
Advantage: easy to perform
Disadvantage: design effect
118. CLUSTER SAMPLING in EPI
Procedure: list of all villages (areas) with total population
village inhabitants Cumulative
1 34 34
2 60 94
3 30 124
4 76 200
5 315 515
.
. 4,715
divide the cumulative total by 30 clusters we wish to select
4,715 : 30= 157.1
119. EPI CLUSTER SAMPLING
choose from the cumulative distribution the clusters
by adding 157 (sampling interval)
4 124 124 * 1st cluster
5 76 200
6 315 515 ** 2nd 123+157=280
3th 280+157=437
.
.
in each village (area) choose 7 children
Total sample 30 X 7= 210
find a random number with three digits (= sampling interval) e.g. 123
120. Design effect
Global variance
p(1-p)
Var srs = ----------
n
Cluster variance
p= global proportion
pi= proportion in each stratum
n= number of subjects
k= number of strata
Σ (pi-p)²
Var cluster = -------------
k(k-1)
Design effect = ------------------
Var srs
Var clust
122. Multistage sampling
• Principle
– Several chained samples
– Several statistical units
• Advantages
– No complete listing of population required
– Most feasible approach for large populations
• Disadvantages
– Several sampling lists
– Sampling error difficult to measure
123. Data collection techniques and tools
Describe:
What are data collection techniques and tools?
Who will collect the data?
Who will supervise the data collection process?
How long will take the data collection? etc…
123
124. Data quality control measures
Be aware of possible sources of error to which
your design exposes you
You will not produce a perfect, error free design
(no one can!)
However, you should anticipate possible sources
of error and attempt to overcome them or take
them into account in the analysis
124
125. Data quality…con’d
Describe/provide:
Selection and training of field staffs
Translation of the data collection tool to the local
language
Pre testing the research methods and tools
Standardization and/or calibration of data
collection tools
Strict supervision of field staffs
Clarify the purpose of study to respondents
Double data entry
Re-interviewing of randomly (e.g. 5%) etc…
125
126. Pretesting Versus Pilot study
Describe where the pretesting will be conducted
How many study subjects will be included in the
pretesting
Will that be undertaken in the same area and/or
the same population.
If the collected data is going to be analysed or
included in the study.
126
127. Data management
Data processing refers to:
– data entry onto a computer, and
– data checks and corrections
The aim of this process is to produce a relatively
‘clean’ data set
127
128. Data management… con’d
Data coding:
In general computers are at their best with
numbers
Some statistical packages cannot analyze
alphabetic codes, some cannot understand open
ended responses
128
129. Data management… con’d
Coding is assigning a separate (non-overlapping)
numerical code for separate answers and missing
values
Example:
Instead of using ‘Male’ and ‘Female’ for the
variable sex, it can be indicated as 1=Male &
2= Female
129
130. Data management… con’d
Data Cleaning:
Once data have been gathered, they need to be
entered into a computer data file and checked for
errors
No matter how carefully the data have been
entered some errors are inevitable
The aim of this process is to produce a clean set
of data for statistical analysis
130
131. Plan for data processing and analysis
A plan for data analysis should include the following
information:
Identification of the analysis tasks to be completed
– Z test, Chi-square test , t-test, correlation,
regression…
– Confidence interval (CI) and P-value
A schedule or work plan for the analysis of the data
Identification of the statistical software to be used for
the analysis
131
132. Limitation of the study
State anticipated and inevitable limitations of the
study be methodological and/or logistical
132
133. Ethical consideration
Professional obligation to safeguard the safety of study
subjects
Describe potential ethical concerns and mechanisms to
minimize harm and maximize benefits
Every research can potentially cause ethical concerns!
Research Ethics principles
Respect person
Benefit /no harm
Justice
133
134. Plan for dissemination and utilization of findings
Briefly describe the dissemination plan:
– Feedback to the community
– Feedback to local authorities
– Identify relevant agencies that need to be
informed
– Scientific publication in a reputable journal
– Presentation in meetings/conferences/ symposium
Briefly describe how the study findings can be best
translated into application
134
135. Work plan
The work plan is the timeline that shows when
specific tasks will have been accomplished
A work plan informs the reader how long it will
take to achieve the objectives/answer the
questions
135
136. Work plan …con’d
It is a schedule, chart or graph that summarizes
the different components of a research proposal
and how they will be implemented in a coherent
way within a specific time-span
Work plan includes:
– Tasks to be performed
– When these tasks will be performed
– Who will perform the task
136
137. Work plan …con’d
The GANTT Chart
It is a planning tool which depicts graphically the order in
which various tasks must be completed and their
duration of activity
A typical Gantt chart includes the following information:
The tasks to be performed
Who is responsible for each task
The time each task is expected to take
137
138. A work plan can serve as:
A management tool
A tool for monitoring and evaluation
A visual illustration of the sequence of the
project operations
138
140. Budget
To conduct research, it is necessary to obtain
funding for the research project
When drawing up a budget, be realistic!
Do no attempt to be too economical to
demonstrate how cheaply you can run the project
At the same time, do not be too expensive so as
not to discourage the fund providers
140
141. Budget …con’d
How should a budget be prepared?
It is necessary to use the work plan as a starting point
Specify, for each activity in the work plan, what
resources are required
Determine for each resource needed the unit cost and
the total cost
141
142. Budget …con’d
The budget format and justification
The type of budget format to be used may vary
Most donor organizations have their own special
project forms, which include a budget format
Include 5%-10% contingency fund for market
inflation
142
143.
144.
145.
146.
147. Annexes
Annexes may include the following:
Data collection tools and procedures
Consent form and information sheet
Dummy table
Conceptual frame work
Sampling procedure
Map of the study area
Letter of support (cooperation letter)
Copy of the ethical approval letter, etc…
Curriculum vitae (CV) of the principal investigator
147
148.
149. Referencing
Referencing is a standard way of acknowledging
the sources of information
It is important to be consistent when you are
referencing
149
150. Major sources of literatures
–Books
–Journals
–Report paper
–Conference paper
–Website etc...
150
152. The Vancouver system
In the Vancouver style, citations within the text of
the essay/paper are identified by Arabic numbers
in round brackets or Arabic numbers in
superscript.
Example:
Although an increasing number of countries have succeeded in
improving the health and well being of mothers and children, some
countries with the highest burden of mortality made little progress
during the 1990s (1). More than 10 million children die each year,
most from preventable causes and almost all in poor countries, but
the causes of death may differ from one country to another (2).
152
153. Vancouver…con’d
Example:
Human ascariasis occurs both in temperate and tropical
environments. The prevalence is low in arid climates, but high
where conditions are wet and warm as these conditions are ideal
for egg survival and embryonation. In addition, crowding, low
socioeconomic status, poor environmental hygiene, and water
supply contribute to the increased risk of infections due to
helminthes (3-6)
.
153
154. Vancouver…con’d
The original number assigned to the reference is
reused each time the reference is cited in the
text, regardless of its previous position in the text
154
155. Vancouver…con’d
For a book
Author(s)’ Surname followed by initials. Title of book.
Place: Publisher; Year, Edition.
Example:
Abramson H. Survey methods in community Health.
Edinburgh: Churchill Livingstone ; 1990, 4th ed.
155
156. Vancouver…con’d
For a chapter in a book:
Author(s) of chapter (Surname(s) followed by initials. Chapter
title. In: Editor(s) of book, (Surname(s) followed by initials) (eds).
Title of book. Place: Publisher, Year: Page numbers of chapter.
Example:
Jennifer D. Epidemiological methods. In: Ng’weshemi J, Boerma T,
Bennett J and Schapink D (eds). HIV prevention and AIDS care in
Africa; A district level approach. Amsterdam: KIT Press, 1997: 51-68.
156
157. Journal:
Author(s) Family name and initials. Title of article. Title
of journal abbreviated Publication year, month, day
(month and day if available); volume(issue): pages.
Example:
Paul K. Maternal mortality in Africa from1980-87. Social
Science and Medicine 1993;37(2):745-52.
157
158. Two Authors
Example
Haile A, Enqueselassie F. Influence of women's
autonomy on couple's contraception use in Jimma town,
Ethiopia. Ethiop. J. Health Dev 2006;20(3):145-151.
158
159. More than Six authors:
Write the first three authors, and et al.
Example:
Tsega E, Mengesha B, Nordenfelt E, et al. Serological
survey of HIV infection in Ethiopia. Ethiop Med J
1998;26(4):179-84.
159
160. Reports and other organizational publications
Author(s). Title of report. Place of publication:
Publisher; Date of publication (year and month if
applicable).
Example:
WHO. Lay Reporting of Health Information. Geneva,
Switzerland: World Health Organization; 1978.
160
161. Conference papers
Author(s) of paper – Family name and initials. Title of
paper. In: Editor(s) Family name and initials, editor(s).
Title of conference; Date of conference; Place of
conference. Place of publication: Publisher’s name; Year
of publication.
Example:
Kimura J, Shibasaki H. Recent advances in clinical
neurophysiology. Proceedings of the 10th International Congress
of EMG and Clinical Neurophysiology; 1995 Oct 15-19; Kyoto,
Japan. Amsterdam: Elsevier; 1996.
161
162. Websites
Example
World Health Organization. Deployment at community level
of artemether-lumefantrine and rapid diagnostic tests, Raya
Valley, Tigray, Ethiopia. 2009. (
http://apps.who.int/malaria/docs/diagnosisandtreatment/RapportT
) (Accessed October 15, 2009).
162
163. The Harvard System
In other journals and books it is common to put the year,
between brackets, straight after the name of the
author(s)
If this system of citation is used, the references at the
end of the proposal, should be listed in Alphabetical
order
In Harvard System, put the surname of the author, year
of publication and number(s) of page(s) referred to
between brackets, (E.g. Shiva 1998)
163
164. Harvard…con’d
Example :
Many patients with malaria have limited access to the
new recommended first-line treatment because of poor
communication, lack of knowledge, as well as distance
and transport costs to reach the health services (Whitty
et al. 2008).
164
165. Harvard…con’d
Thus, WHO recommends combination therapies,
preferably those including an artemisinin derivative, as
treatment for uncomplicated P. falciparum malaria for
achieving a rapid cure, reducing parasiteinfectivity
(WHO 2008) and countering the threat of resistance to
P. falciparum (CDC 2006).
165
166. Harvard…con’d
Name of the author(s) (year). Title. Place of Publication:
Publisher
Example:
Abramson JH (1990), 4th
ed. Survey methods in community
medicine. Edinburgh: Churchill Livingstone.
World Health Organization (1963). Terminology of
Malaria and of Malaria Eradication. Columbia University
Press, New York.
166
167. Tips!
When you use the Vancouver system, you will use
consecutive numbers in the text to indicate your
references
At the end, you will then list your references in that
order, using the format described above
In Harvard system, put the surname of the author , year
of publication and number(s) of page(s) referred to
between brackets
If this system of citation is used, the references at the
end of the proposal, should be listed in alphabetical
order of the authors name
167
It is possible to identify three broad objectives that characterize the utility of descriptive epidemiology: To permit evaluation of trends in health and disease and comparisons among countries and subgroups within countries; the objective includes monitoring of known diseases as well as the identification of emerging problems To provide a basis for planning, service provision, and evaluation of health services; data needed for efficient allocation of resources often come from descriptive epidemiologic studies To identify problems to be studied by analytic methods and to suggest areas that may be fruitful for investigation
Exposure-based cohort studies.
This type of cohort includes either an entire population or a representative sample of the population. Here exposures are unknown until the first period of observation when exposure information is collected after administration of questionnaires, collection of biologic samples, etc. Then the cohort can be divided into exposed and non-exposed group.
Retrospective studies are quicker and cheaper and efficient for diseases with a long latency but you need good records of relevant exposure data, as well data on potential confounders (diet, smoking) may not be available.