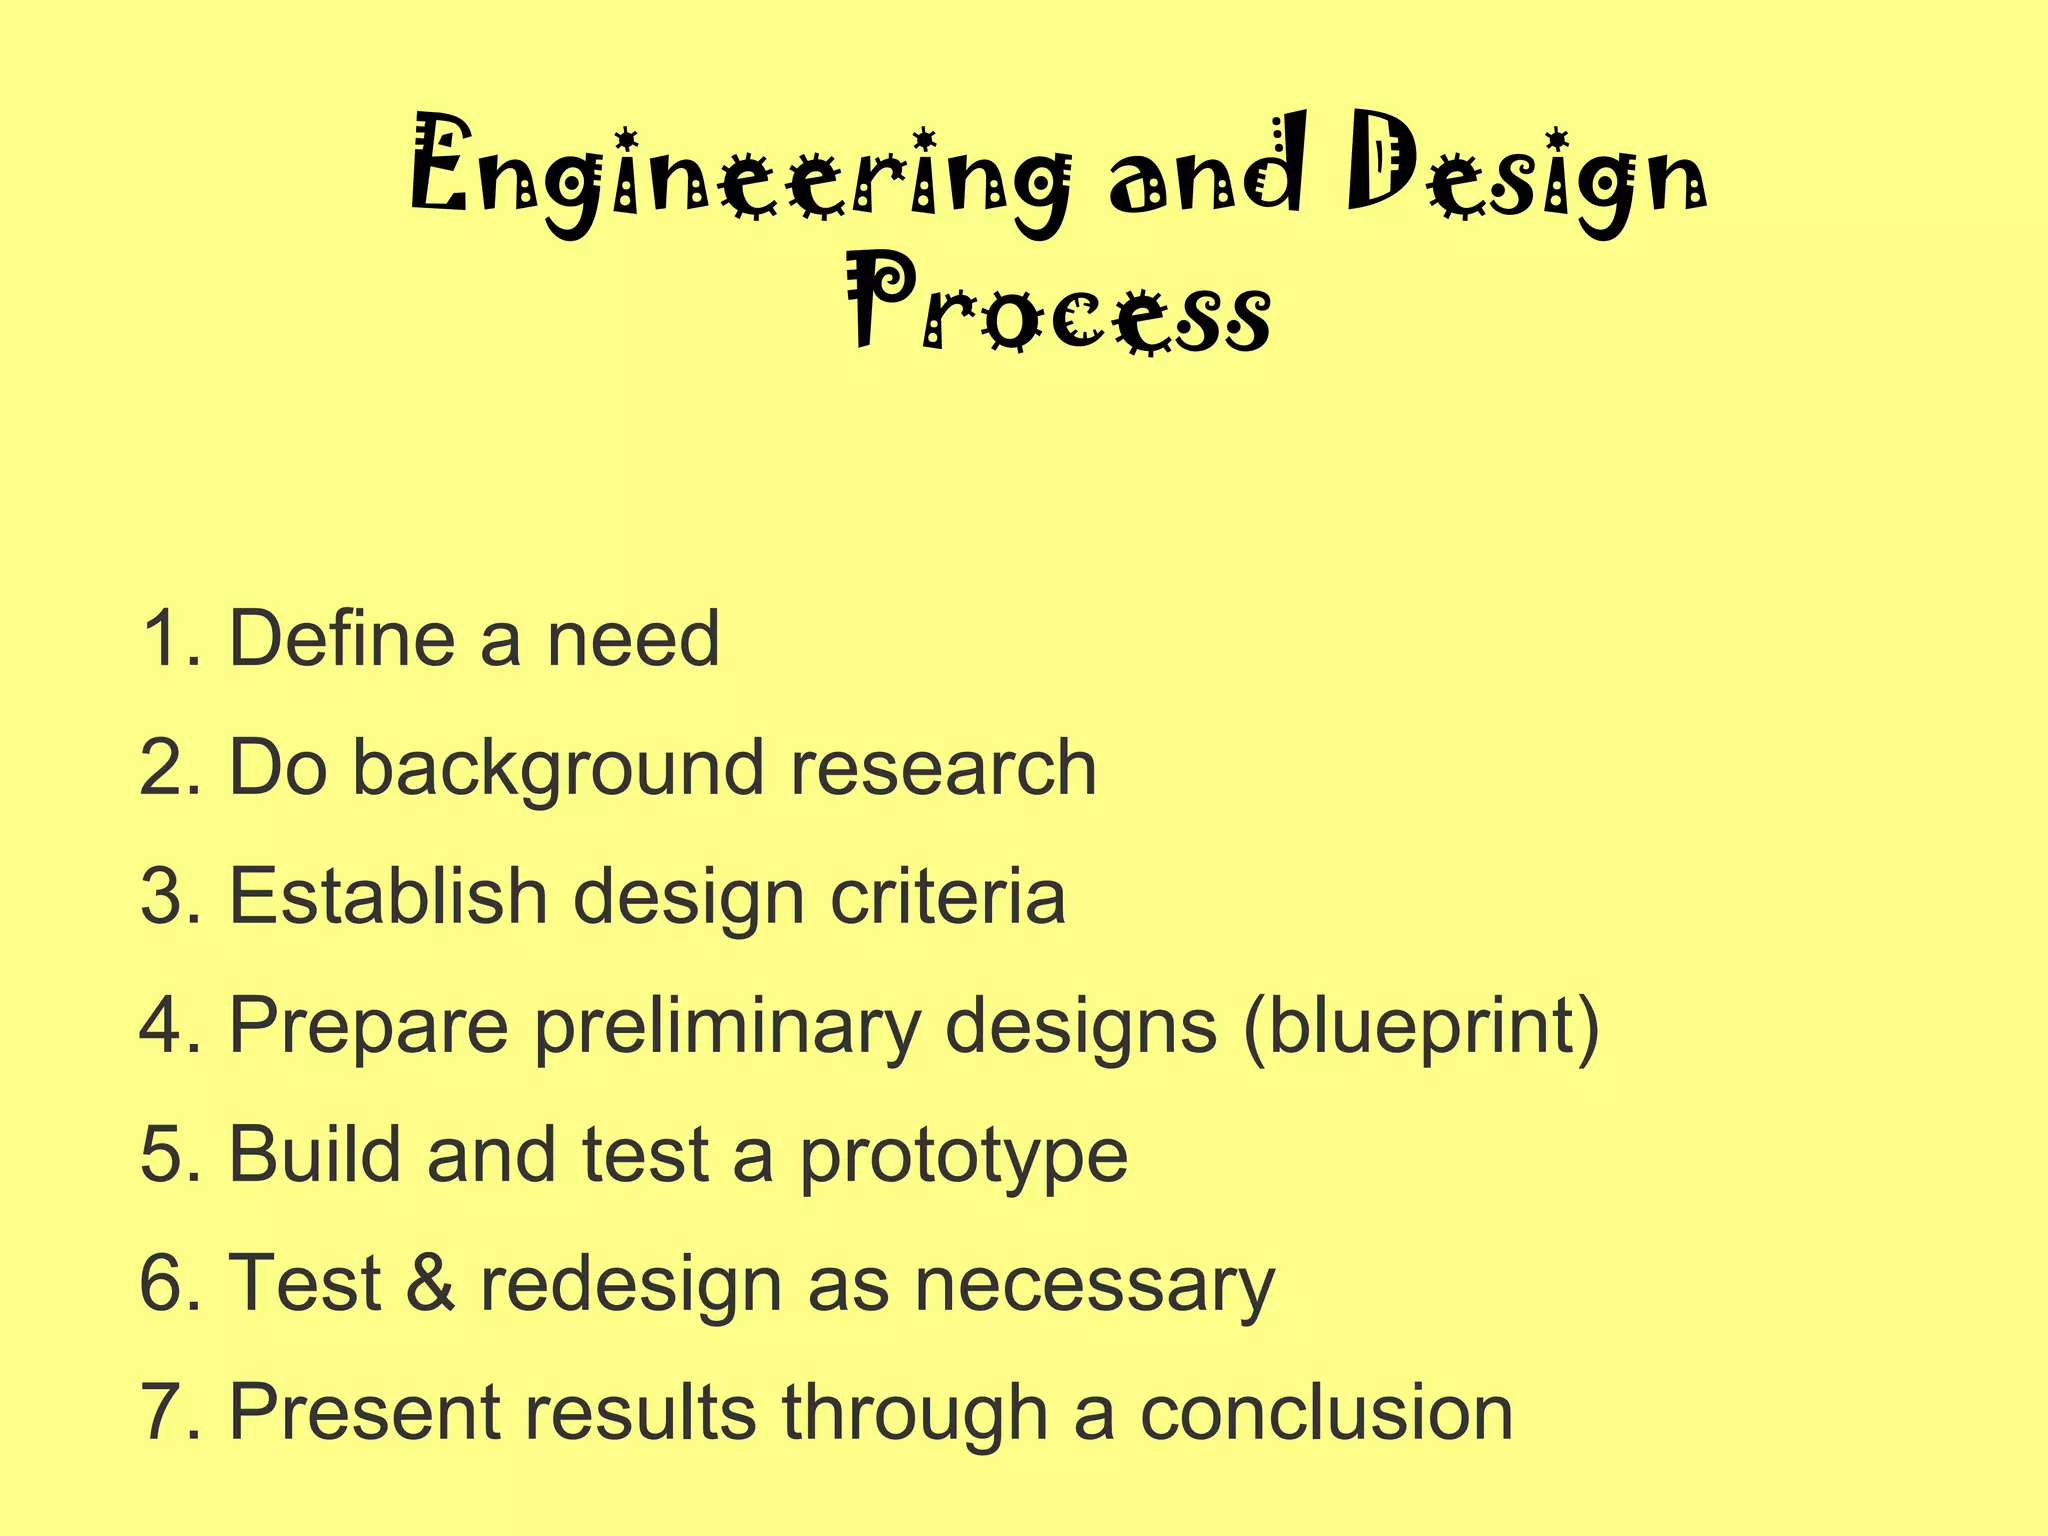
The document outlines the typical steps in the engineering design process:
1. Define a need or problem.
2. Conduct background research to better understand the problem.
3. Establish design criteria for a potential solution.
4. Prepare preliminary designs through blueprints or prototypes.
5. Build and test a prototype of the design.
6. Test and redesign the prototype as needed until the criteria are met.
7. Present the results and conclusions.
Slides used during "Notebooks Rock" presentation at NSTA conference. Session originally listed as "Science Notebooking: A Convenient and Cost-effective Approach"
National Merit Scholarships and the New PSATC2 Education
We’ll start off by trying to demystify the National Merit Scholarship. It sounds like a good thing, but what is it, and how do you qualify?
Next year (2016) the PSAT will be very different from the current test given this year and in years past. So, in order to help you plan and prepare, we’ll talk about some of those changes and what they mean for you.
Finally, we’ll cover a little bit about planning for the new exam – how to prepare and what to be on the lookout for – so that you can give yourself the best shot at getting a great score.
SGEM Vienna, Hofburg- 6-9.04.2016. Scientific Conference on Social sciences and Arts. SGEM Vienna provides a platform for academicians and professionals with cross-disciplinary interests. Every published paper is submitted for evaluation and indexation in- ISI Web of Sciences, Thomson Reuters, SCOPUS, ELSEVIER products, EBSCO, ProQuest, Mendeley, British Library. Scientific Fields: Political Sciences, History, Philosophy, History of Arts, Contemporary Arts, Performing & Visual Arts, Architecture & Design Call for papers - Paper publishing, Oral and Poster presentations, Workshops, Live Art Performaces.
How to Build a Module in Odoo 17 Using the Scaffold MethodCeline George
Odoo provides an option for creating a module by using a single line command. By using this command the user can make a whole structure of a module. It is very easy for a beginner to make a module. There is no need to make each file manually. This slide will show how to create a module using the scaffold method.
Macroeconomics- Movie Location
This will be used as part of your Personal Professional Portfolio once graded.
Objective:
Prepare a presentation or a paper using research, basic comparative analysis, data organization and application of economic information. You will make an informed assessment of an economic climate outside of the United States to accomplish an entertainment industry objective.
This presentation includes basic of PCOS their pathology and treatment and also Ayurveda correlation of PCOS and Ayurvedic line of treatment mentioned in classics.
Executive Directors Chat Leveraging AI for Diversity, Equity, and InclusionTechSoup
Let’s explore the intersection of technology and equity in the final session of our DEI series. Discover how AI tools, like ChatGPT, can be used to support and enhance your nonprofit's DEI initiatives. Participants will gain insights into practical AI applications and get tips for leveraging technology to advance their DEI goals.
A workshop hosted by the South African Journal of Science aimed at postgraduate students and early career researchers with little or no experience in writing and publishing journal articles.
A Strategic Approach: GenAI in EducationPeter Windle
Artificial Intelligence (AI) technologies such as Generative AI, Image Generators and Large Language Models have had a dramatic impact on teaching, learning and assessment over the past 18 months. The most immediate threat AI posed was to Academic Integrity with Higher Education Institutes (HEIs) focusing their efforts on combating the use of GenAI in assessment. Guidelines were developed for staff and students, policies put in place too. Innovative educators have forged paths in the use of Generative AI for teaching, learning and assessments leading to pockets of transformation springing up across HEIs, often with little or no top-down guidance, support or direction.
This Gasta posits a strategic approach to integrating AI into HEIs to prepare staff, students and the curriculum for an evolving world and workplace. We will highlight the advantages of working with these technologies beyond the realm of teaching, learning and assessment by considering prompt engineering skills, industry impact, curriculum changes, and the need for staff upskilling. In contrast, not engaging strategically with Generative AI poses risks, including falling behind peers, missed opportunities and failing to ensure our graduates remain employable. The rapid evolution of AI technologies necessitates a proactive and strategic approach if we are to remain relevant.
Acetabularia Information For Class 9 .docxvaibhavrinwa19
Acetabularia acetabulum is a single-celled green alga that in its vegetative state is morphologically differentiated into a basal rhizoid and an axially elongated stalk, which bears whorls of branching hairs. The single diploid nucleus resides in the rhizoid.
it describes the bony anatomy including the femoral head , acetabulum, labrum . also discusses the capsule , ligaments . muscle that act on the hip joint and the range of motion are outlined. factors affecting hip joint stability and weight transmission through the joint are summarized.
MATATAG CURRICULUM: ASSESSING THE READINESS OF ELEM. PUBLIC SCHOOL TEACHERS I...NelTorrente
In this research, it concludes that while the readiness of teachers in Caloocan City to implement the MATATAG Curriculum is generally positive, targeted efforts in professional development, resource distribution, support networks, and comprehensive preparation can address the existing gaps and ensure successful curriculum implementation.
Unit 8 - Information and Communication Technology (Paper I).pdfThiyagu K
This slides describes the basic concepts of ICT, basics of Email, Emerging Technology and Digital Initiatives in Education. This presentations aligns with the UGC Paper I syllabus.
Unit 8 - Information and Communication Technology (Paper I).pdf
Engineering fair project
1. Engineering and Design
Process
1. Define a need
2. Do background research
3. Establish design criteria
4. Prepare preliminary designs (blueprint)
5. Build and test a prototype
6. Test & redesign as necessary
7. Present results through a conclusion
3. Log
• The first thing you need to do to begin an
engineering fair project is to begin writing in
a log.
• It is a record of everything you think and do
as you work on your engineering fair
project.
4. Log
• Projects without logs will be disqualified.
• The log IS the project. The show board is
just a commercial for the project.
• Research notes, measurements,
observations, and test results should be
included.
6. Brainstorming Topics
(Grades 3-5)
Make a list of things you are interested in.
Think of a problem you want to solve.
How could you solve it?
Can you think of 20 or more?
7. What can you do to make a
difference outside of these 4
walls?
• http://safeshare.tv/w/UoUIdWPIUq
8. What makes good need?
• Is it testable?
• Can you build it by your self?
• How are you going to collect data on your
project?
9. Choose a question from
your list that fits the
science fair question
criteria and explain why
you chose the question in
your log.
11. Purpose
The purpose of the project should tell what you want to
find out.
The purpose of my project is to find out…
It is really just restating the
question.
13. Research
• Before you can begin your project, you need to
learn more about the topic.
• You will write the information you learn in your
science fair log.
• You will use this information to make your
hypothesis.
14. THERE IS NOT A
RESEARCH PAPER
THIS YEAR!
• Your research paragraph needs to be well
written and explain what you learned from
your research!
18. This is your blue print! You should attach a drawing to the
back of your packet. You must also write what your
prototype will look like.
Remember the criteria:
-Ariel View
-Side View
-Material List
-3D
-Easy to read!
-Labels, labels, labels!!!
20. Example of Materials List
Materials
• 2 – 16oz Office Depot clear plastic cups
• 130ml tap water
• 1 Thermometer
• 16 oz of ice from cafeteria ice maker
21. Materials
• This is a list of ALL the materials you
need to perform your experiment.
• You must also include how much.
.
24. Examples of Directions
1. Gather Materials
2. Fill cup to ½ way mark with ice.
3. Add 130 ml of tap water
4. Swirl cup for 1 minute. (hold by top
edges of the cup)
5. Record water temperature. (Keep
thermometer in water, look at eye level)
6. Add 2 more ice cubes.
7. Repeat steps 4 and 5
25. •These are like a recipe.
•Anyone who reads them
will be able to duplicate
the investigation and get
the same results.
Step by Step Directions –
26. •Direction steps need to be
numbered.
•The test needs to be done 5 or
more times so they will have
sufficient data to make an accurate
conclusion.
•Step number one is always, “Gather
materials.”
Step by Step Directions –
27. When you write your directions there are a few
things to remember:
Write them clearly so someone else may
follow them and get the same (or similar)
results.
Be very specific and to the point.
Remember to indicate how many trials are
necessary.
For Example:
“Repeat steps 2-5 four more times for a total
of five trials”
Make sure to indicate when data should be
collected and what kind of data.
29. DATA
•Data refers to the information gathered in
the investigation
•This is in the form of tables and charts.
•You can also use photographs or drawings
to show the information you gathered but
pictures do not replace the data.
30. DATA
•To collect your data you will follow your
step by step directions exactly.
•You will complete at least 5 trials and
record the information in your log.
•You will use the data to create a data chart.
31. DATA
The more trials you do the more
accurate the results of your experiment
will be.
The minimum for science fair is five
trials.
Scientists often repeat experiments
thousands of times.
35. Graph
Use a bar graph or line graph to display data.
This is the same information
gathered and already
recorded on your data chart.
36. Graph
•A bar graph – shows comparative data
•A line graph – shows data over time. (such as
growing plants)
•Horizontal Axis: The manipulated variable (what you
changed on purpose) is displayed on the horizontal
axis.
•Vertical Axis: The responding variable (what
happened as a result of what you changed) is
displayed on the vertical axis.
37. Distance Toy Car Travels When Rolled Down
Ramp Onto Various Surfaces
Meters
Trials
Key
39. CONCLUSION
My hypothesis was supported (or not
supported) by the data. (Explain)
I found out that…
If I were to do this project again, I would
change…because…..
The way this is connected to the real world
is…
40. CONCLUSION
A problem I had or unusual event was….
Describe your data in detail. What does your data
mean?
Compare the results with you background
information.
Explain why the experiment is important.
41. Next Time
Lesson 13
• You MUST complete this section!
• Everyone can improve on something. What
worked well? What didn’t work so well?
47. Displays
• Must be durable and self-supporting
• No student or school name can be on the front of the
display, or on/in the log/research paper.
• Photos are great, but there should not be school shirts
in photos.
• Dead animals, plants, and food may NOT be part of
display.
• Projects involving human blood, mold or fungus are
prohibited
• Glass items and plastic “baggies” are not to be
displayed
• Straight pins, tacks, or staples are not to be used to
secure materials onto display boards
48. Ineligible Projects
• Projects involving human blood, body
parts including hair, teeth, nails, or
pathogenic agents (bacteria, mold,
viruses, fungi, parasites) are
PROHIBITED!
• Yeast is the exception and is approved.
• Projects involving weapons (ANY type
of gun, arrows, knives, darts, etc.) or
explosives are PROHIBITED!
Editor's Notes
It is okay if a student chooses a new question as long as it fits the criteria. You may ask leading questions and make suggestions to help students choose an appropriate question. Remember – unless parents can and are willing to help with data collection you will be helping students to conduct the experiment and collect data at school. If the experiment matches other benchmarks in your grade BONUS!!
Model – use some student questions and write them as purposes.
Example: Question: Will a cable-stayed bridge or a beam bridge support the most weight?
Purpose: The purpose of my project is to find out if a cable-stayed bridge or a beam bridge will support the most weight.
Encourage students to write a log entry about their project. They may start to explain what materials they think they might use, ideas for conducting the investigation, or any other thoughts about the project. Do not correct or change what they write at this point. This is purely student thinking and processing at this point. You will address the other steps at a later date.
K-2 will do the one class project purpose. Student comments and ideas can be recorded in the log.
Your students can go on-line or into an encyclopedia, book, magazine, or other text or talk to an expert and learn something about the topic. This can be done as a reading or library skills lesson, in the computer lab as a lesson on finding online information, or whatever works best for your class. Have students read informational text related to their topic and jot notes in their logs. (This is like think notes in reading). They should try to find the answer to their questions, or information that leads them to an answer. They will conduct an investigation to prove or disprove what they have read or heard.
Use measurements that are appropriate in your grade level. It is okay for K-2 to use nonstandard measurement.
3-5 should only use measurements that the student understands. Look at the previous grade level’s benchmarks for measurement to find out what your students should know. Projects will not be disqualified if metric is not used. It is recommended that students who understand metric use it.
Discuss with students. Scientists use metric measurement and someday they might only use metric too.
Notice – cups are measured using ounces because that is what is listed on the package. (It is NOT necessary to convert to metric.)
If the student understands metric measurement it can be used to measure, notice the water is measured in milliliters.
Use measurements that are appropriate in your grade level. It is okay for K-2 to use nonstandard measurement.
3-5 should only use measurements that the student understands. Look at the previous grade level’s benchmarks for measurement to find out what your students should know.
Step by step directions makes
a good writing connection.
(Procedural writing)
(National Geographic writing connection books also offer good model lessons)
It’s Peanut Butter and Jelly Time! science/writing connection – can be used as a writing lesson
Have your students work in groups to write a recipe for making a peanut butter and jelly sandwich.
Follow the directions EXACTLY to make a sandwich.
If any part of the directions are missing or incomplete, have your students revise them until they can be followed and a sandwich can be made.
Students are very willing to revise when they have to have usable directions in order to get a sandwich.
****In case of peanut allergies make Fluff and jelly sandwiches. *****
Data collection for one student’s project can be done as a whole class. Each group’s data becomes 1 trial.
Your students directions will be revised and ready to use before any data collection takes place.
This will be the most time consuming and sometimes messy part of science fair. In grades 3-5 you will spend several science periods collecting data. (See curriculum map). K-2 will have one class project.
In grades 3-5 the data collection portion may be done at home IF parents are willing and able to help. Students should record data and bring data along with log entries about the data collection then create the data chart and graph at school.
Look at the math standards from the previous grade. Only what has been previously taught is considered appropriate to use for science fair. Projects WILL NOT be disqualified if metric is not used.
Students will follow directions and collect data. Explain that each group represents 1 trial. 5 groups = 5 trials. Whole class data can be quickly collected, making individual projects more manageable.
Each group should write temp 1 and temp 2 on a sticky note. Collect sticky notes and graph on a bar graph and display. Graph : increased, decreased, stayed the same.
Create data table with the data.
The first several times you do this with children, you will need to model using the data to create a data table and graph. Some students will learn quickly and be able to do their charts and graphs on their own after data is collected. Others will need more support and you may model theirs whole class.
While one student is writing up their data charts and graph, another can be preparing their materials and the rest of the class can be collecting data.
Be careful that your name or school name cannot be seen in the pictures.
You can do a student’s data collection as a whole class and each group’s data becomes 1 trial.
Data collection should be grade level appropriate according to math standards.
Example of a data chart.
Teacher can model data collection. Use student projects and model, model, model! Again, several groups can do the experiment all at the same time and each group becomes one trial for the student who is doing the project. K-2 will only do one whole class data collection.
Explain the difference between quantitative and qualitative data.
Qualitative has to do with observable qualities. (5 senses) What we can hear, see, feel, taste, smell.
Quantitative is measurable and can be expressed numerically.
Qualitative Data
How can you collect qualitative data for:
How Does drinking Coca Cola affect the color of teeth?
You can use tooth color charts from the dentists office. A numerical value is given to each shade.
How does laundry detergent affect stains?
Example: Use a white T-shirt. Rub in grass until well stained. Cut into squares. Use a clean white square as “0”. Worst stain as “10”. Soak squares in different detergents. Rank by stain and number .
Paint sample cards work well too.
Graphs should be grade level appropriate and understood by the student.
Refer to the math standards from the previous school year. Use math resources if needed to reteach graphing. Model graphic using student’s data. Students must be able to explain their graphs to the science fair judges.
In K-2 picture graphs or bar graphs with 1:1 correspondence are appropriate. In 3-5 student should be able to understand and explain their graphs.
Graphs should be grade level appropriate and understood by the student. In K-2 picture graphs or bar graphs with 1:1 correspondence are appropriate. In 3-5 student should be able to understand and explain their graphs.
Only use this if it is appropriate for your students.
We no longer average or find the mean in elementary school.
This graph would not be appropriate for students who have not yet learned to create a triple bar graph.
In primary it would be appropriate to add the results of each trial and create a two-bar bar graph to compare the data.
We no longer list results – results implies that we averaged the data and we do not.
Finding the mean, or average is no longer part of our math standards.
*If a student does understand and can explain finding a mean it is acceptable for that student to do so.
These are suggestions for writing conclusions. You and your students may add to this.
Notice we no longer list results – results implies that we averaged the data and we do not.
The conclusion is based on the hypothesis – so student should refer back to it.
If the data did not support the hypothesis, this is where they will state that and give the corrected information
Statement of support or non-support of the original hypothesis. Revise hypothesis (if data did not support the original hypothesis).
How you do your science fair display for your school site based science fair is up to your school site. You may choose to use construction paper mini boards, typed up copies of what goes on the show board, hand written list of show board info, or whatever works for your school. The large cardboard display boards are only needed for the students who win for the school site and are going on to the district science fair.
The information needs to flow, but parts do not necessarily need to be in these positions. (It’s okay if the directions go in the center and the pictures are in various places, etc…)
Parents, art teachers, etc… may assist with the boards. Boards are not judged, what matters most is what the student has learned and can explain and what has been written and drawn in the log.
When someone does a science project for a student they are taking away the student’s opportunity to learn. And, if the student can not show a thorough understanding of the investigation the student will not win a science fair medal. We need to let the students do the work and the learning.
School names and students names should not be on showboard.
The title can be the question or a cute name for the project. Both work.
This information is on IDEAS in the Science Fair Handbook.
There is a maximum size for boards. See Science Fair Handbook.
No rockets with engines, no catapults.
This information is on IDEAS in the Science Fair Handbook.