Download to read offline
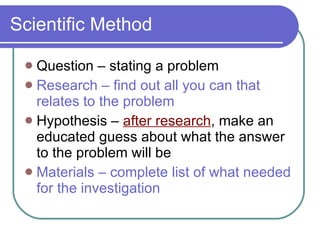

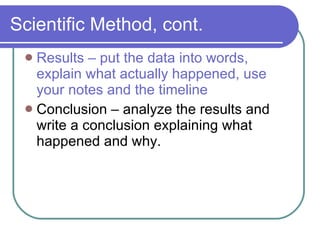

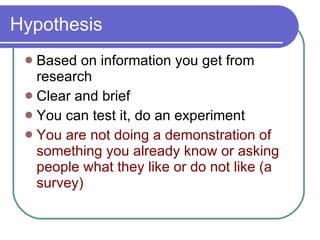
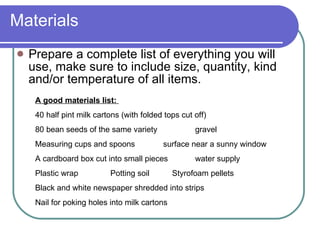

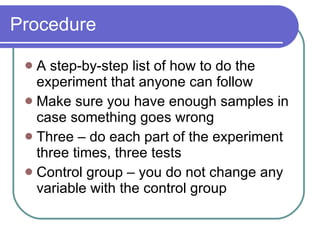


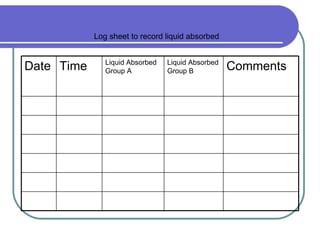


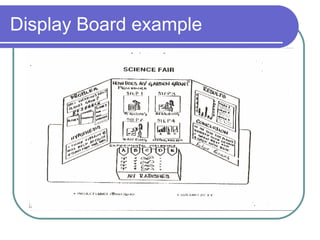


This document provides guidance for students on conducting a science fair project, including following the scientific method process of asking a question, researching background information, developing a hypothesis, designing an experiment with controls and variables, gathering and recording data, analyzing results, and drawing a conclusion. It emphasizes key steps like preparing materials lists and procedures, taking accurate measurements and notes, organizing data visually through charts and graphs, and creating a display board and journal to share the project. The overall goal is for students to learn through hands-on investigation and discovery.


![Science fair[1]](https://cdn.slidesharecdn.com/ss_thumbnails/sciencefair1-111108091239-phpapp01-thumbnail.jpg?width=640&height=640&fit=bounds)
![Science fair[1]](https://cdn.slidesharecdn.com/ss_thumbnails/sciencefair1-111104142231-phpapp01-thumbnail.jpg?width=640&height=640&fit=bounds)


