Download as PDF, PPTX
![SHARE Project- DB Stats
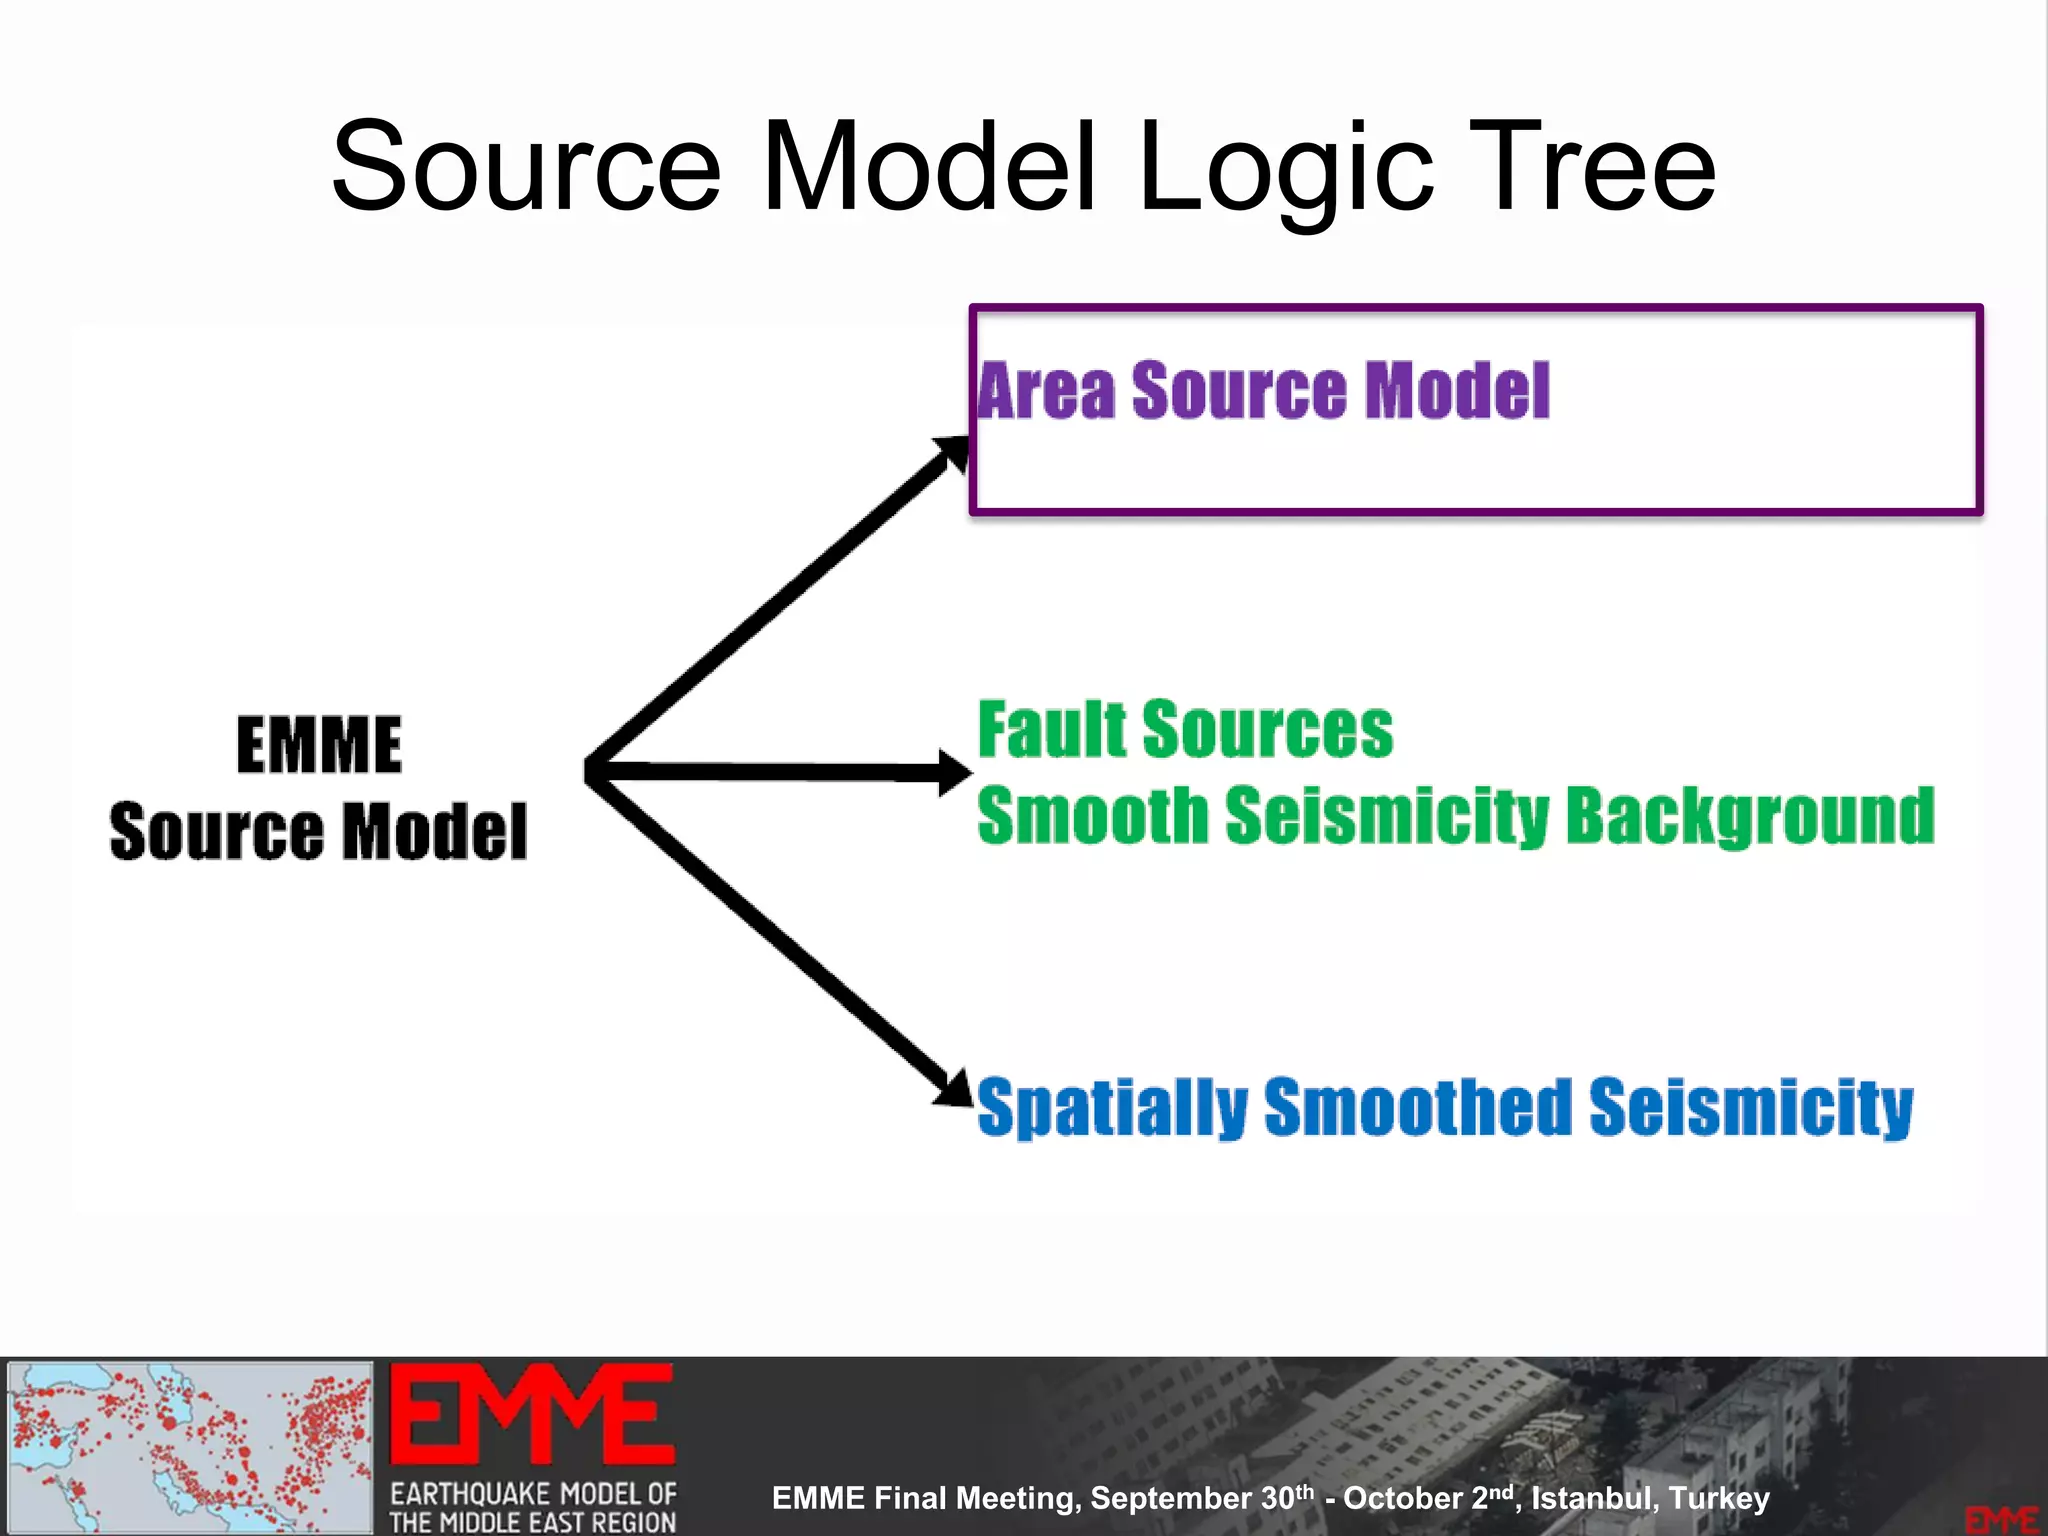
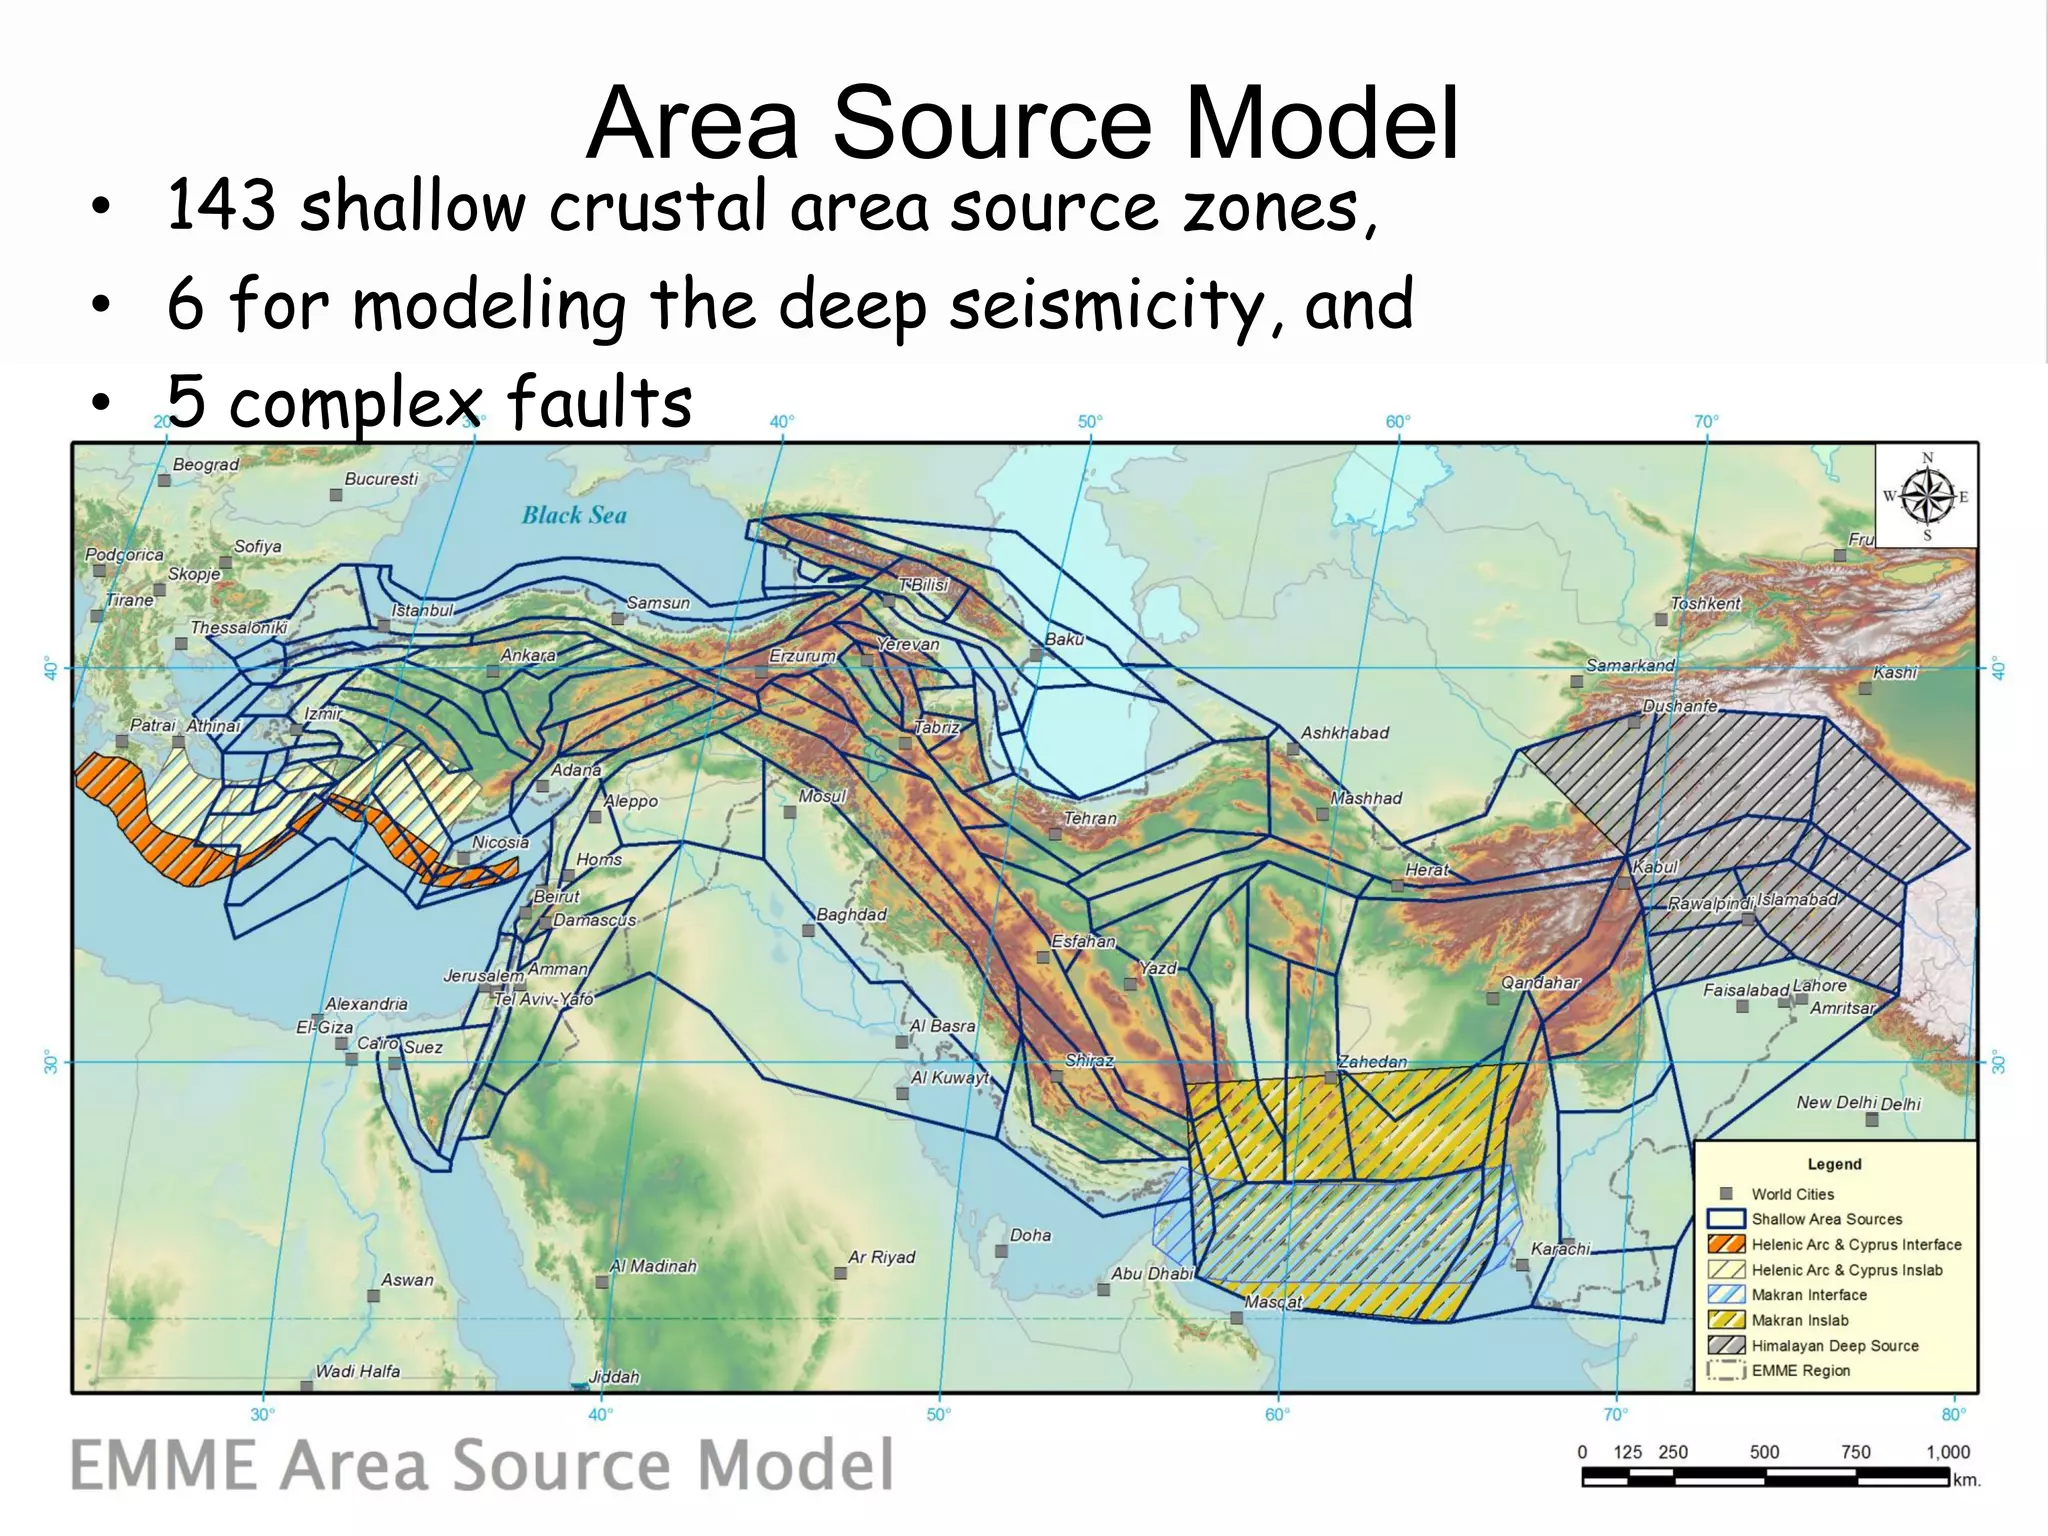
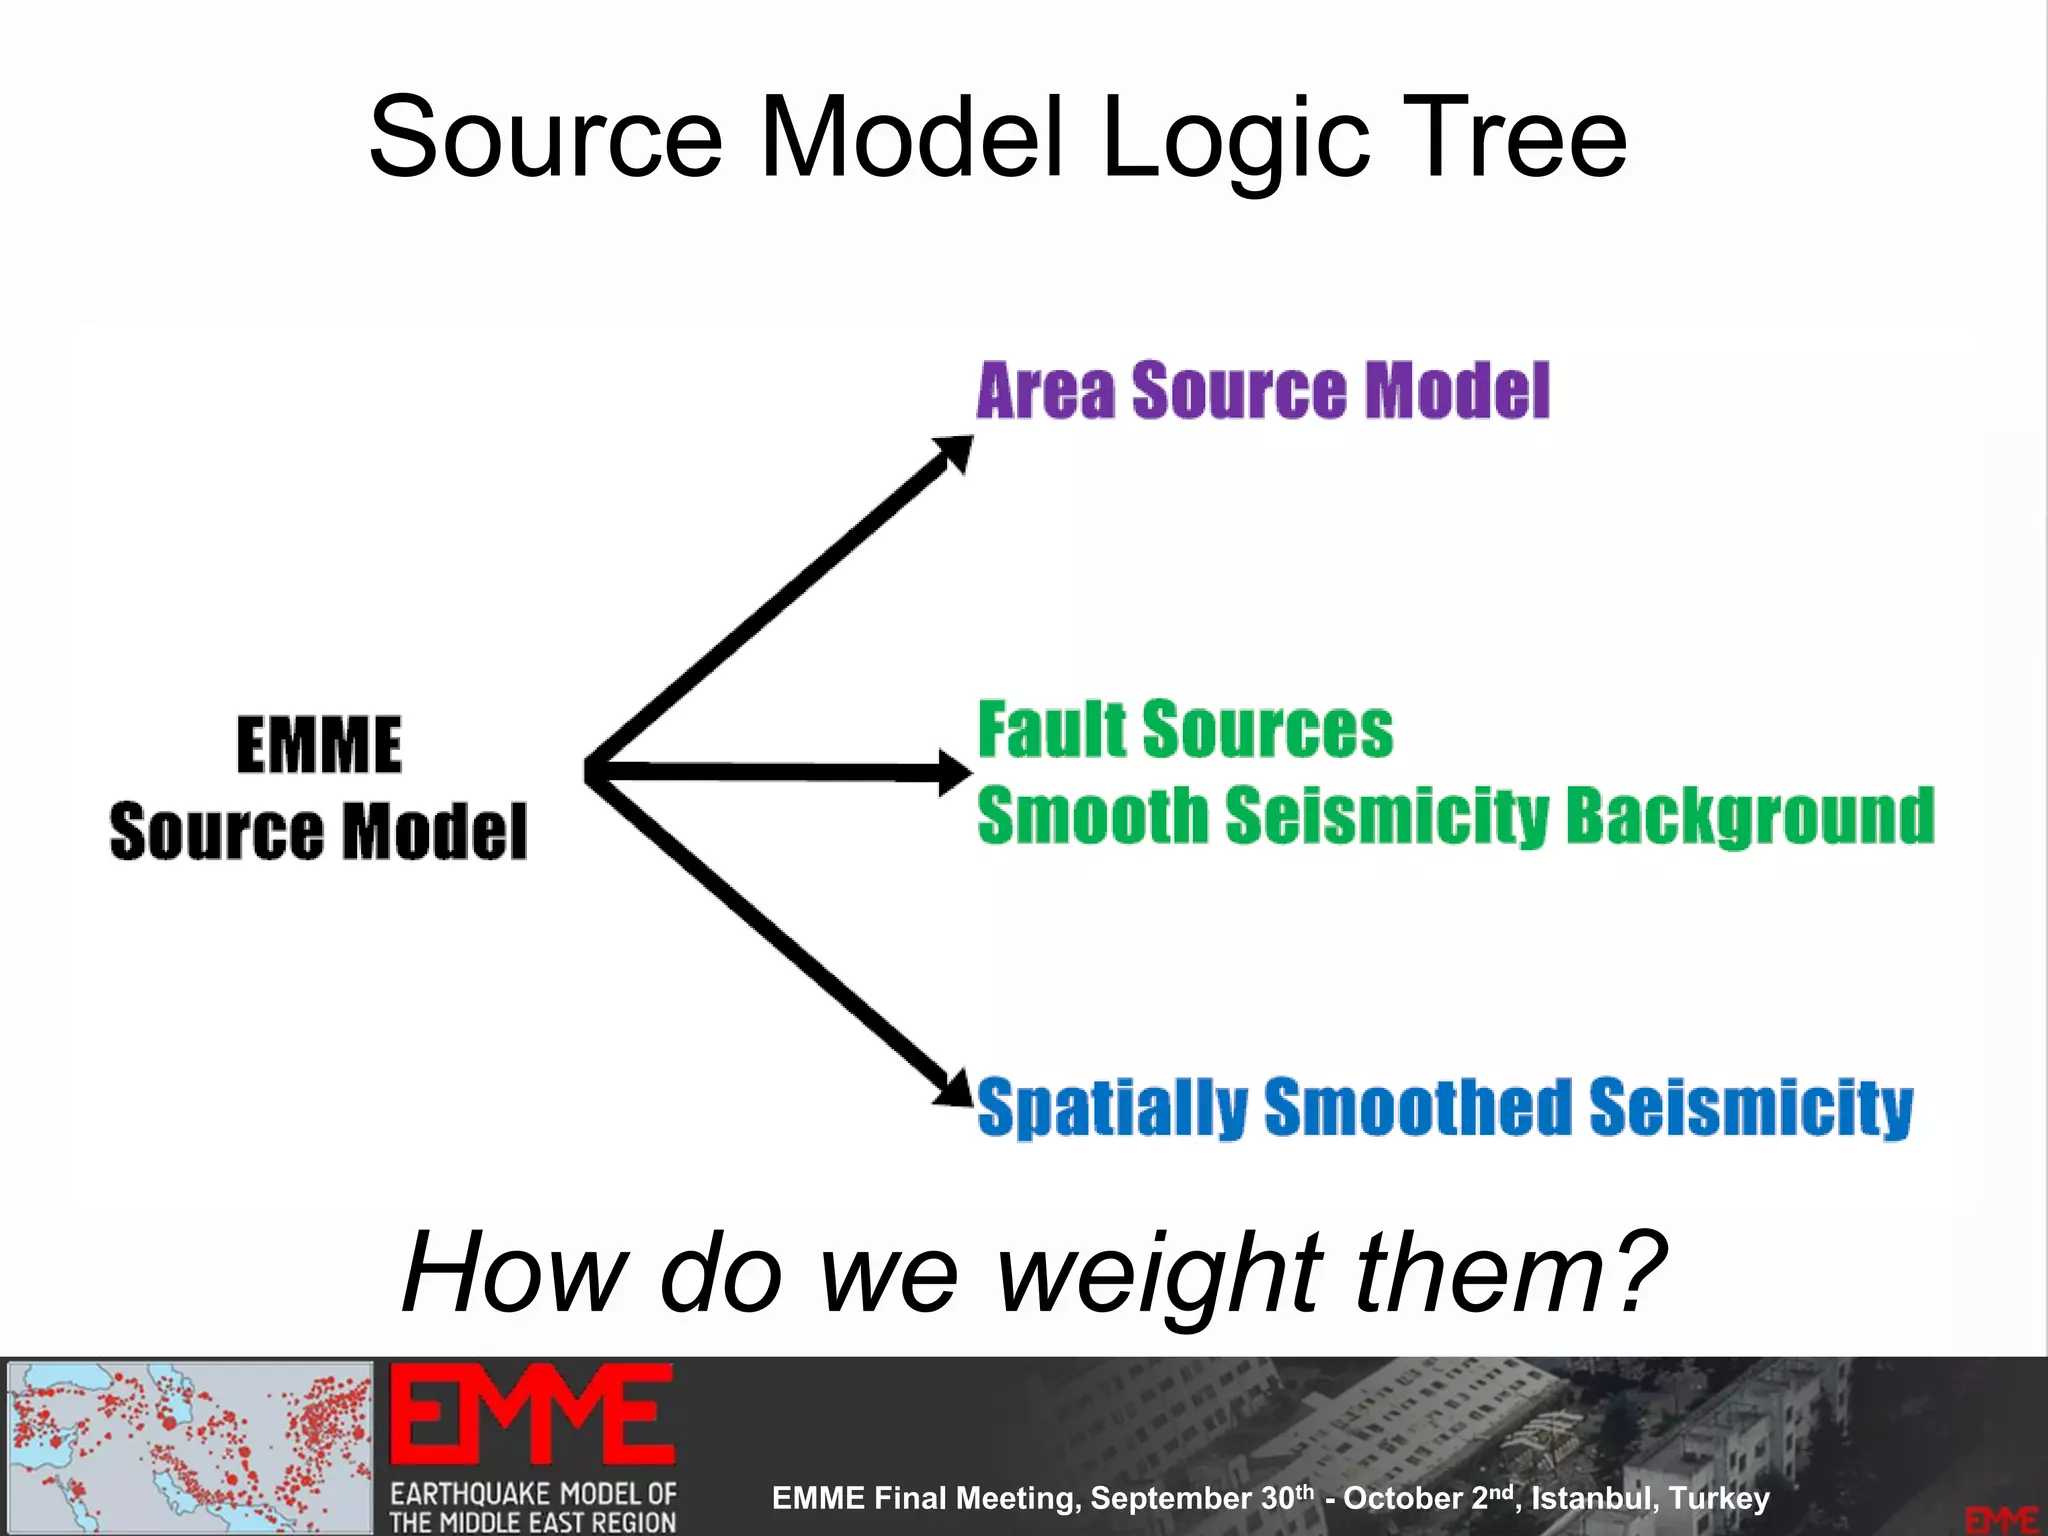
• 3 source models
• 960 End-Branches
• 12 Intensity Measure Types
• 7 Return Periods [50 to 10000Years]
• Mean, Median and Four Quantile
• 130 000 sites
‣ Hazard Maps: 504
‣ Hazard Curves: 9.36 mil
‣ Uniform Hazard Spectra: 5.46mil
‣ Disaggregation: ongoing
Dynamic Model
EMME Project- DB Stats
55000
sites](https://image.slidesharecdn.com/emmesourcemodeldanciuetal201309-130930095907-phpapp01/75/Seismic-Hazard-Model-for-the-Middle-East-Region-Laurentiu-Danciu-Swiss-Seismological-Service-ETH-Zurich-Switzerland-GEM-Hazard-Modeler-Karin-Sesetyan-Mine-Demircioglu-Kandilli-Observatory-and-Earthquake-Research-Institute-Istanbul-Turkey-8-2048.jpg)
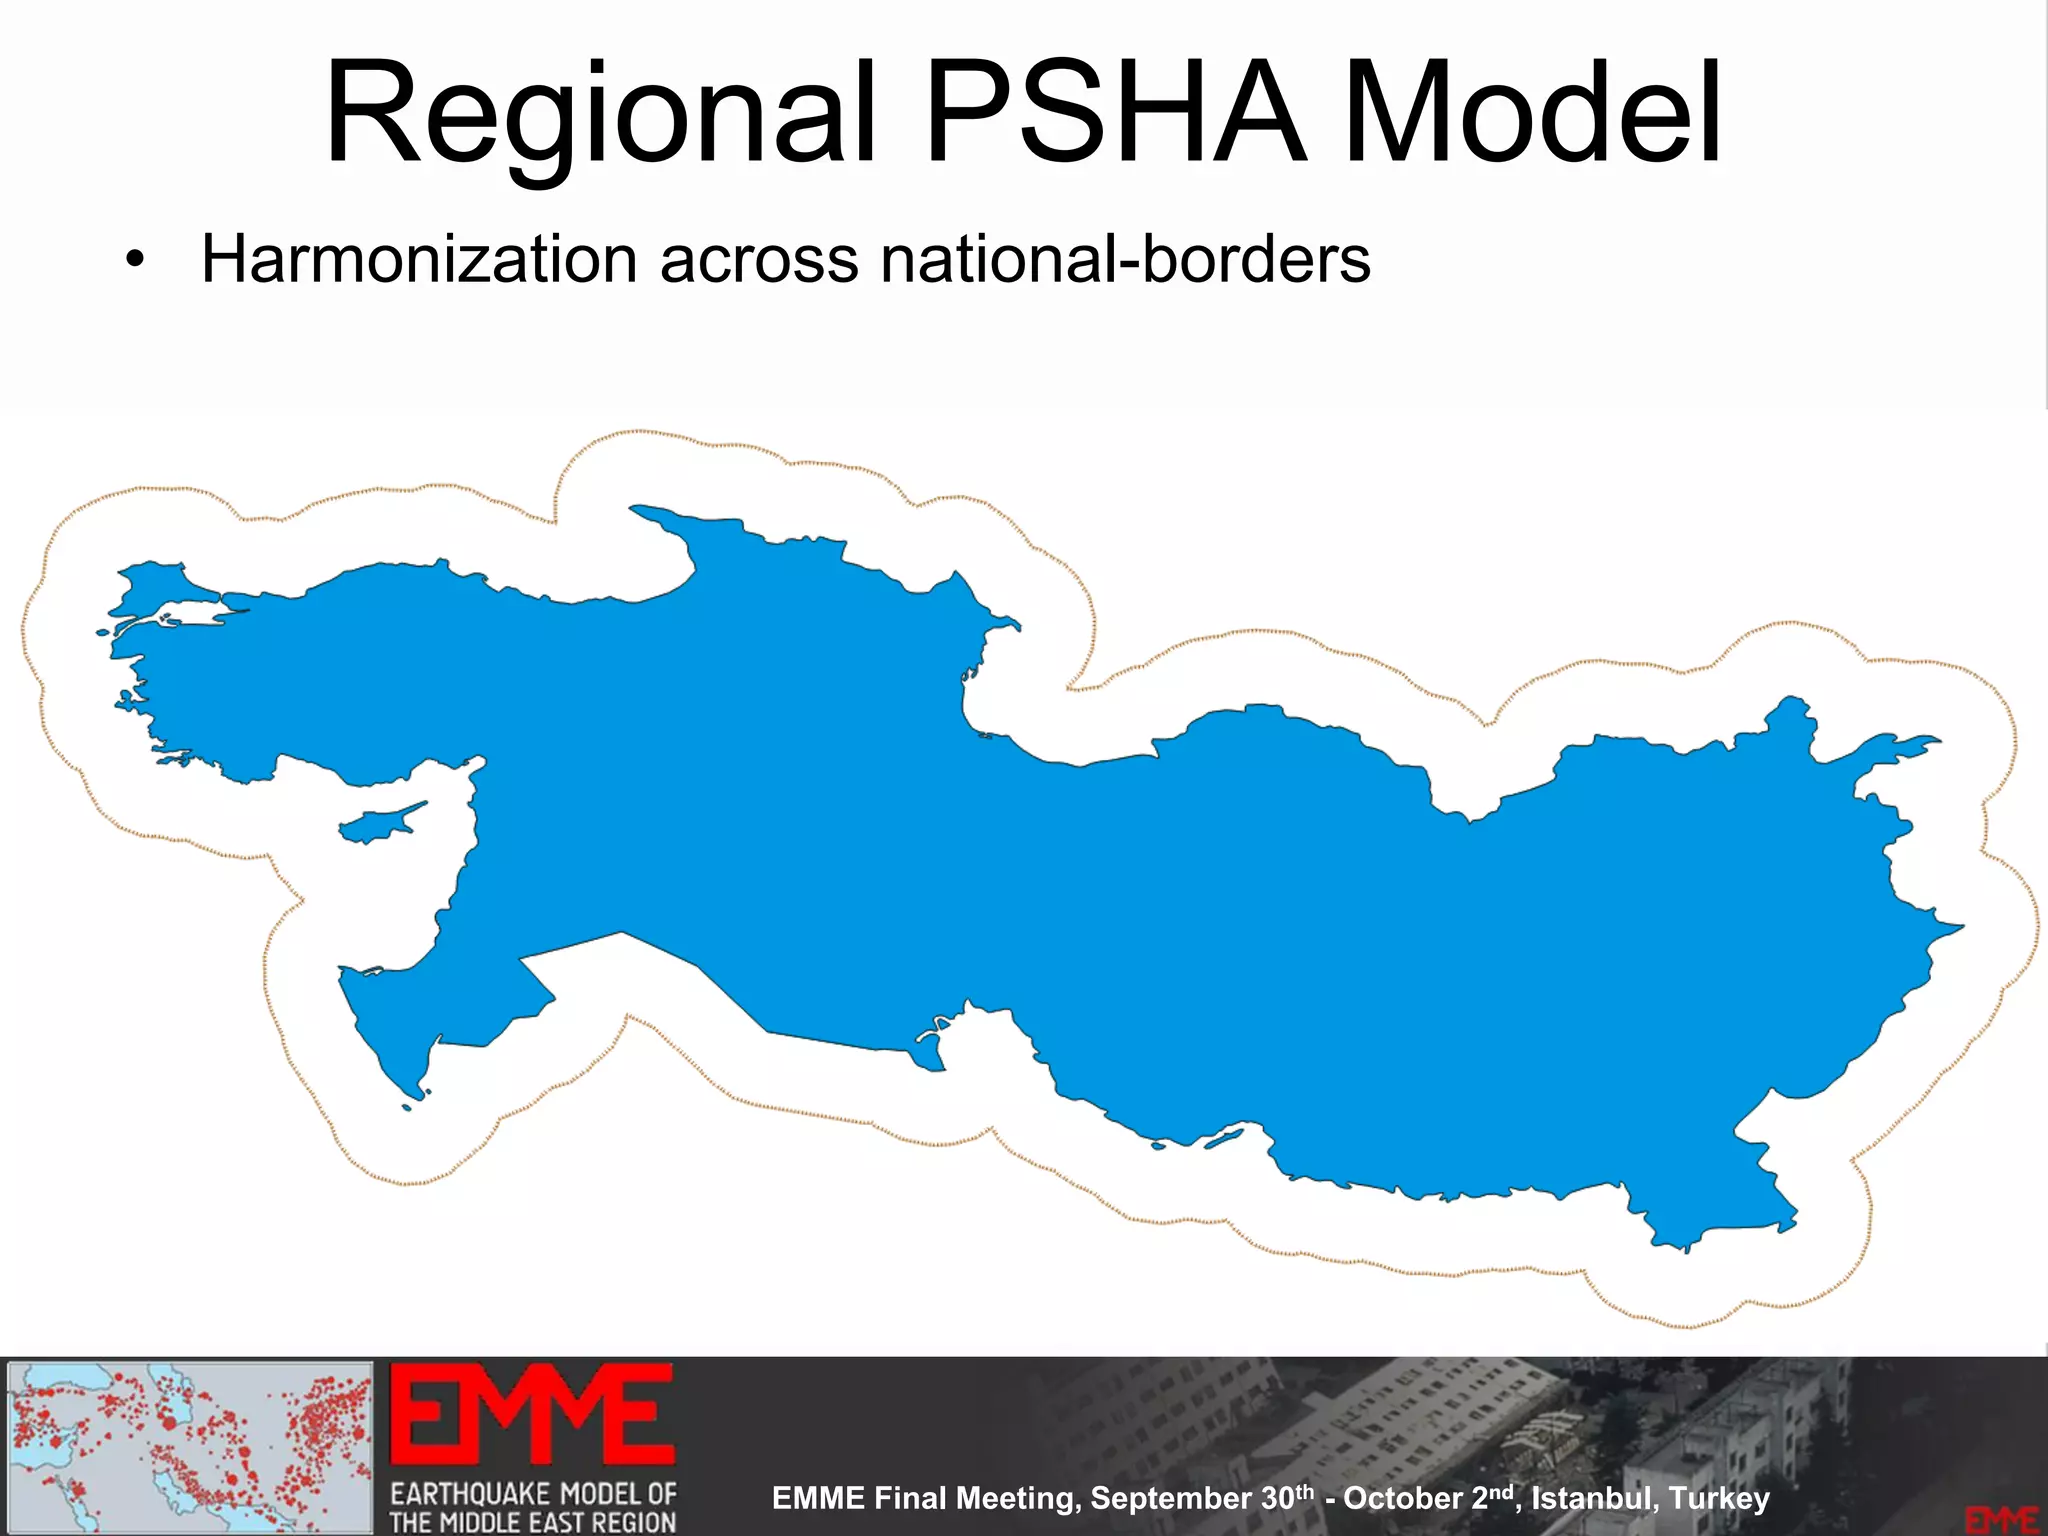
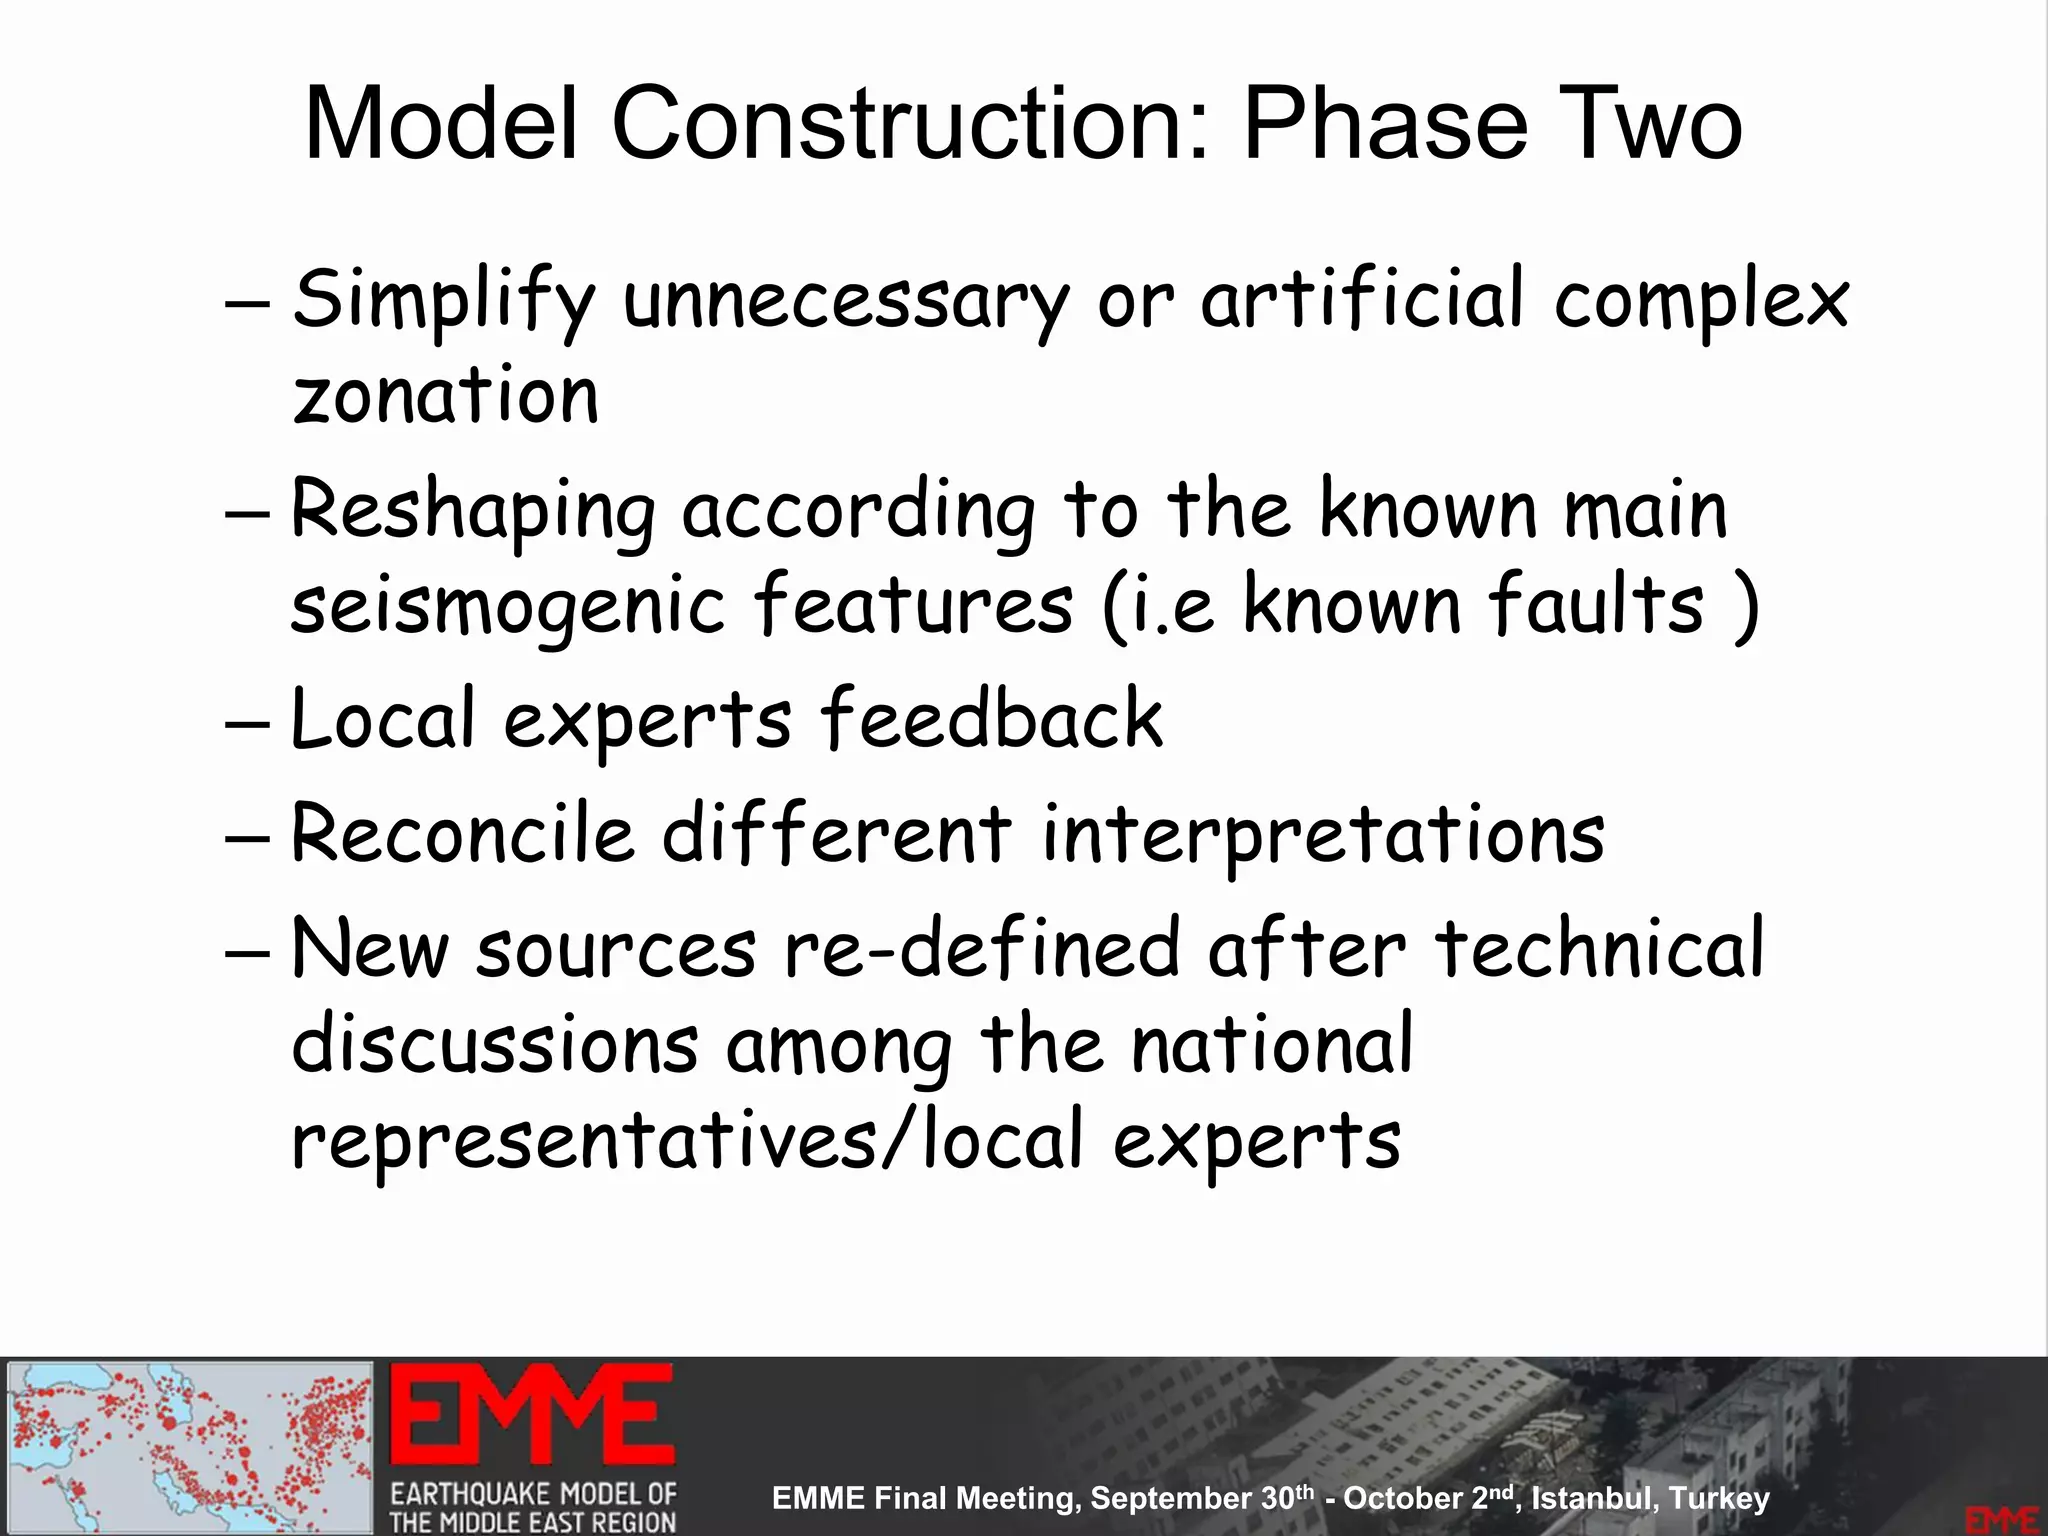
![Model Construction: Phase One
• Country based models
• Phase one:
– Overlapping sources at national borders
• [ trying to keep the original information]
– Remove duplicates (the same source
defined within countries)
– Eliminate zones too small to be analyzed
(spatially smooth seismicity take cares of
it)](https://image.slidesharecdn.com/emmesourcemodeldanciuetal201309-130930095907-phpapp01/75/Seismic-Hazard-Model-for-the-Middle-East-Region-Laurentiu-Danciu-Swiss-Seismological-Service-ETH-Zurich-Switzerland-GEM-Hazard-Modeler-Karin-Sesetyan-Mine-Demircioglu-Kandilli-Observatory-and-Earthquake-Research-Institute-Istanbul-Turkey-26-2048.jpg)
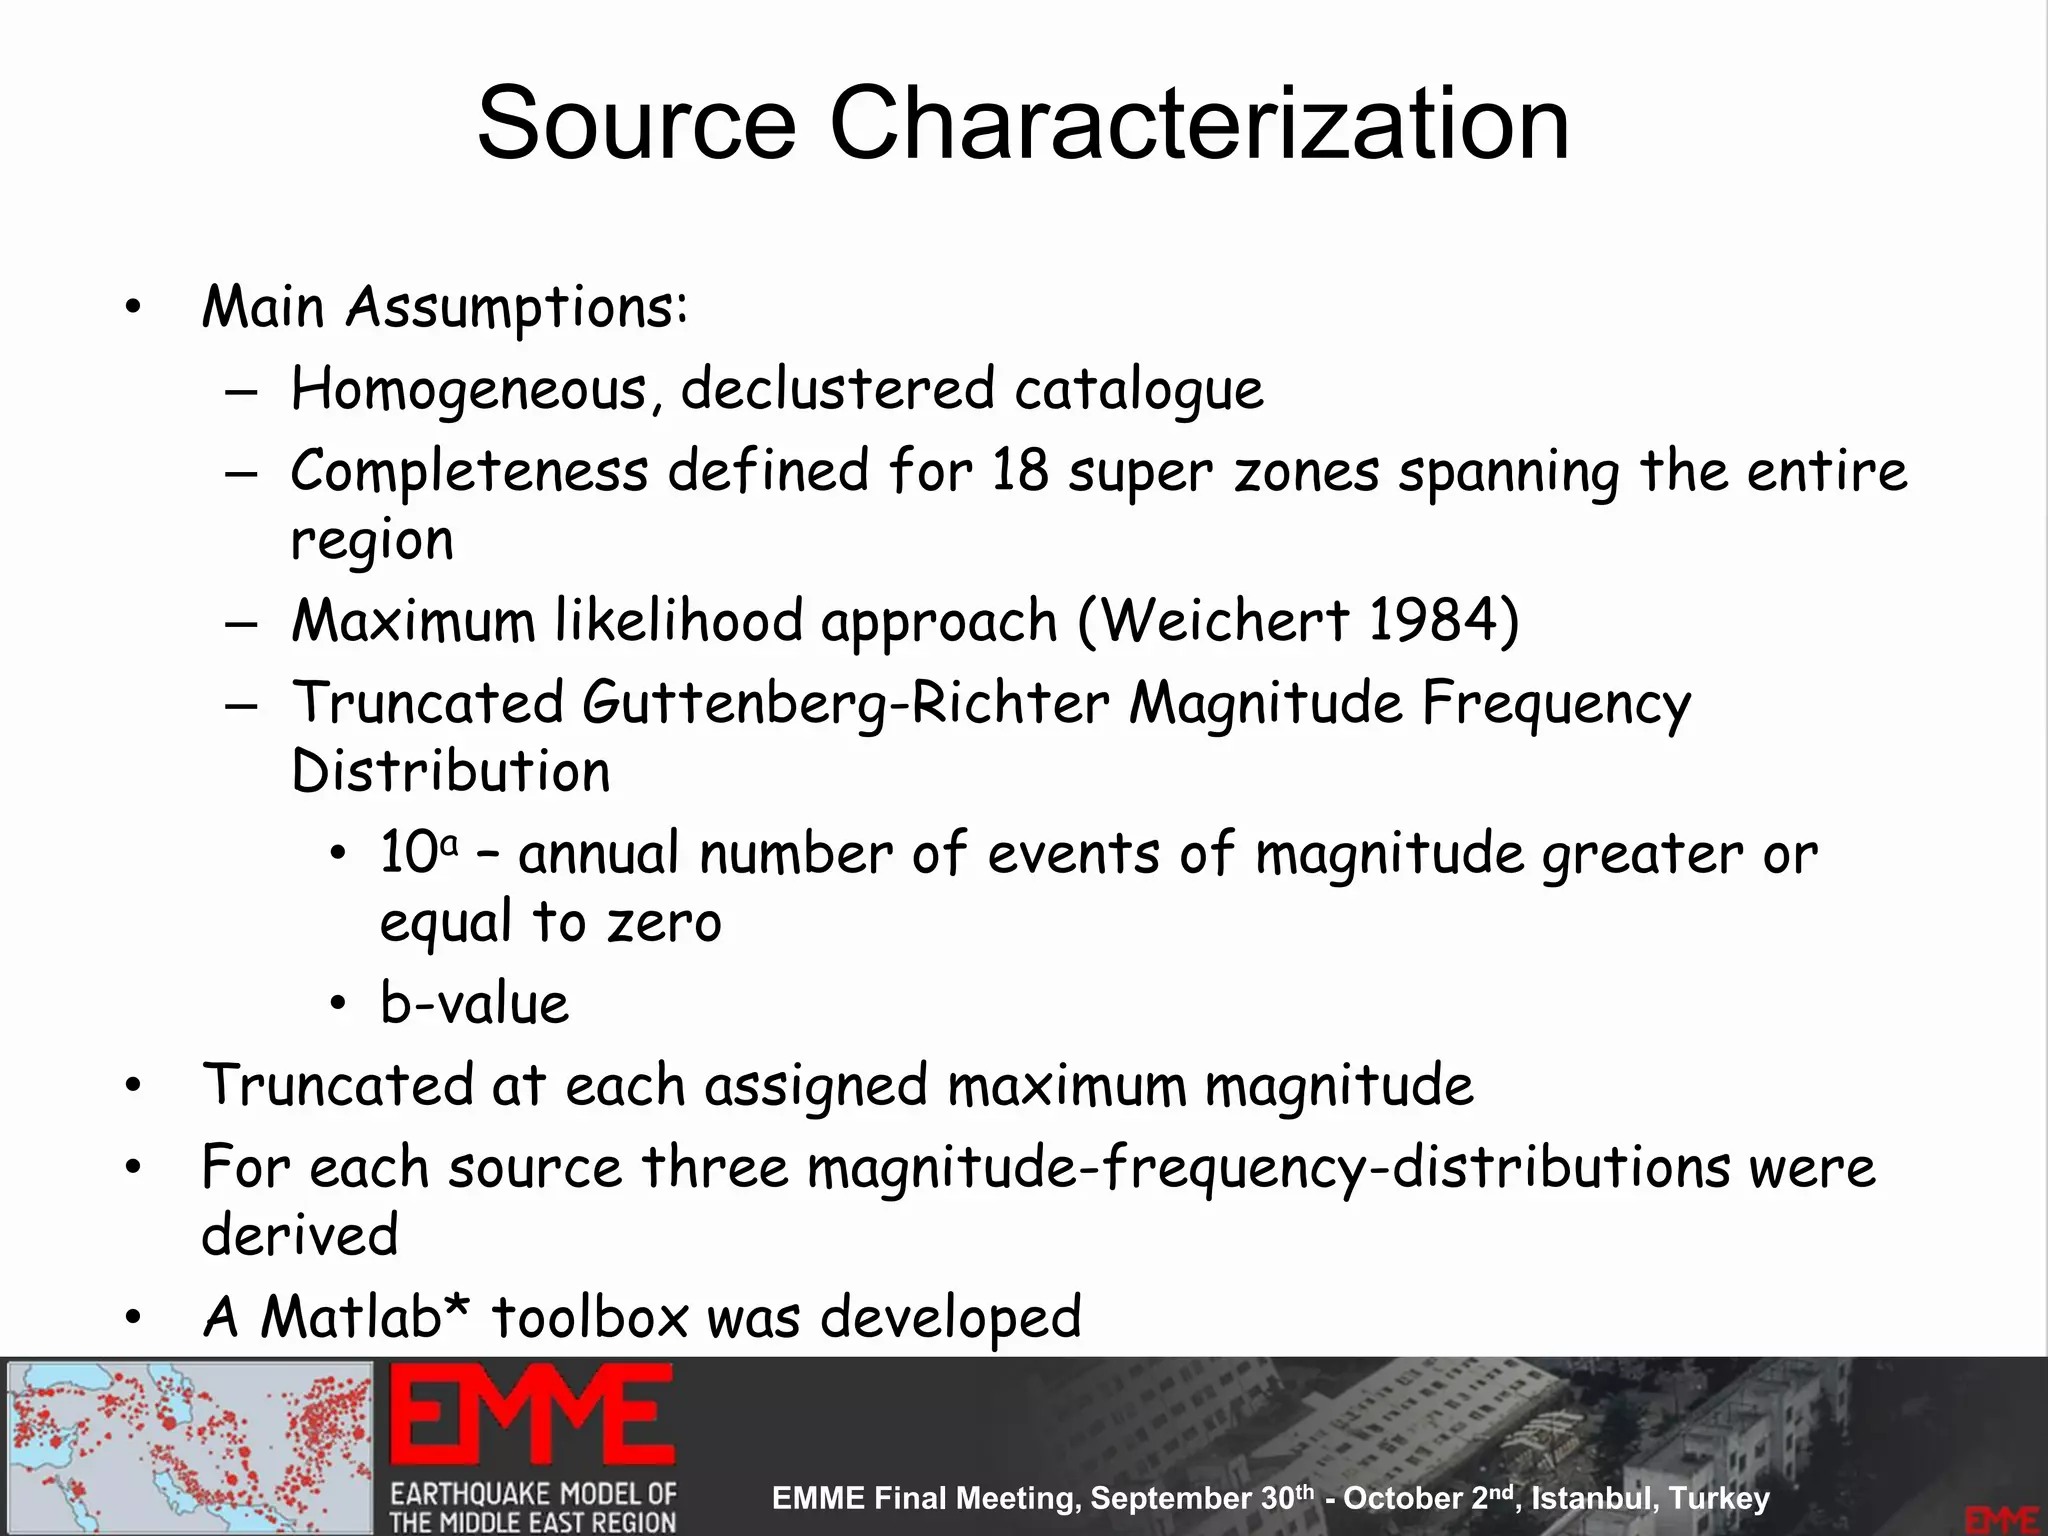
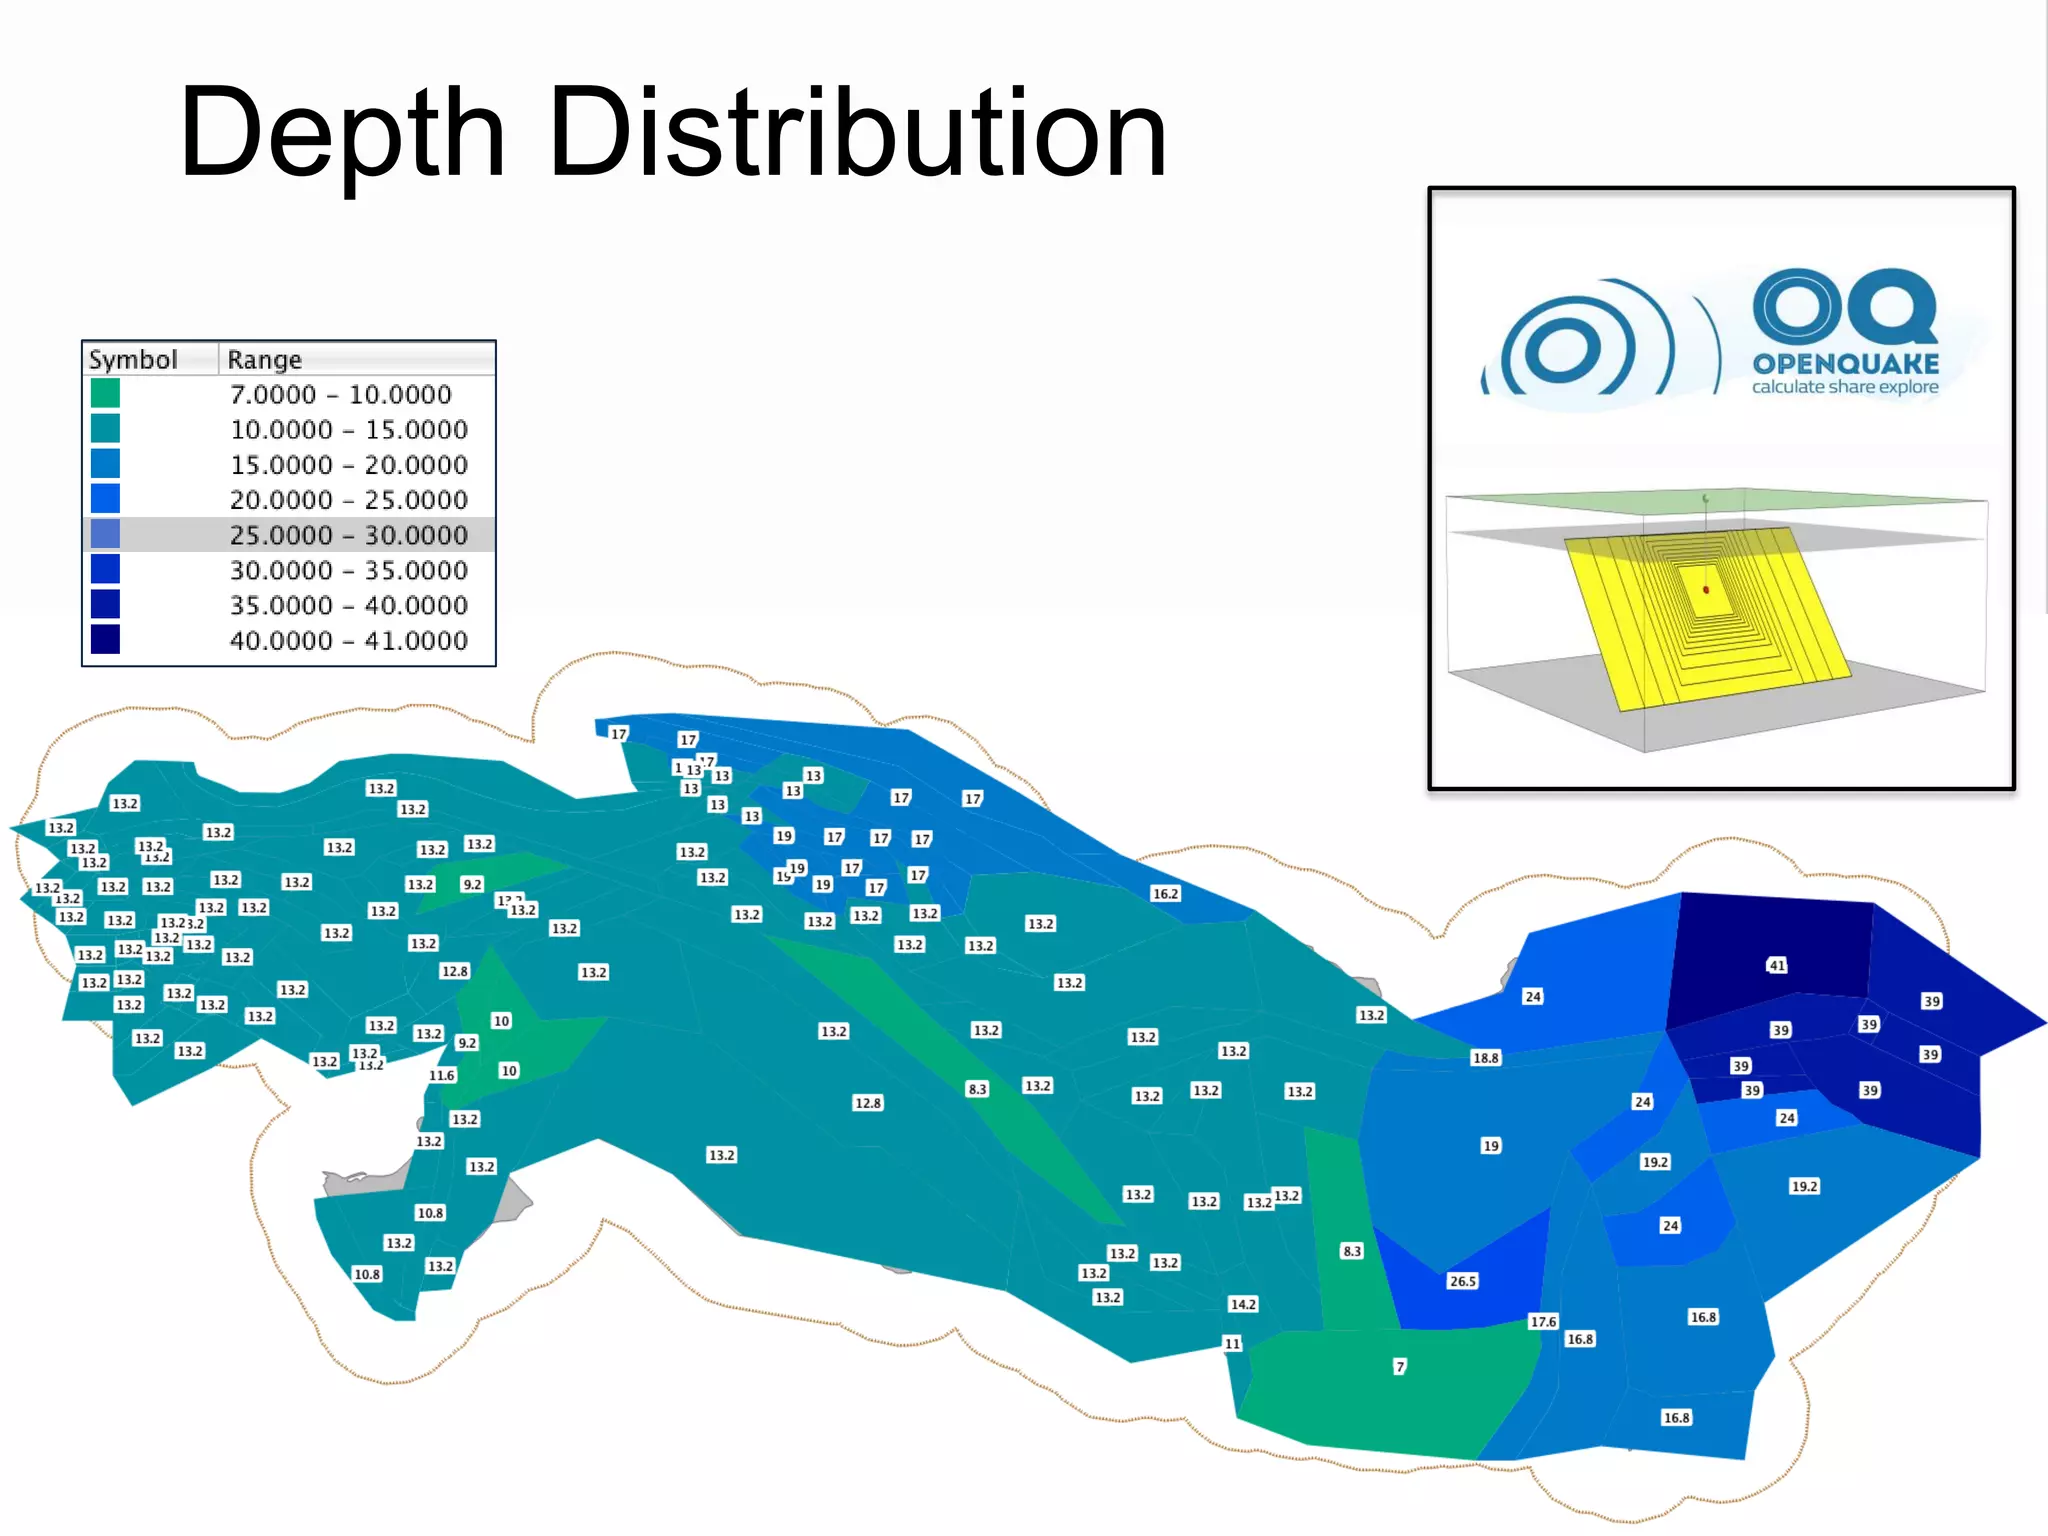
![Source Parameterization
• Depth Distribution (three values and the
corresponding weights):
– Active shallow crust
– Nested Deep Seismicity
– Subduction Inslab
• Focal Mechanisms
– Rake Angle values (Aki’s definition)
– Percentage weights
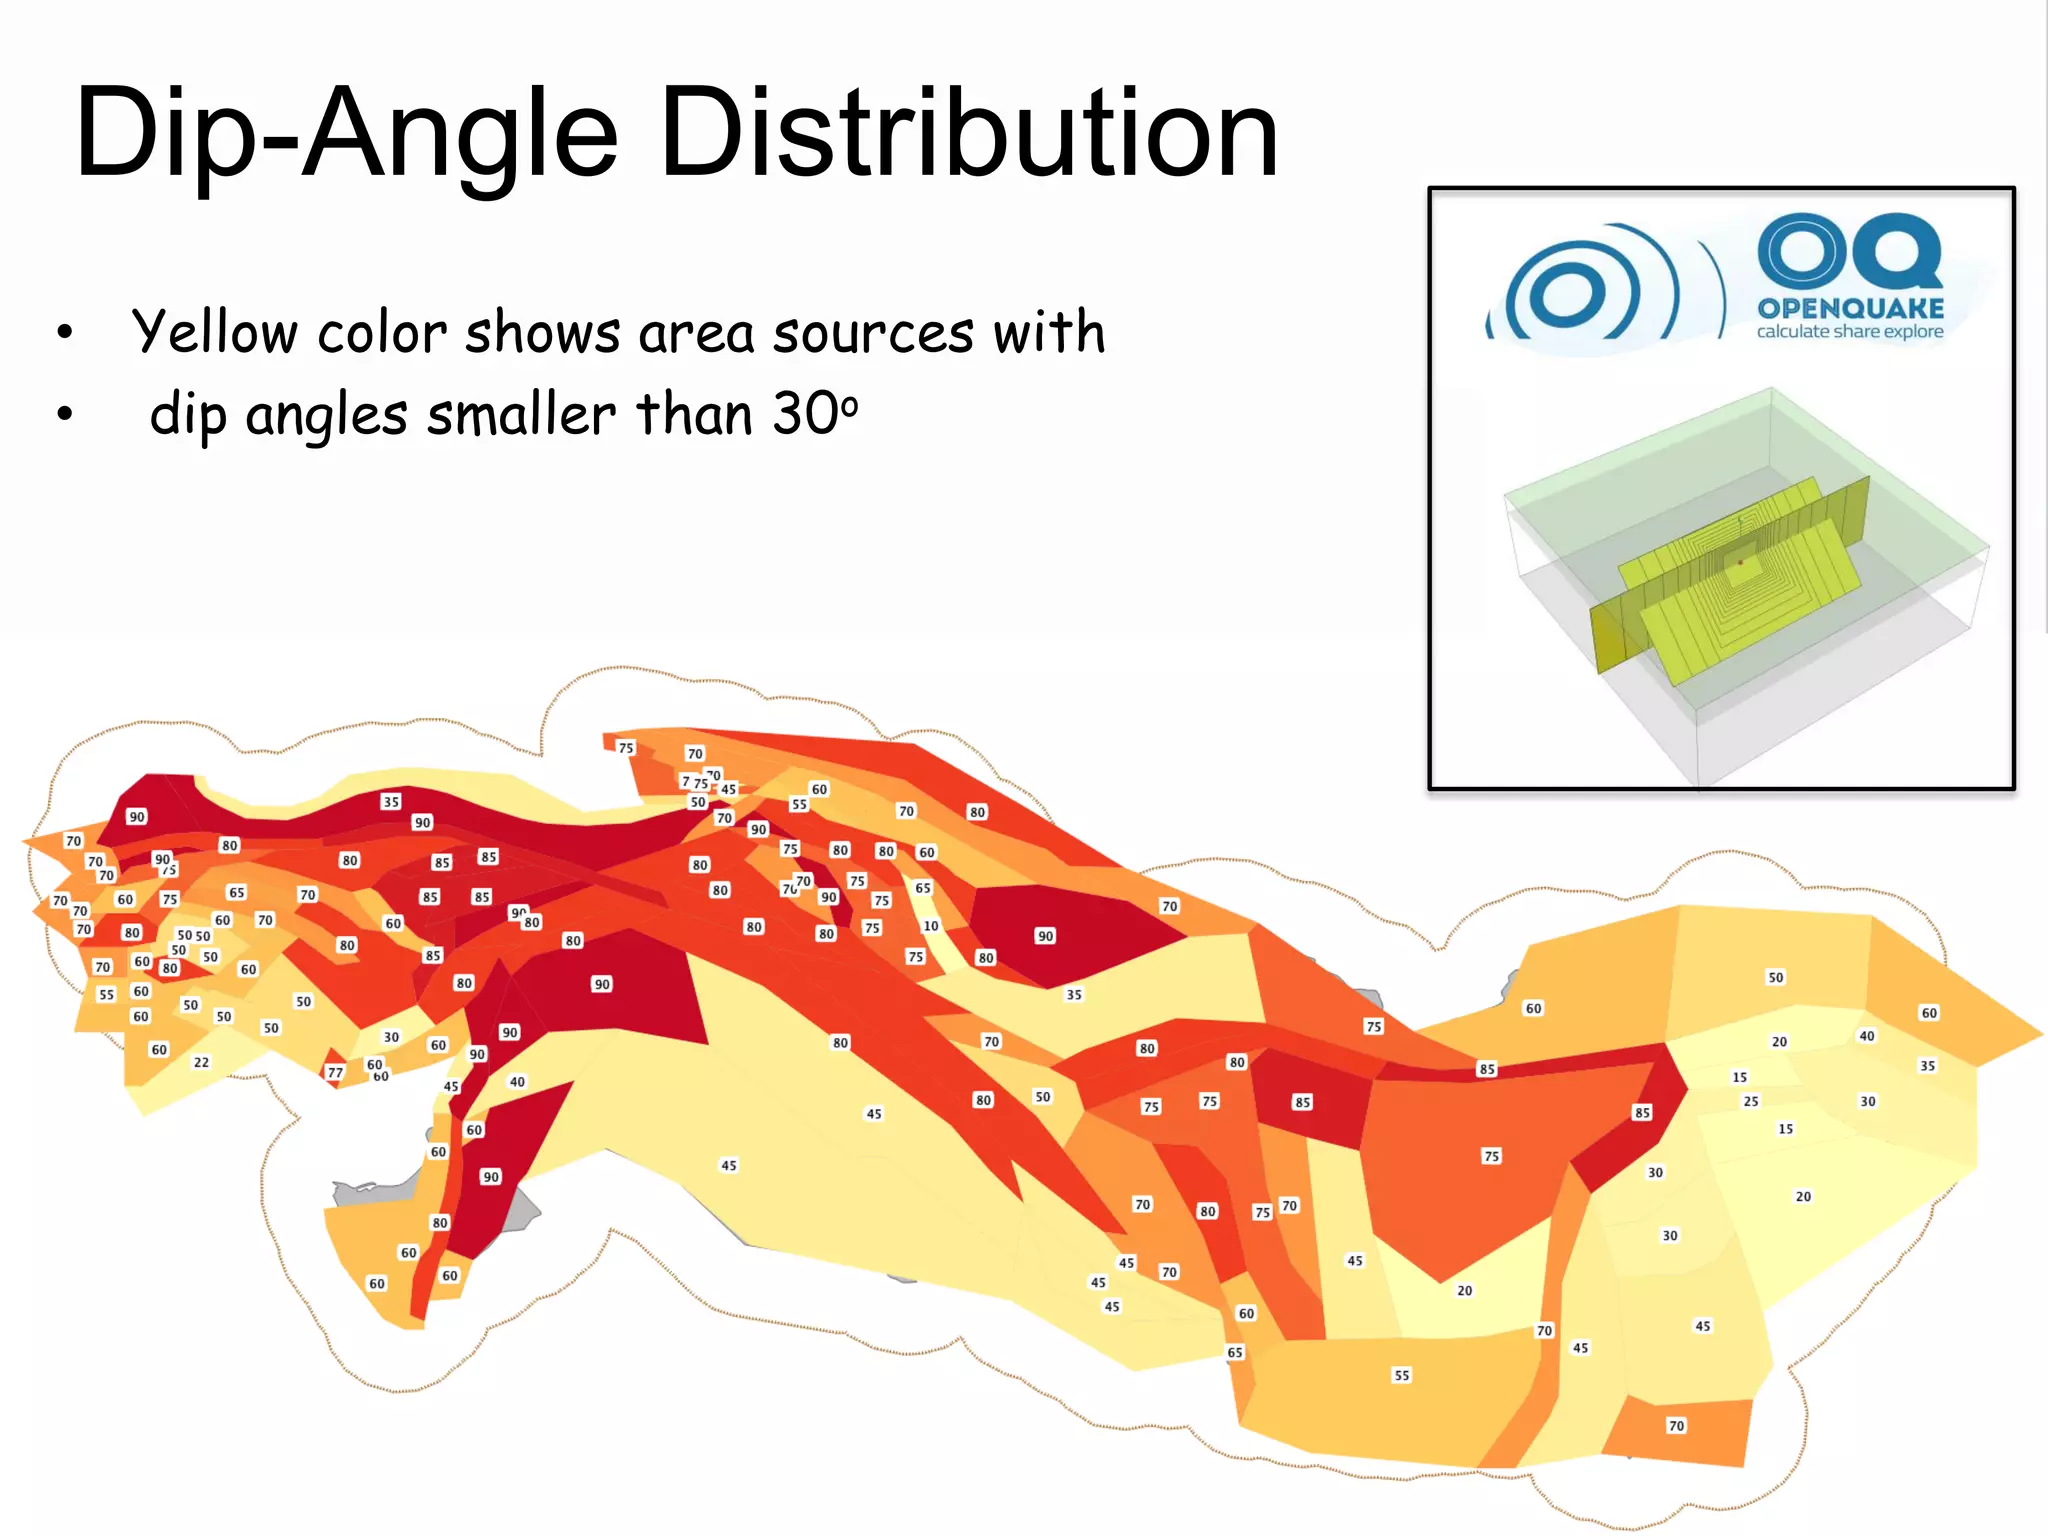
• Ruptures Orientation
– Strike Angle (Azimuth)
– Dip Angle
• Rupture Properties
– Upper and Lower Seismogenic Depth
Complex Fault
Area Source
[Single Rupture]](https://image.slidesharecdn.com/emmesourcemodeldanciuetal201309-130930095907-phpapp01/75/Seismic-Hazard-Model-for-the-Middle-East-Region-Laurentiu-Danciu-Swiss-Seismological-Service-ETH-Zurich-Switzerland-GEM-Hazard-Modeler-Karin-Sesetyan-Mine-Demircioglu-Kandilli-Observatory-and-Earthquake-Research-Institute-Istanbul-Turkey-43-2048.jpg)
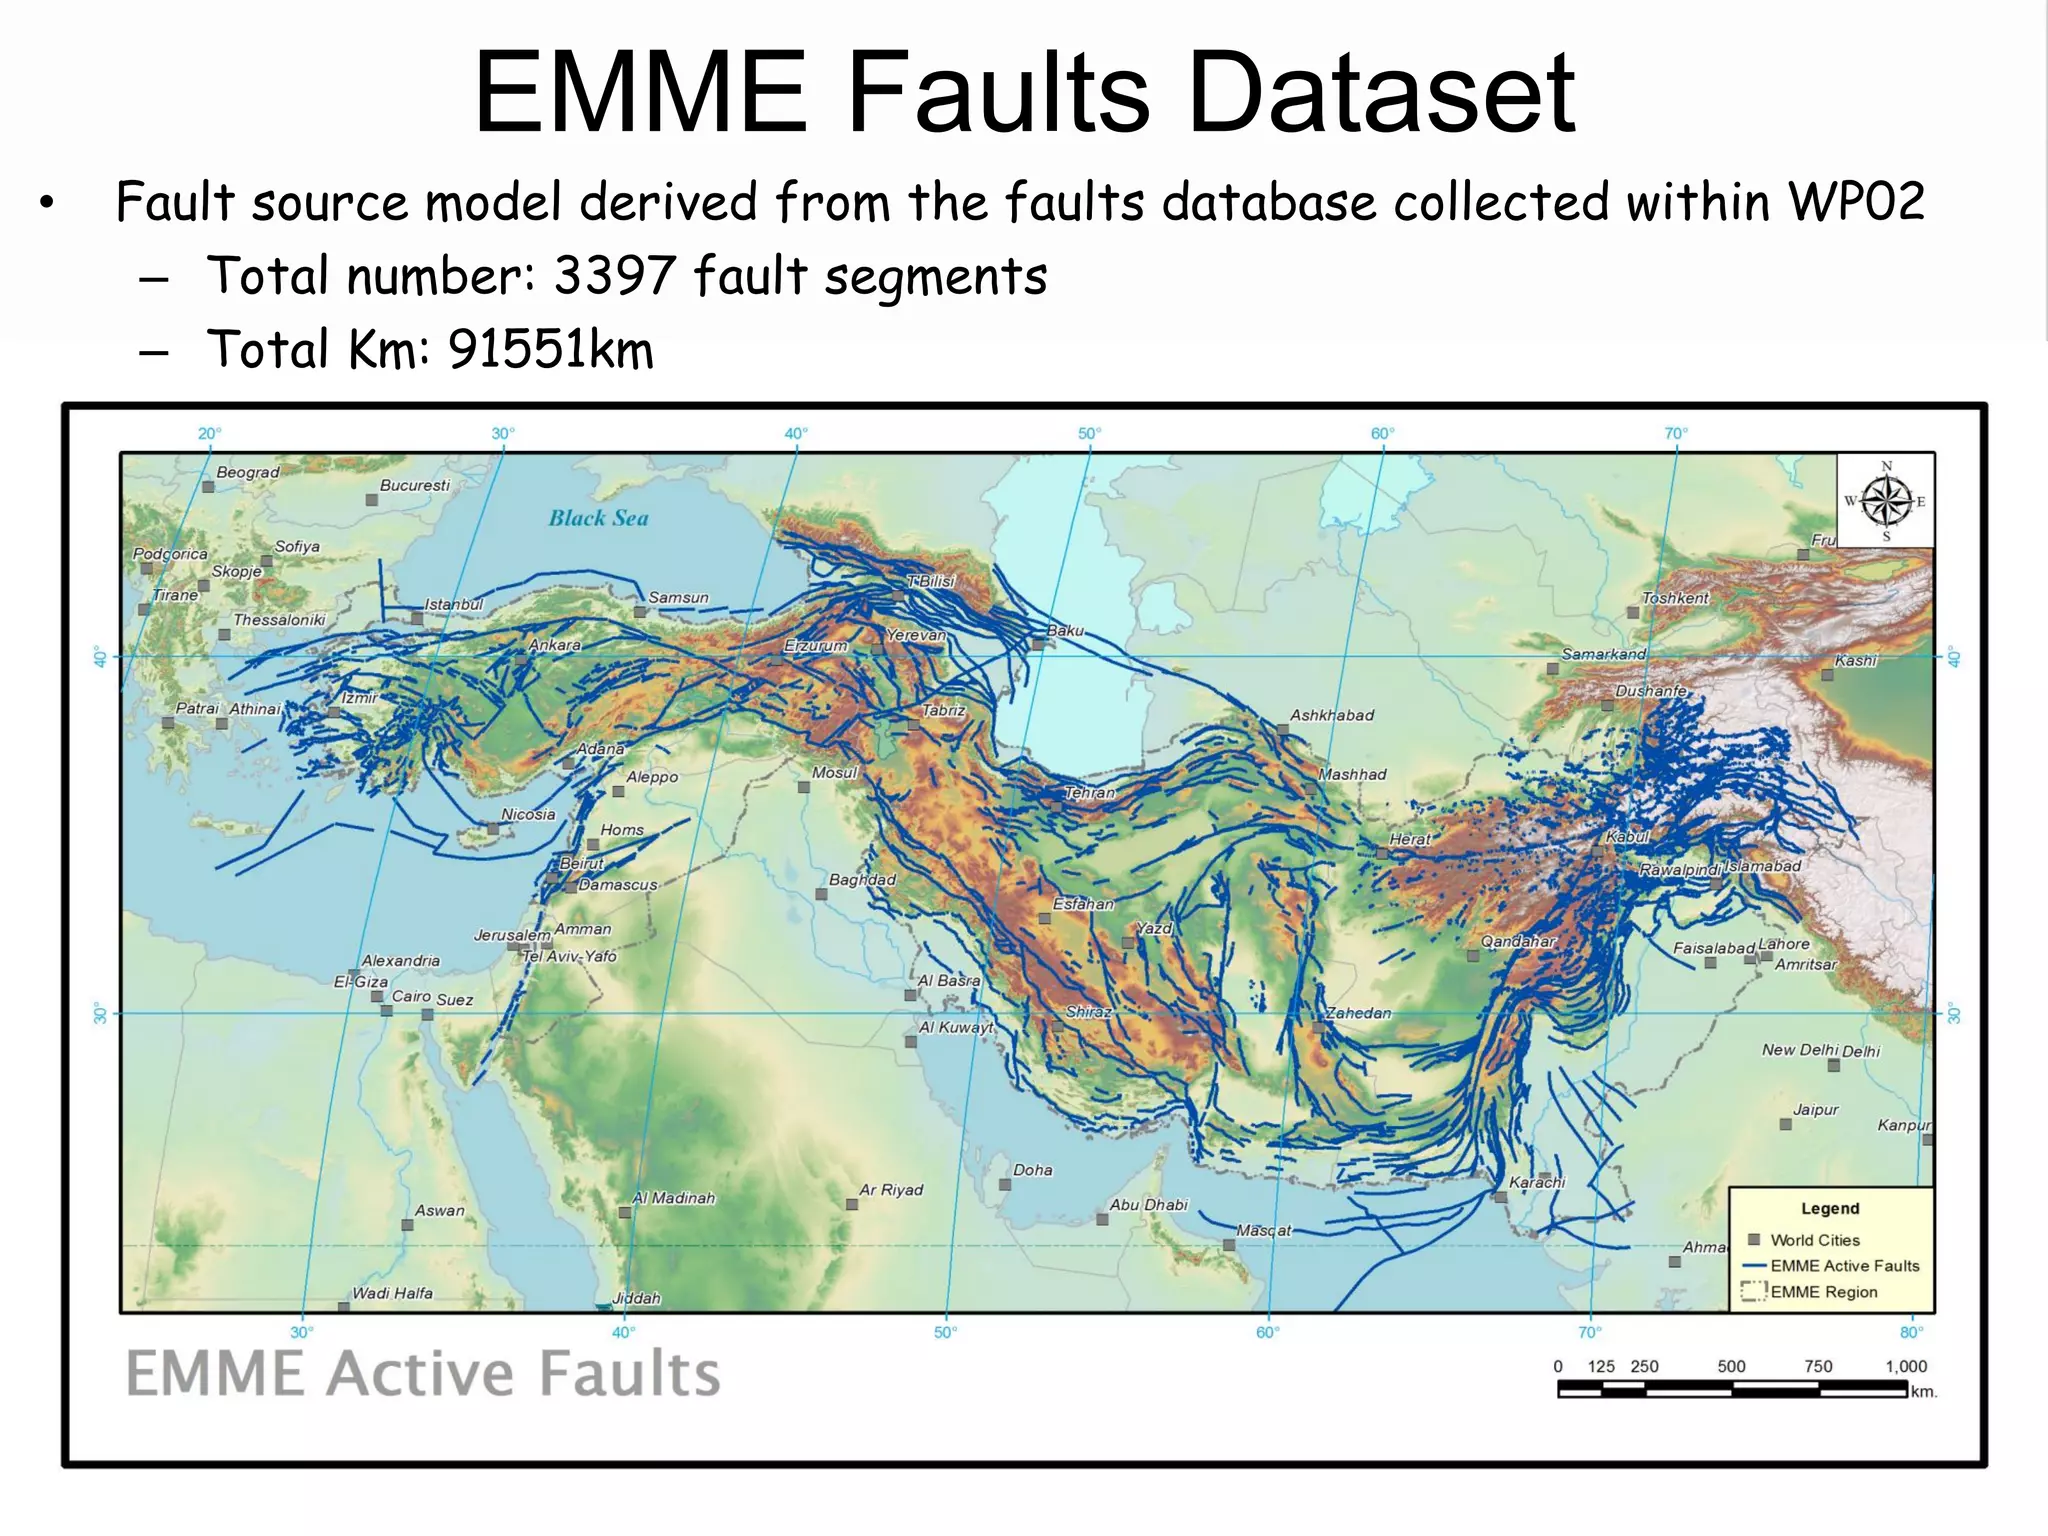
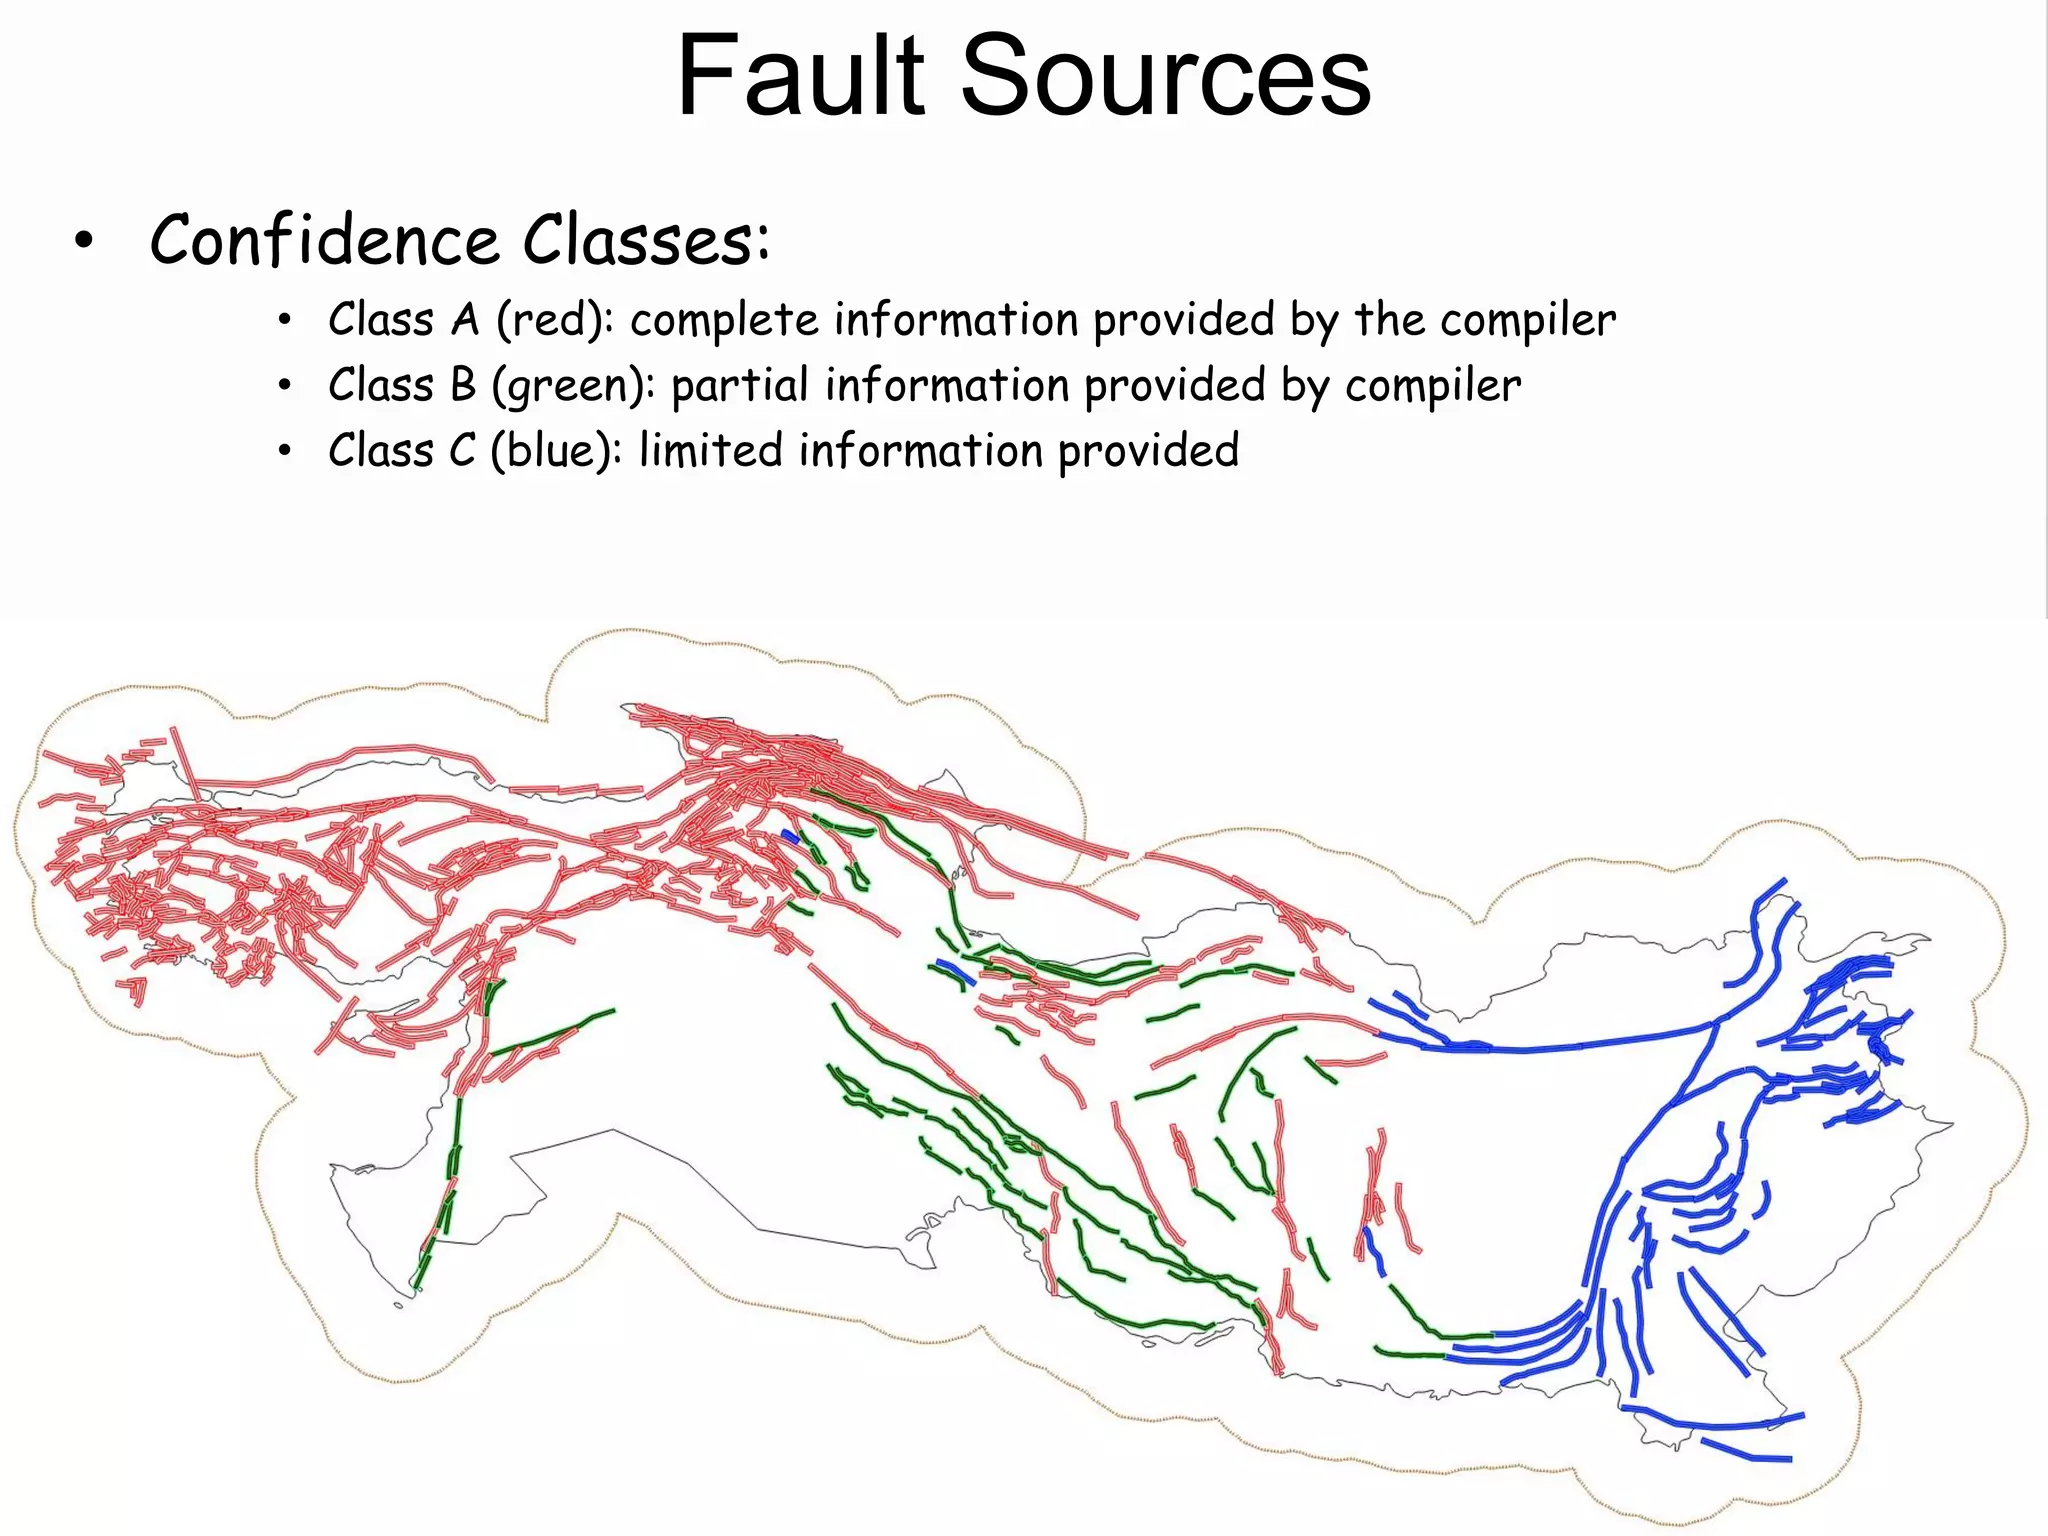
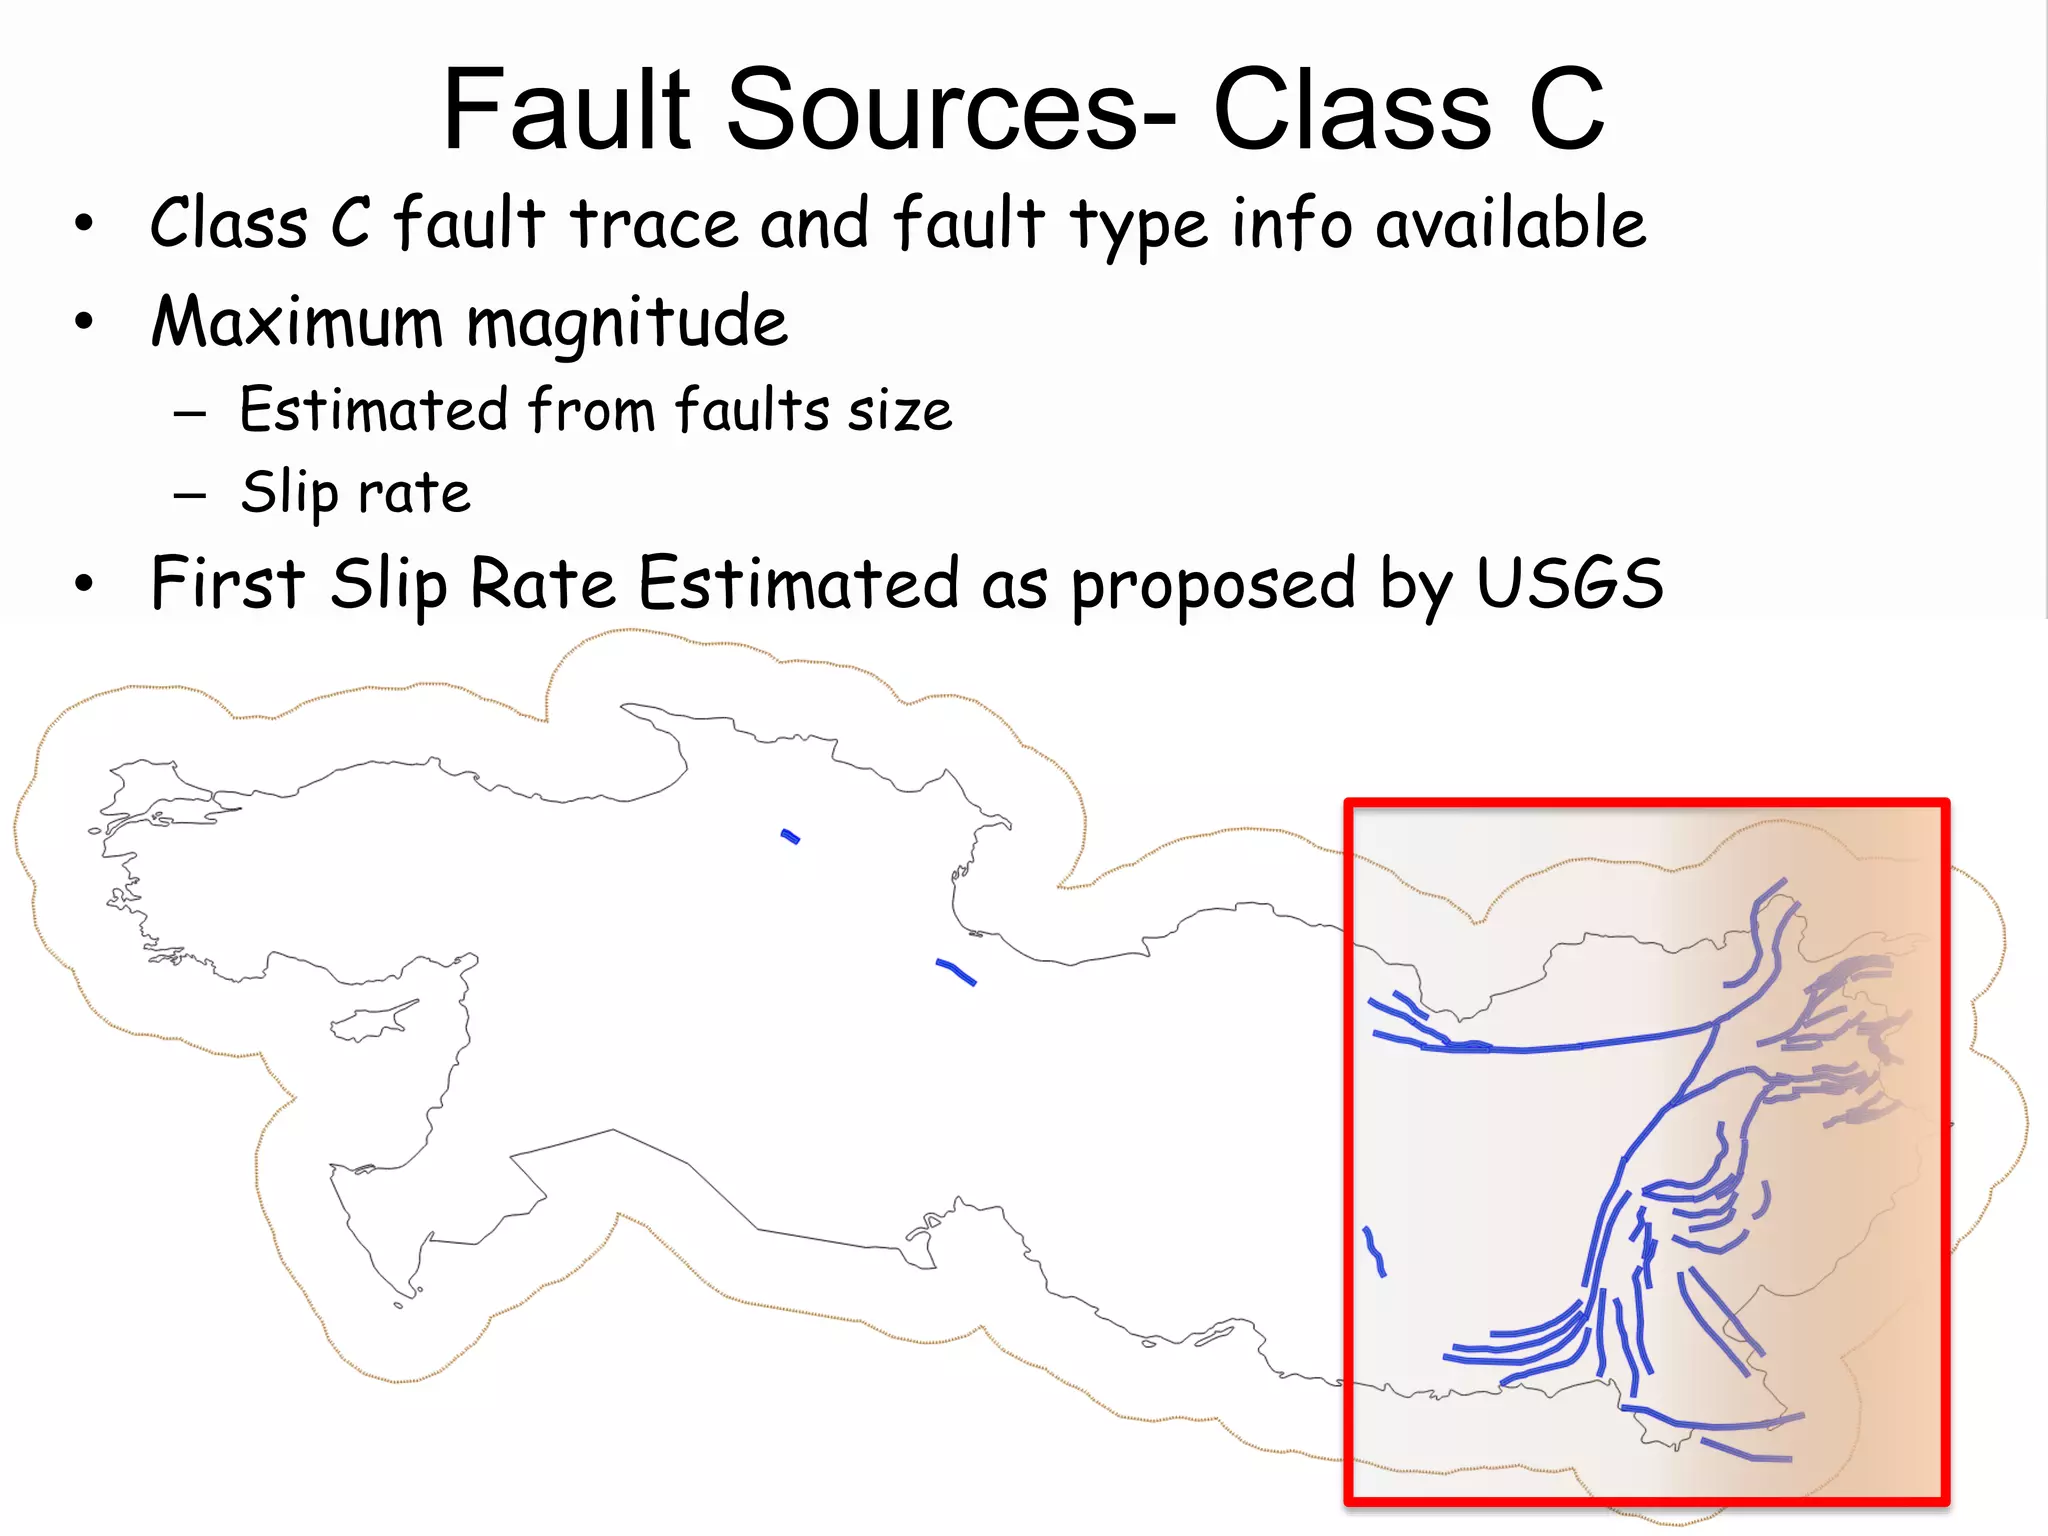
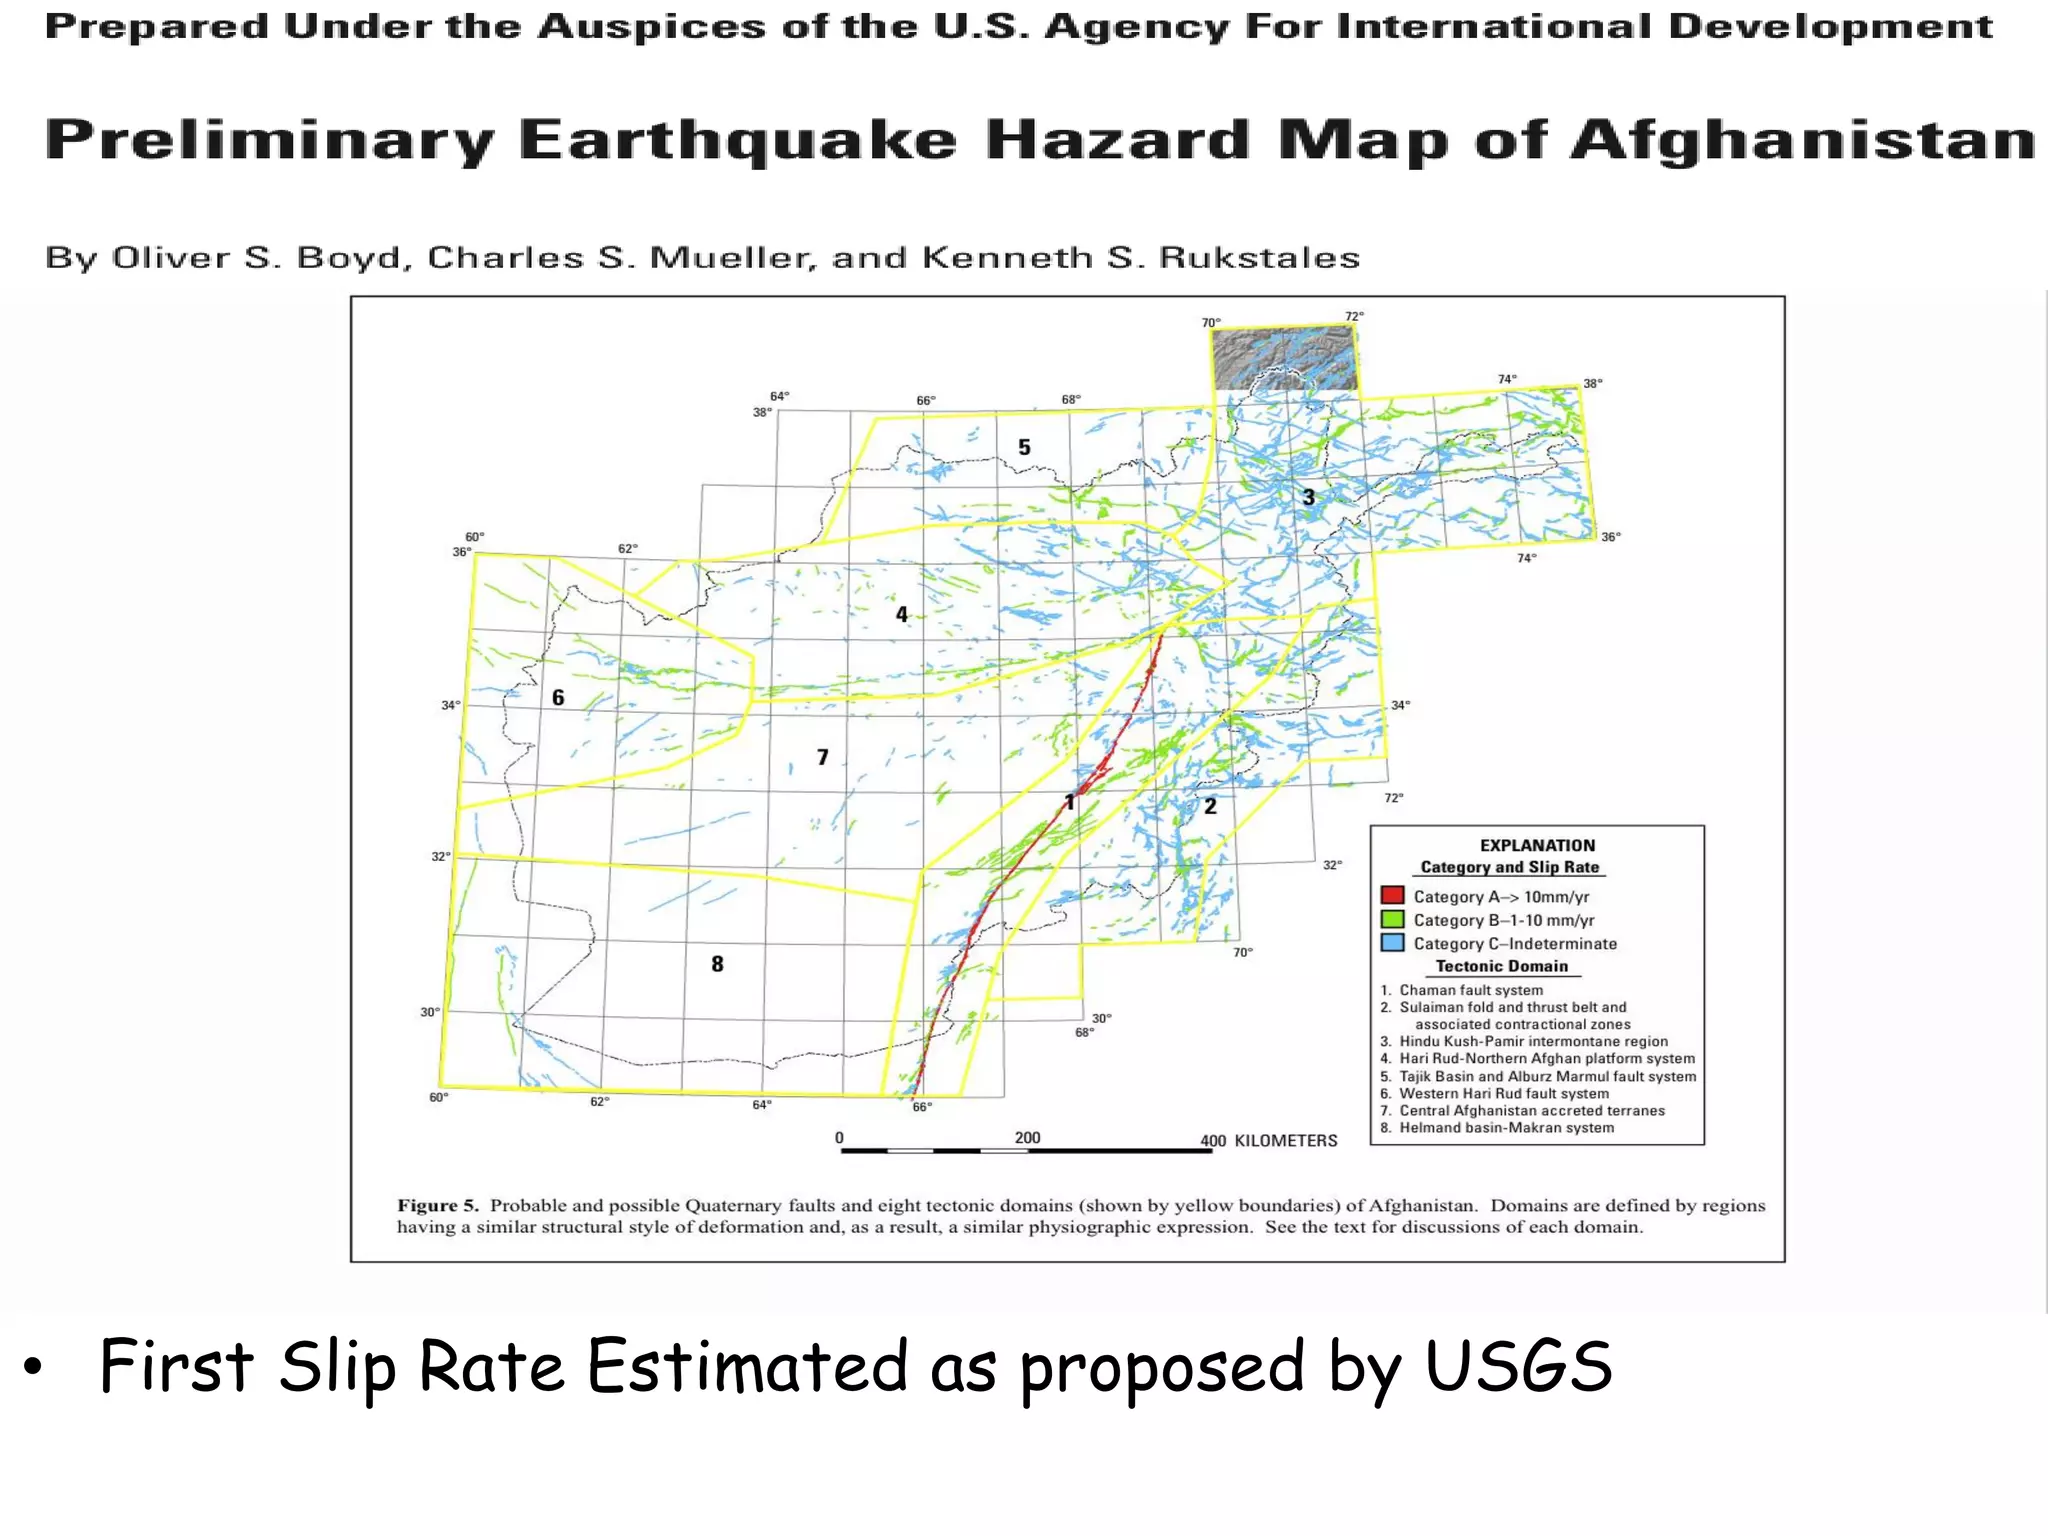
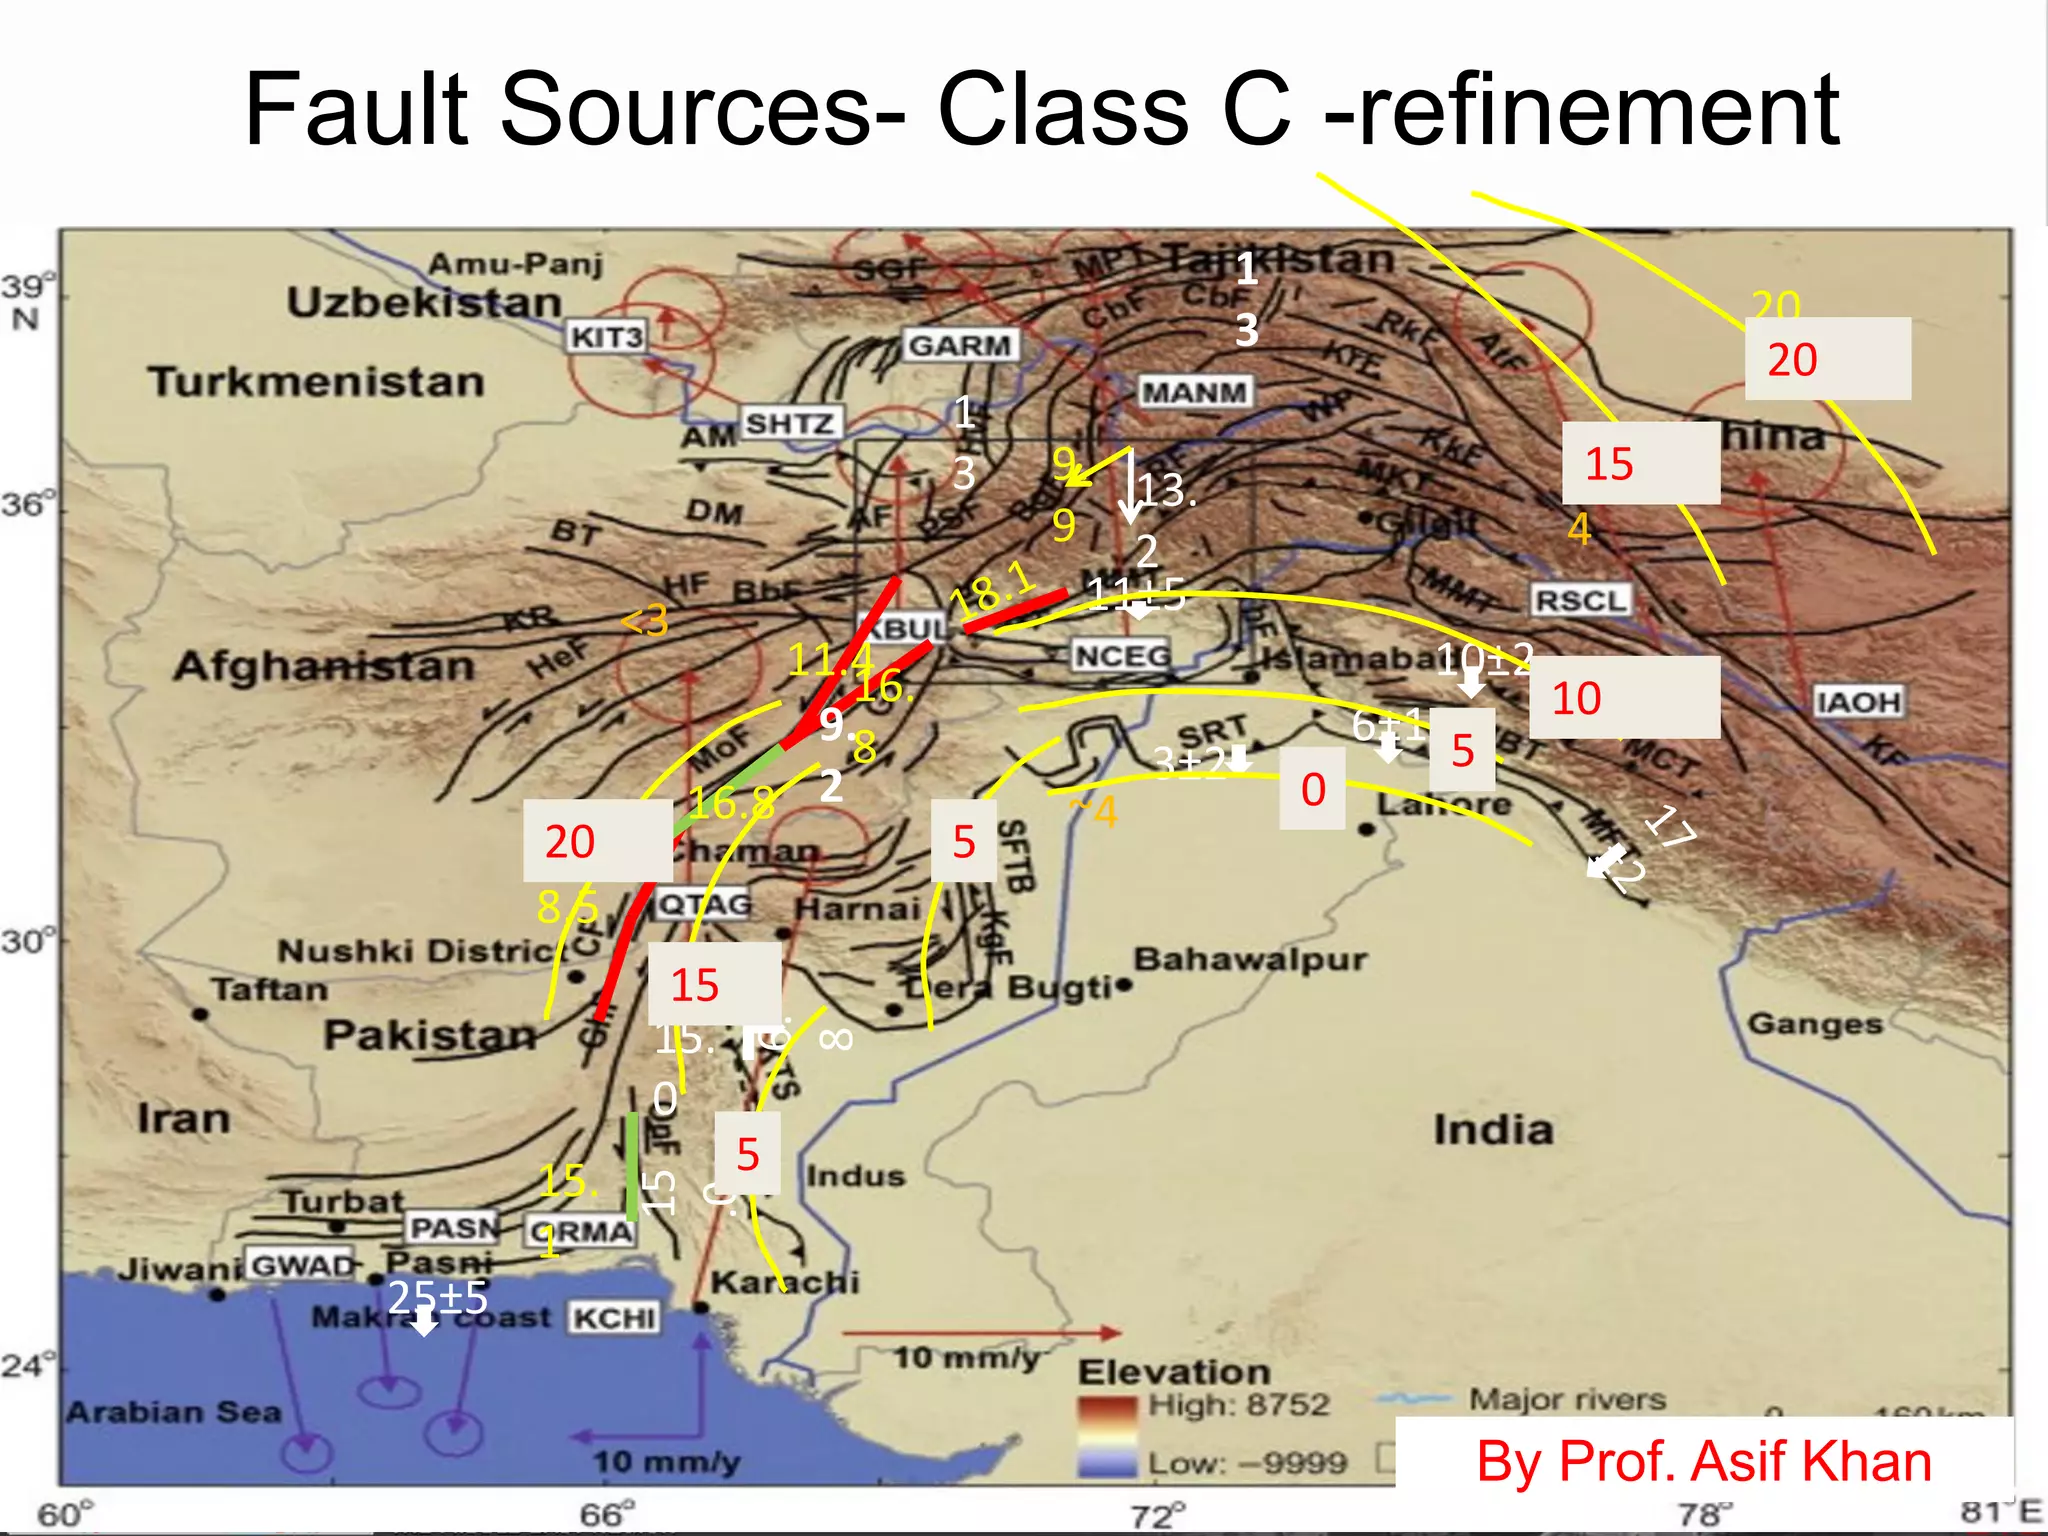
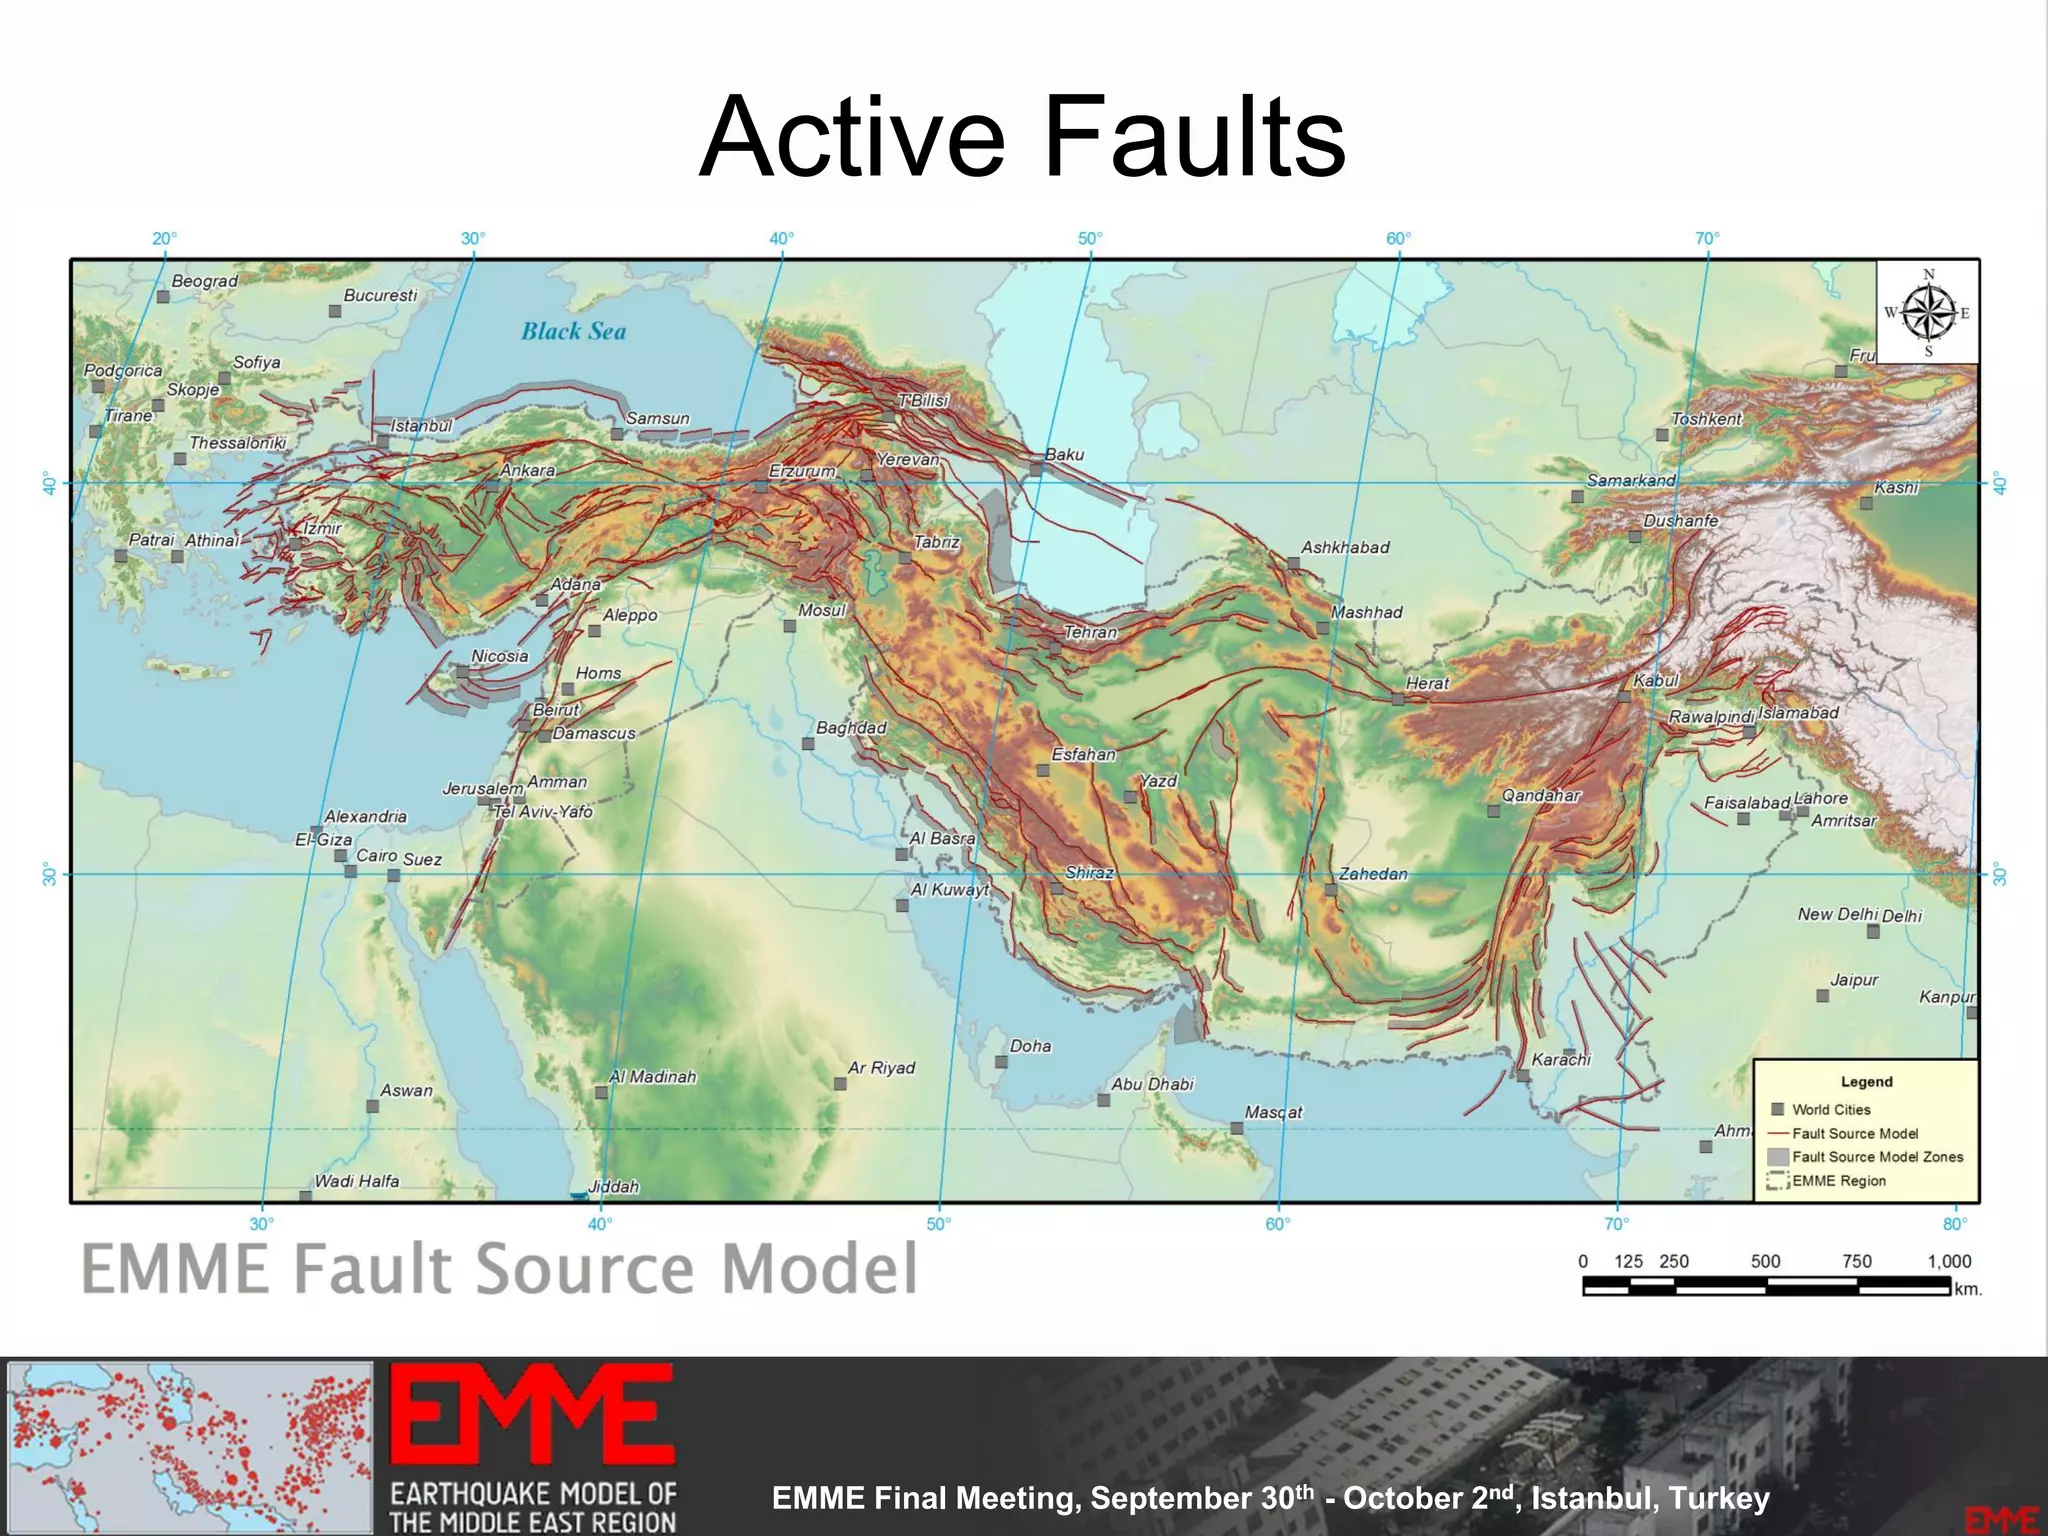
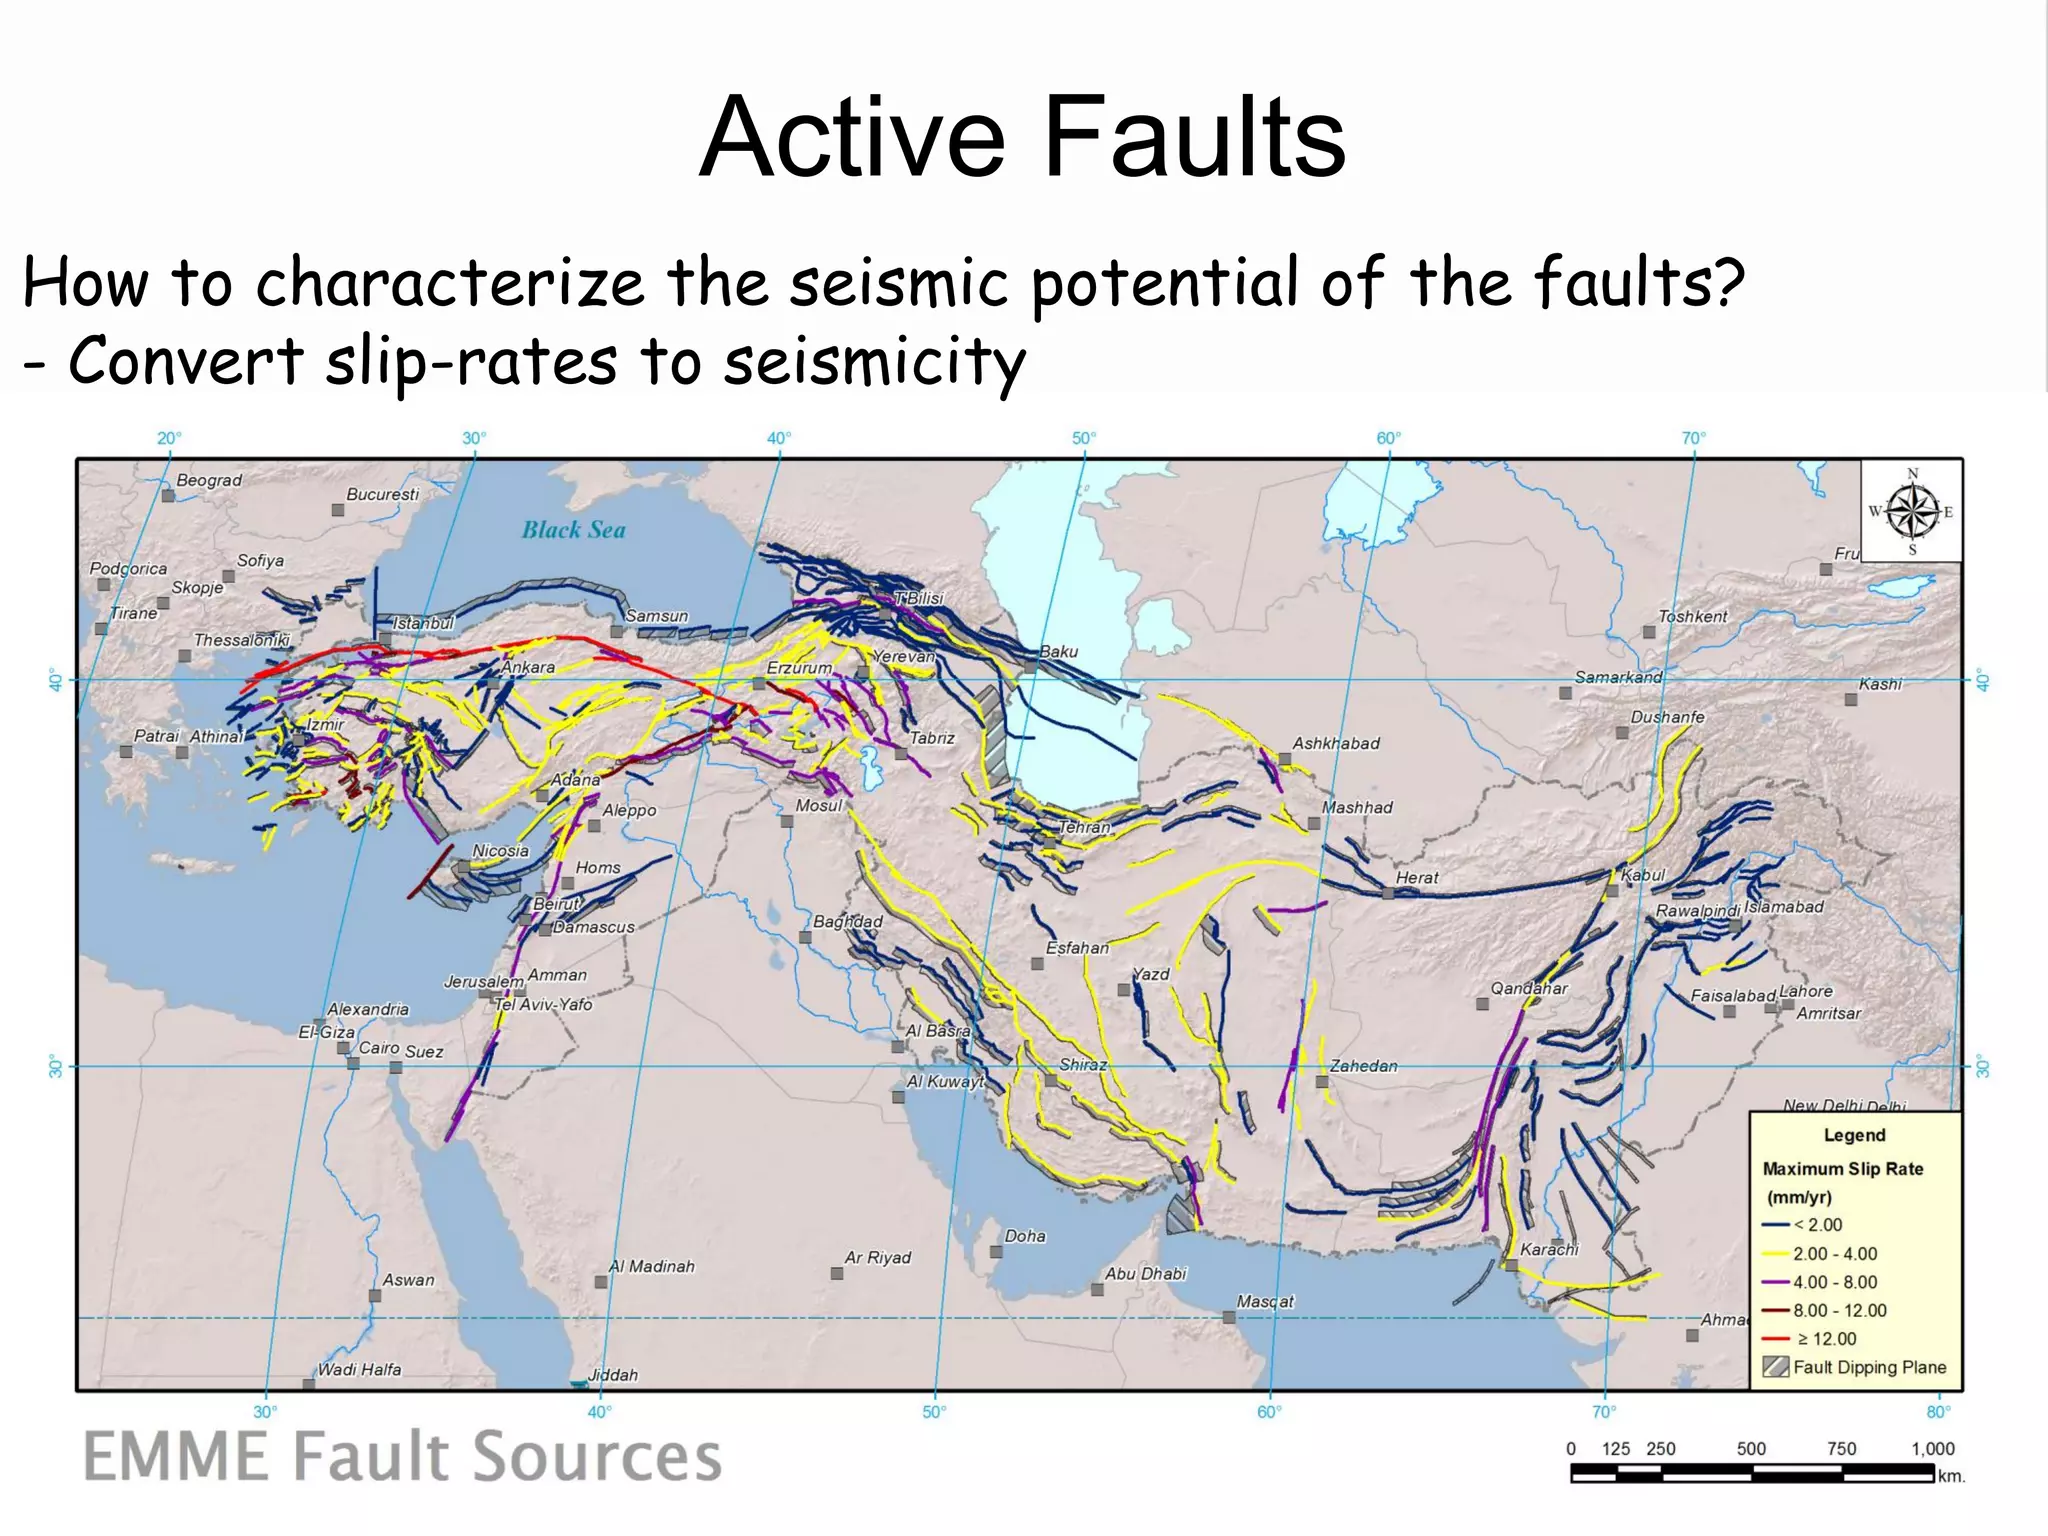
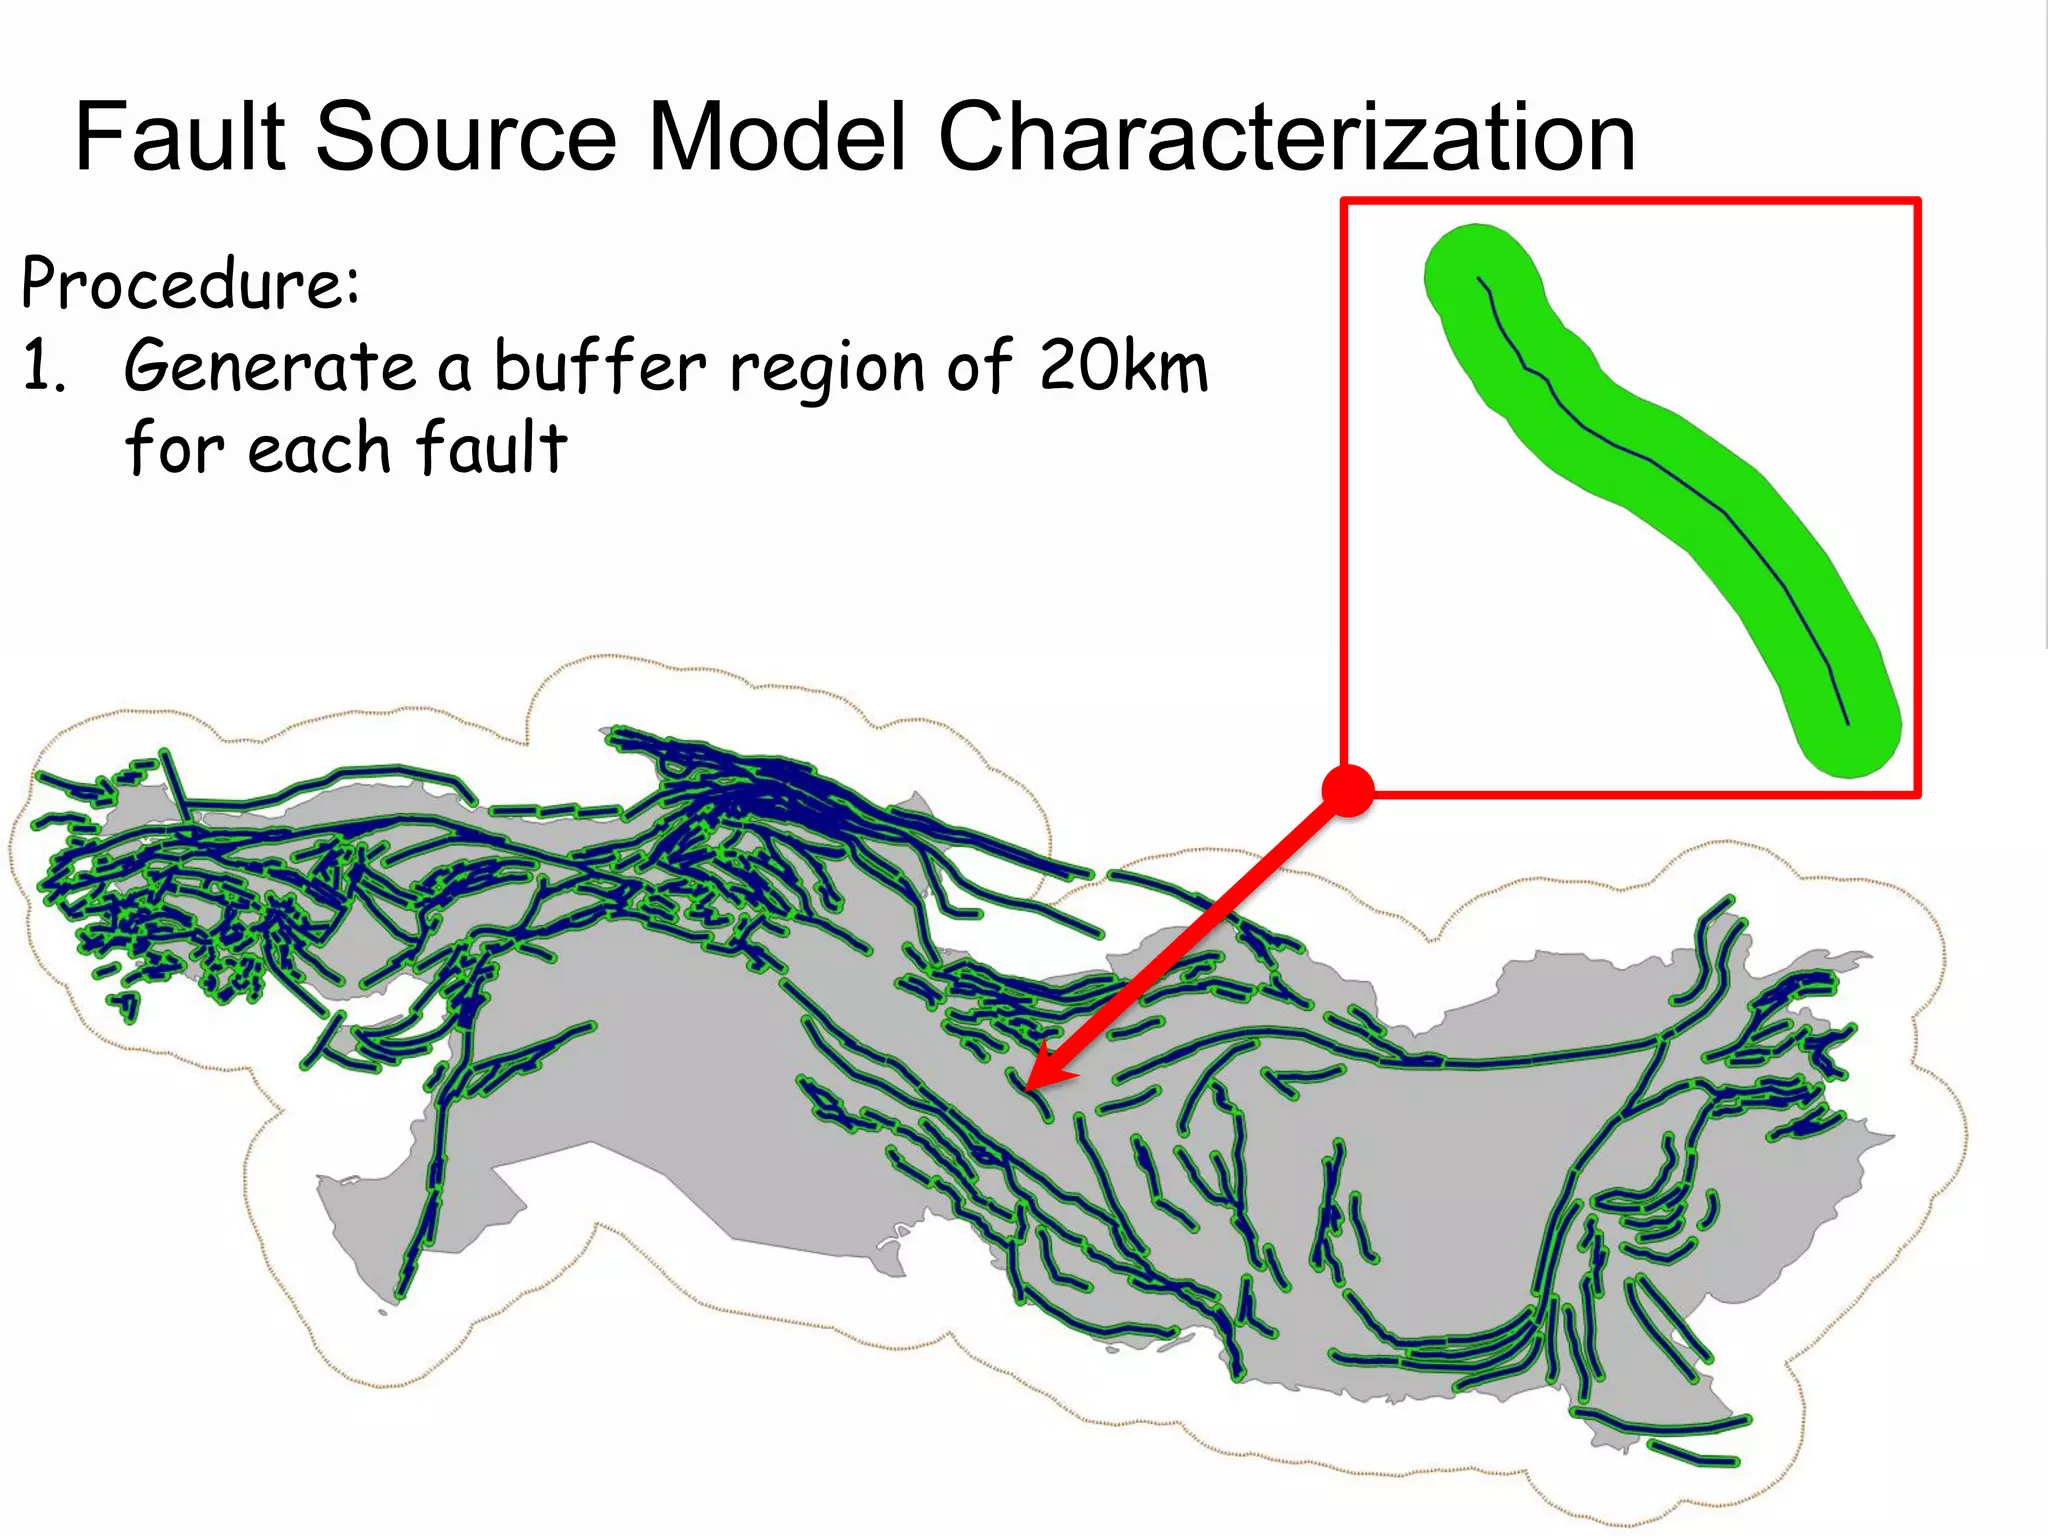
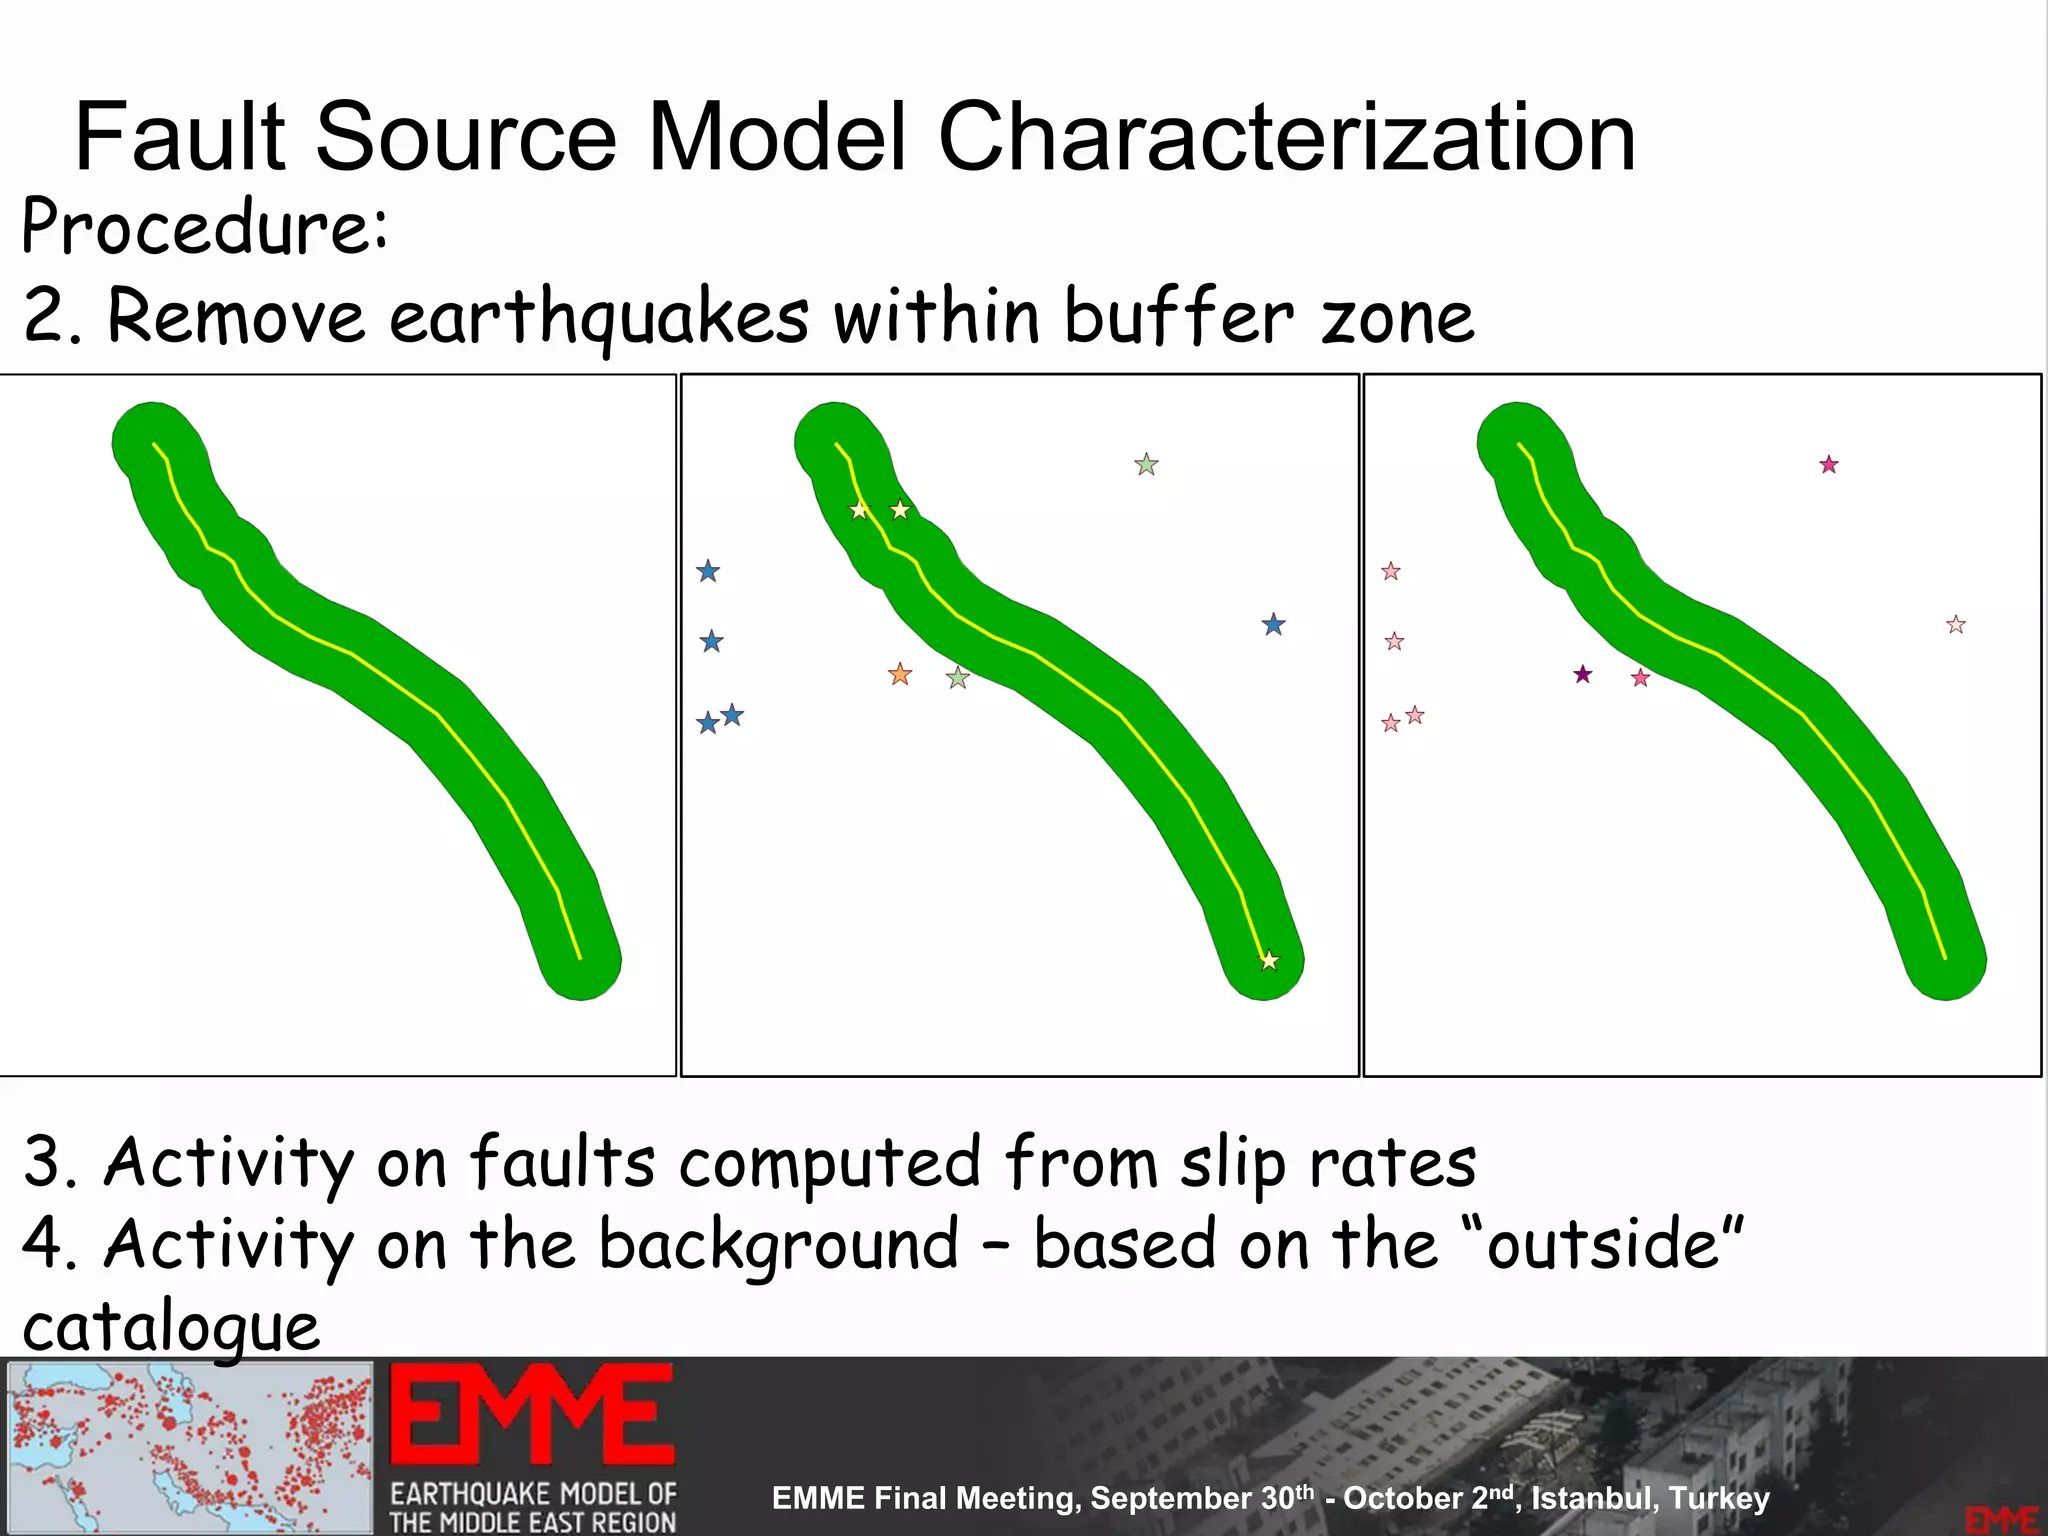
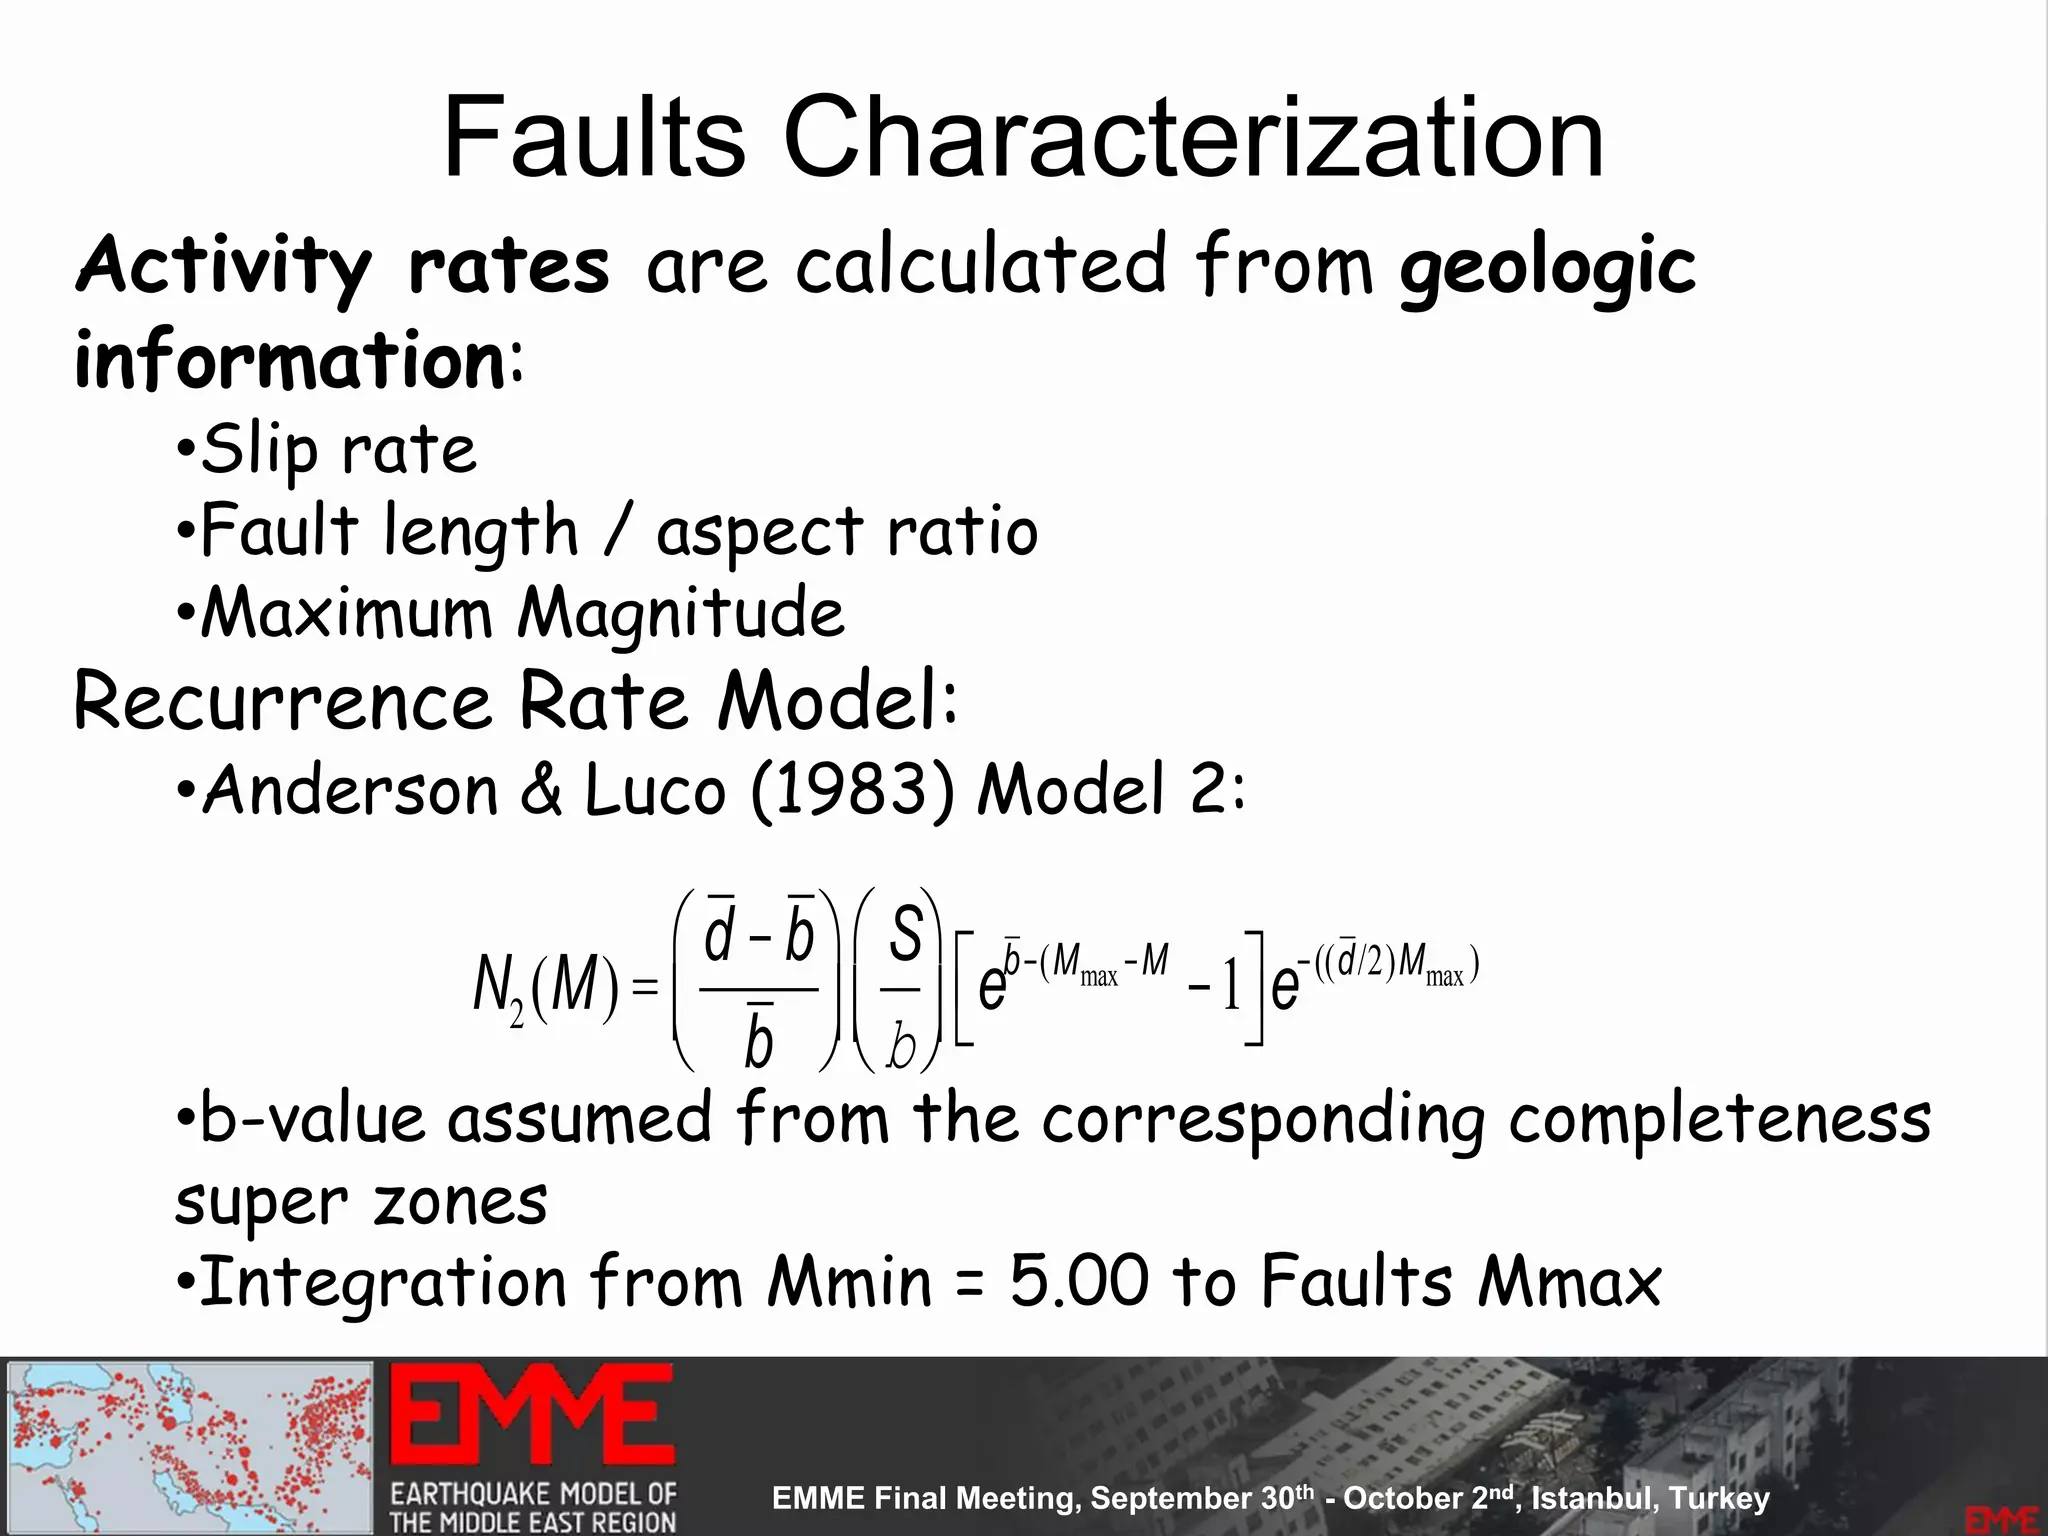
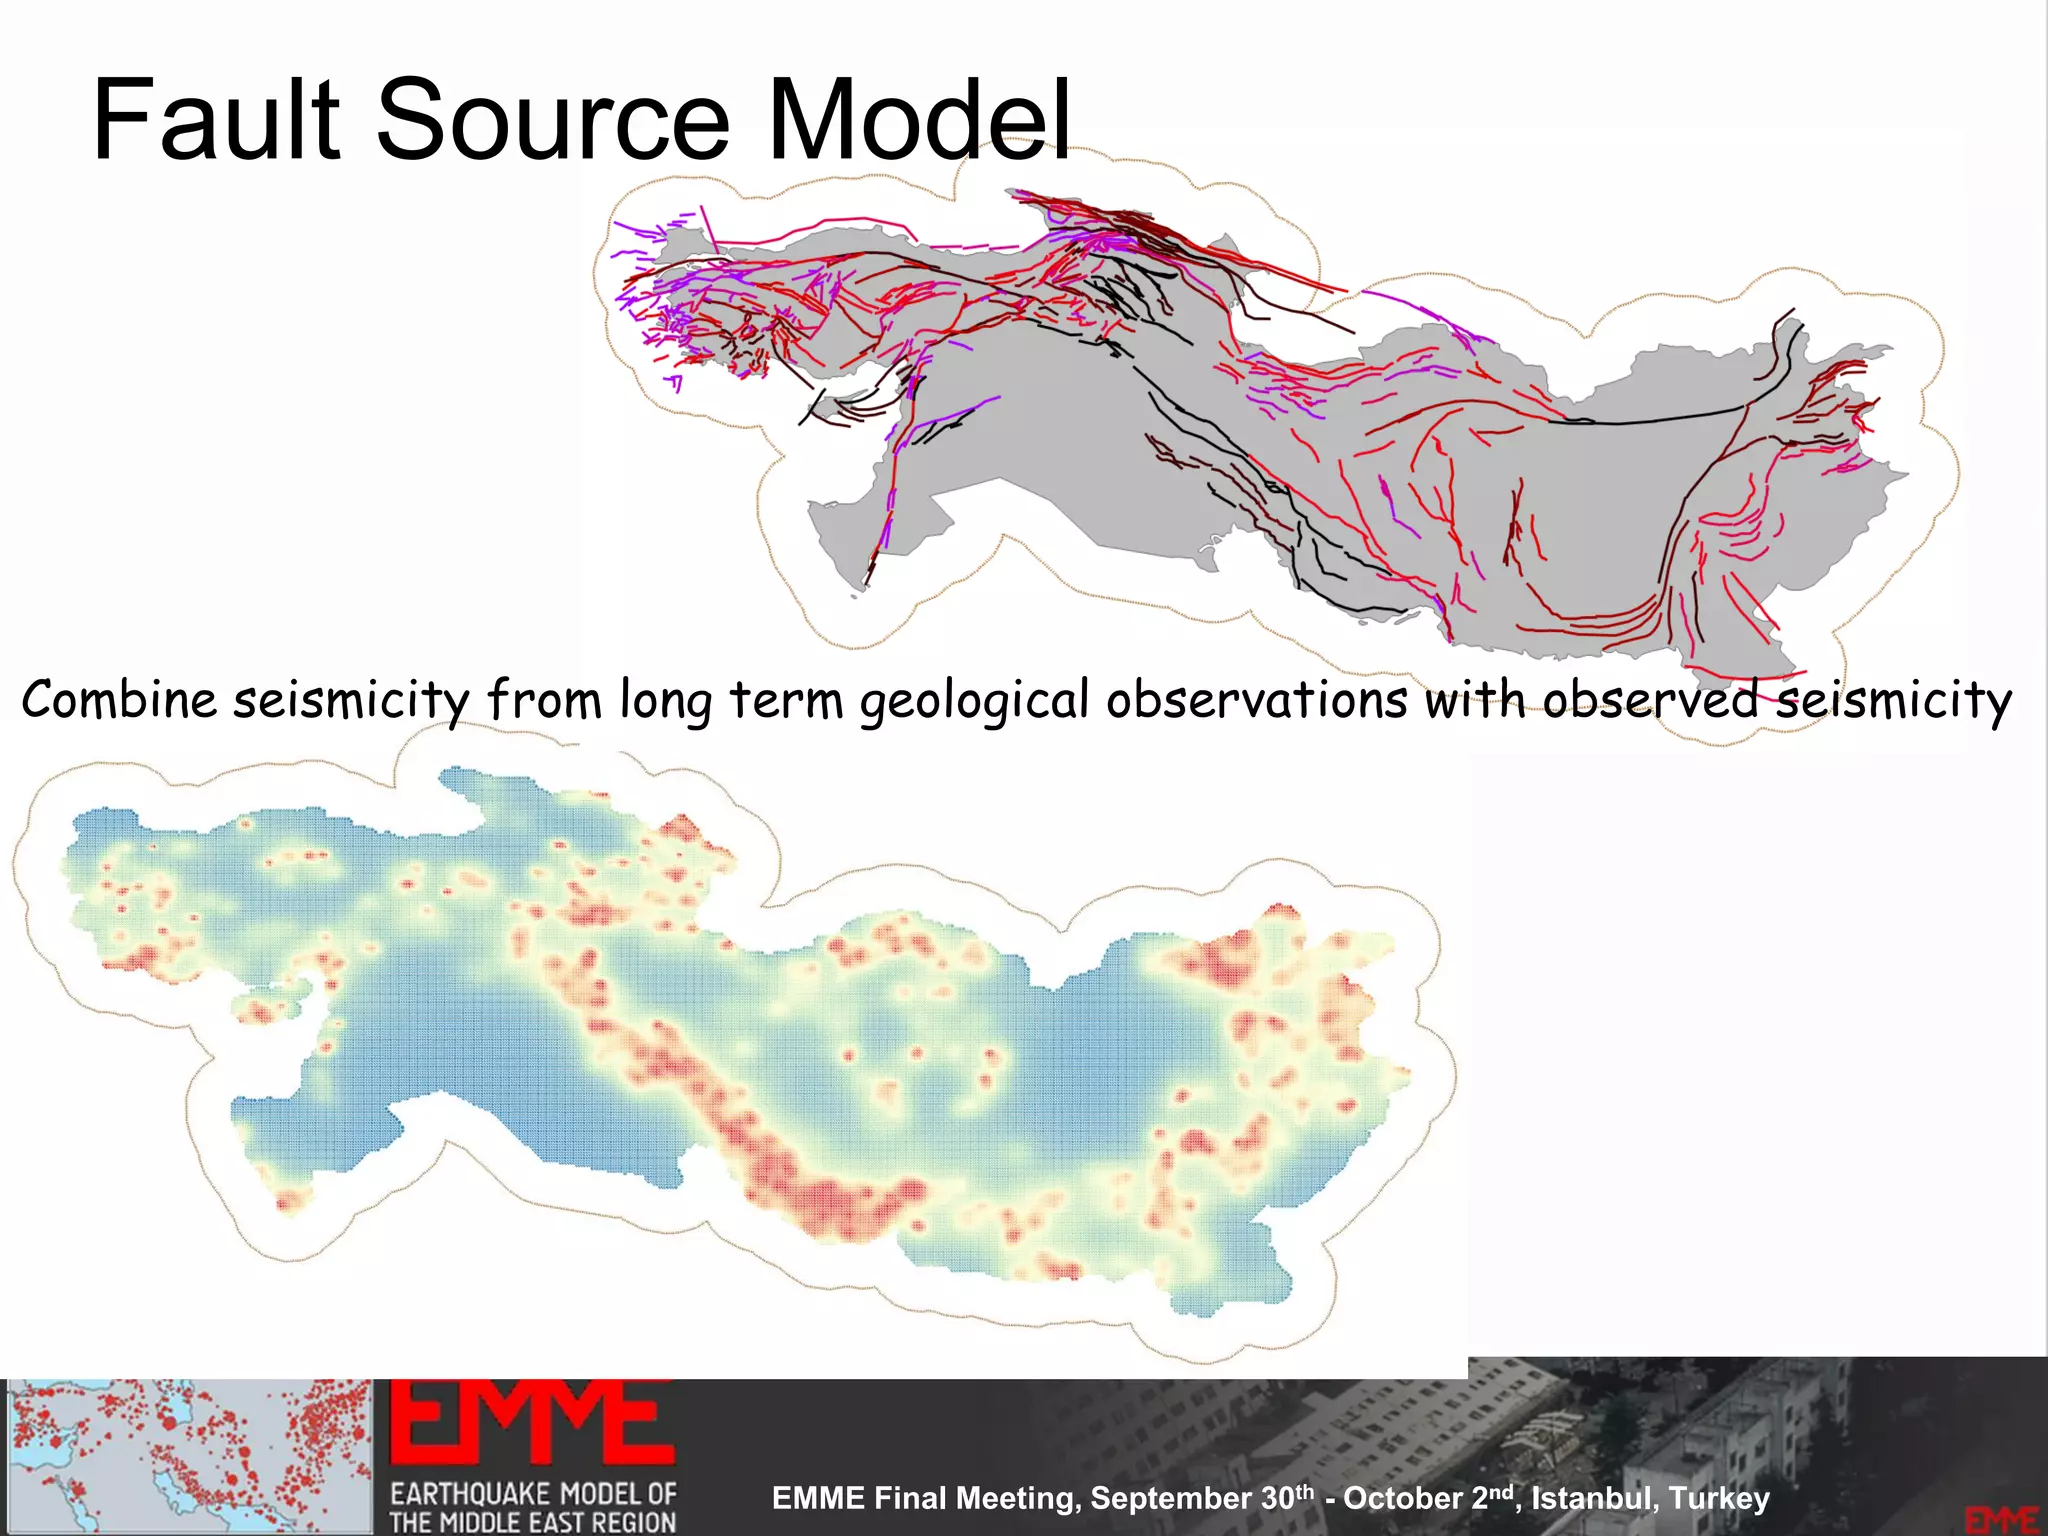
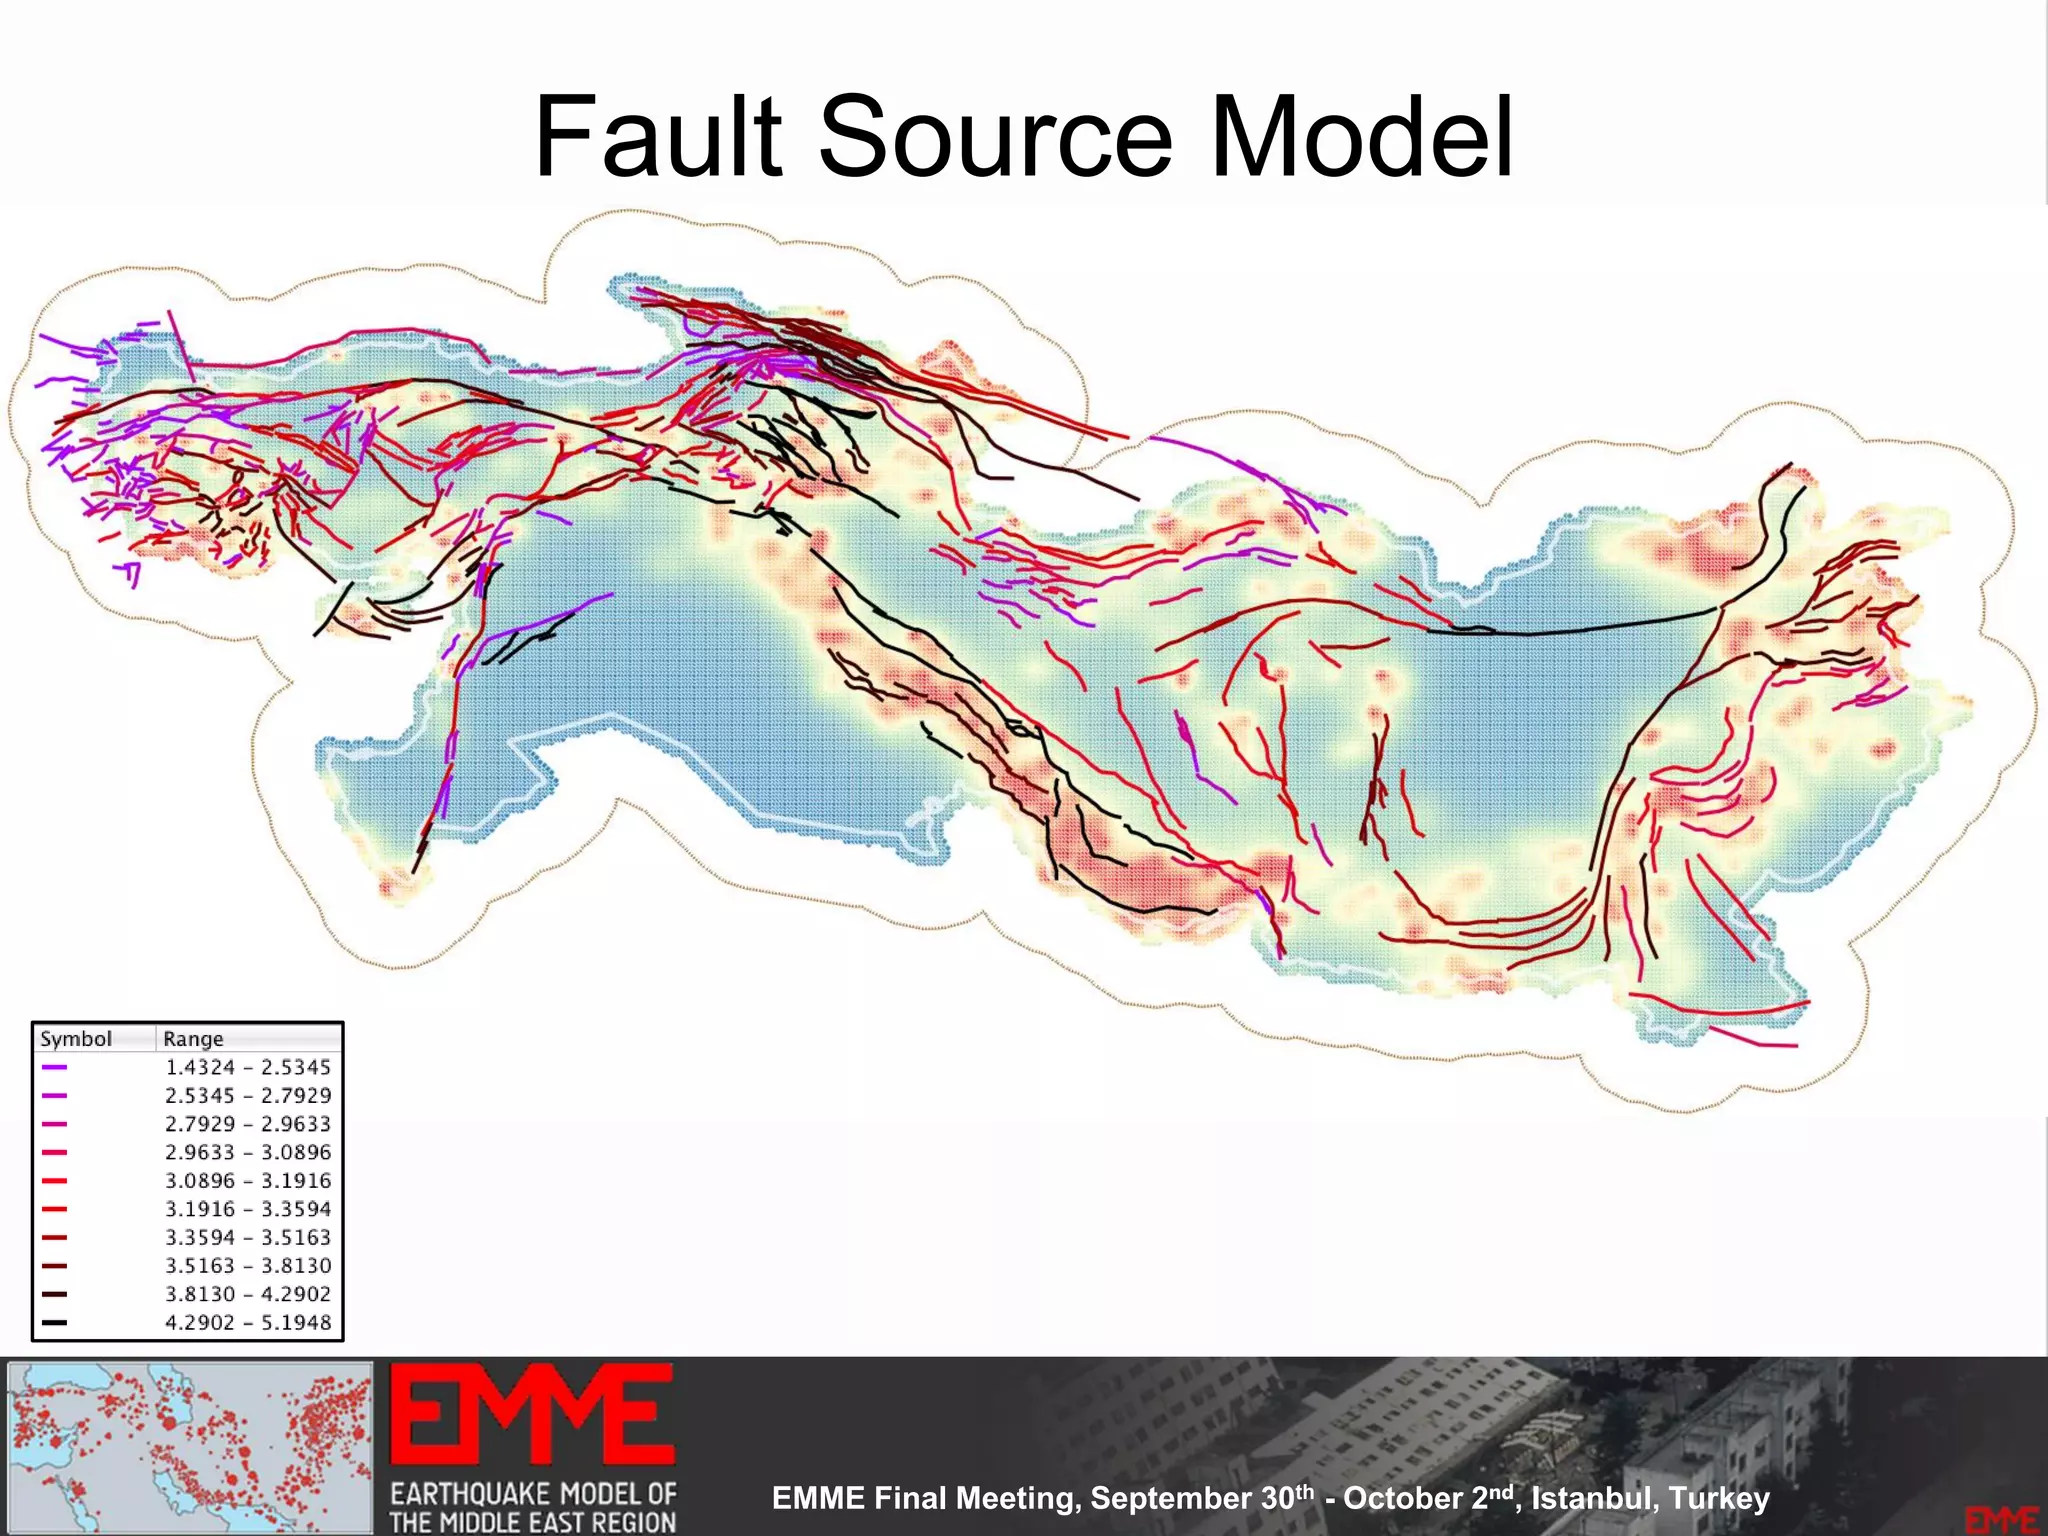
![Fault Sources
• Criteria to select active faults to be used for hazard
assessment:
– Identified active faults [capable of earthquakes]: Northern
Anatolian Faults, Marmara Faults, Zagros Transform Faults
– At least 0.10mm/year (1m in 1000years - Neocene)
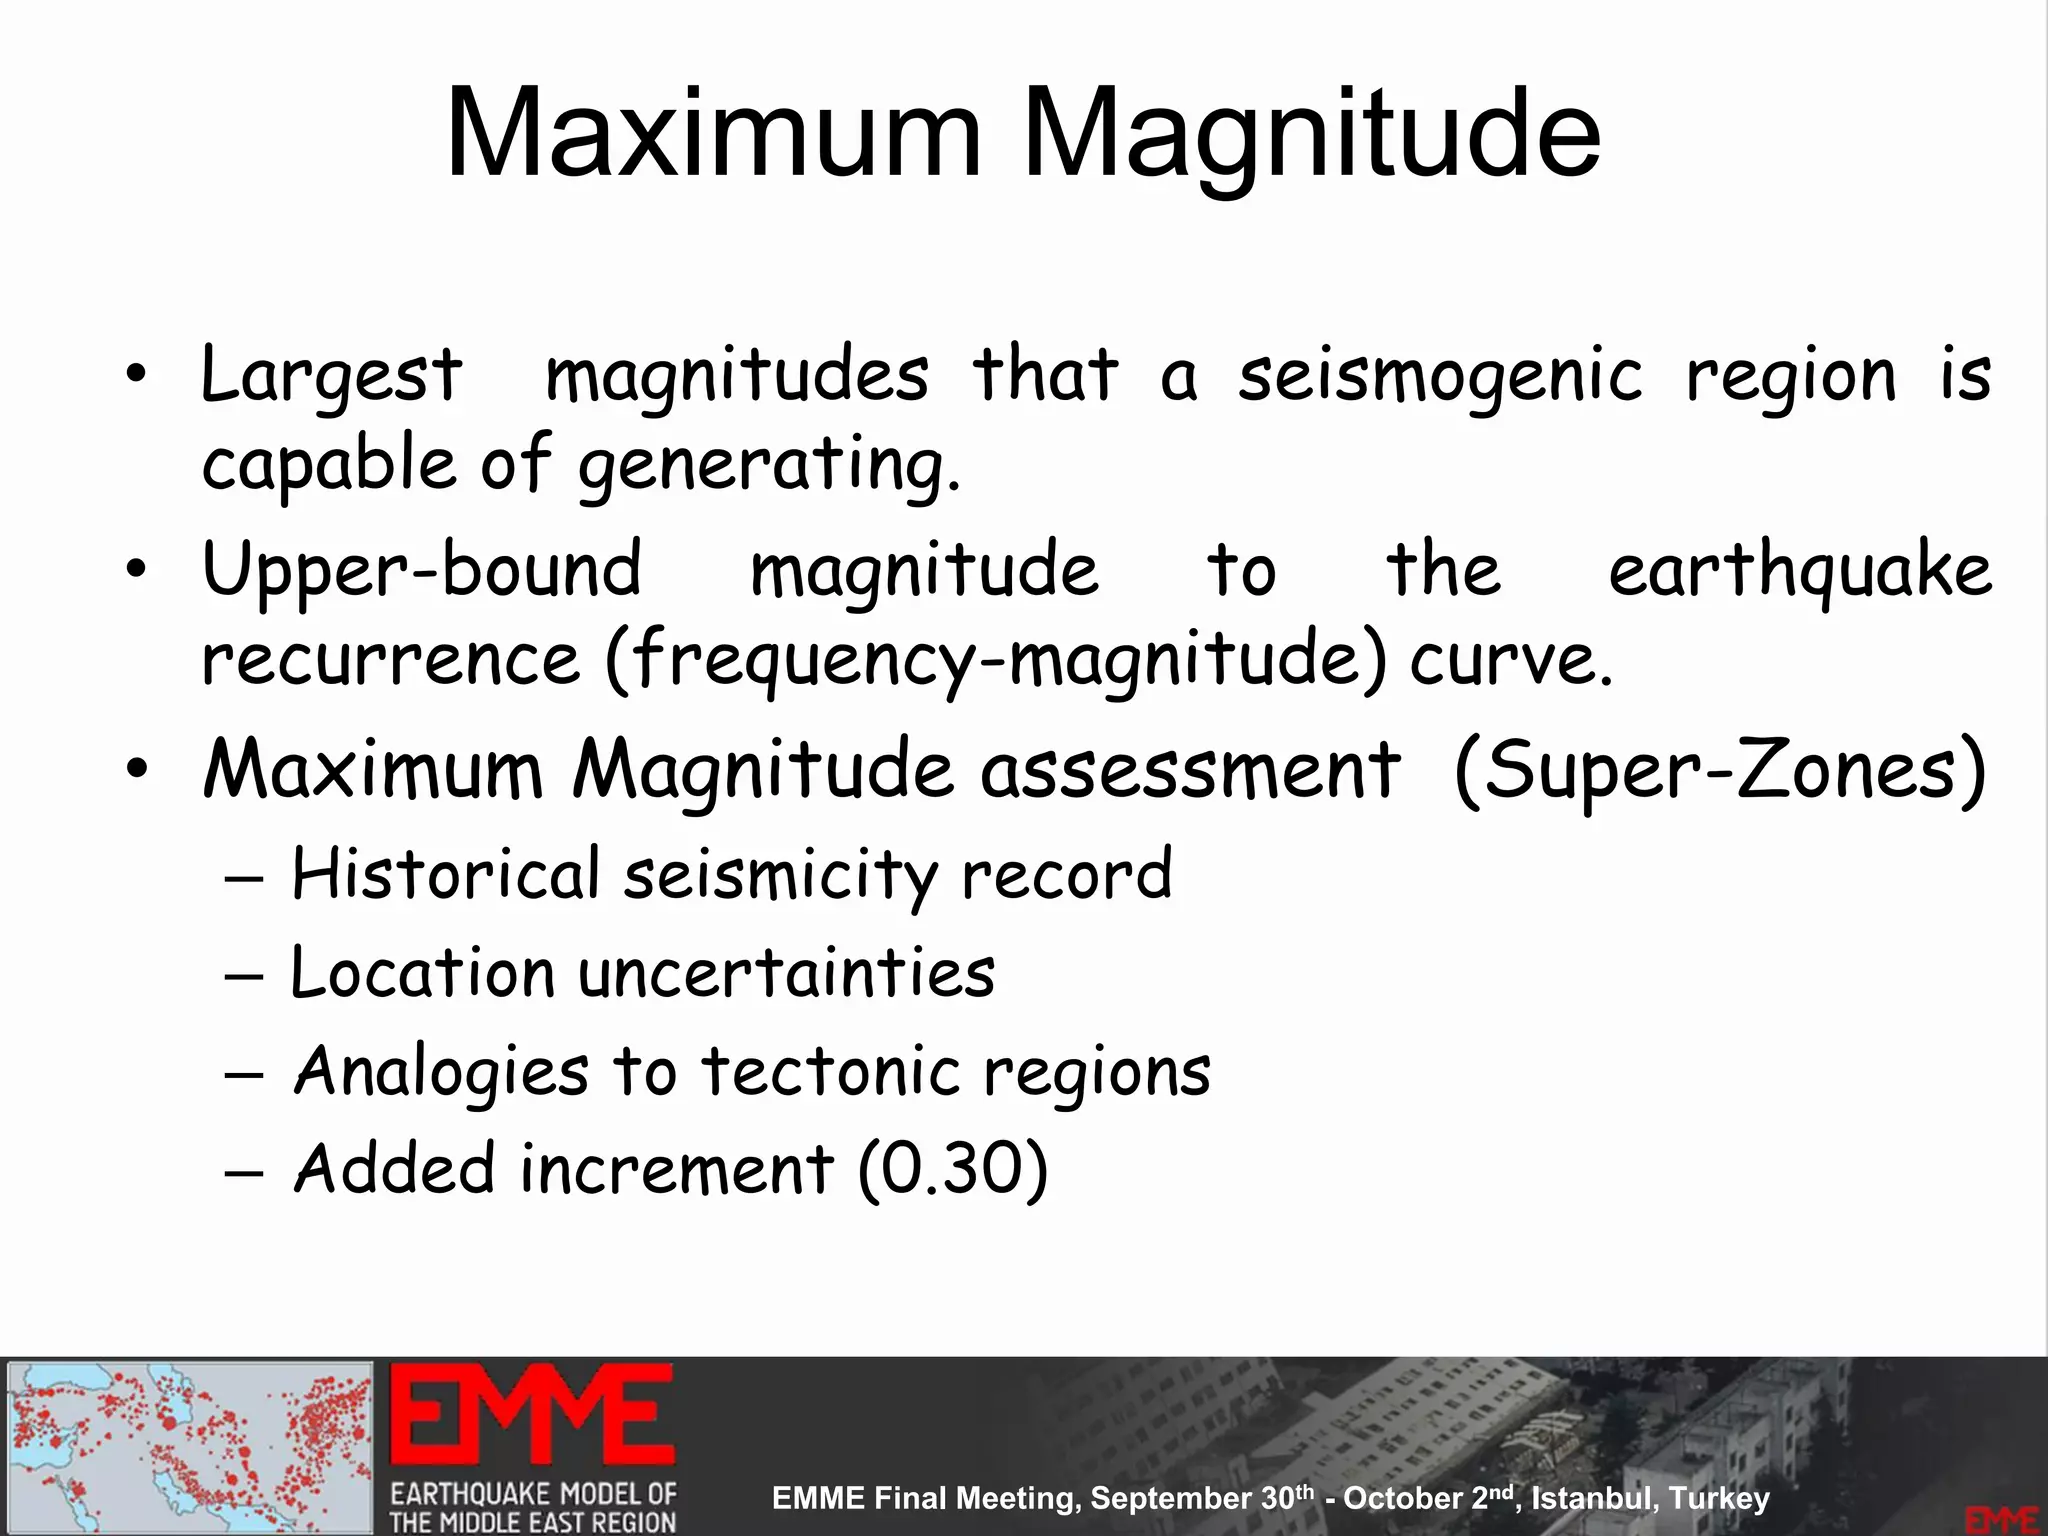
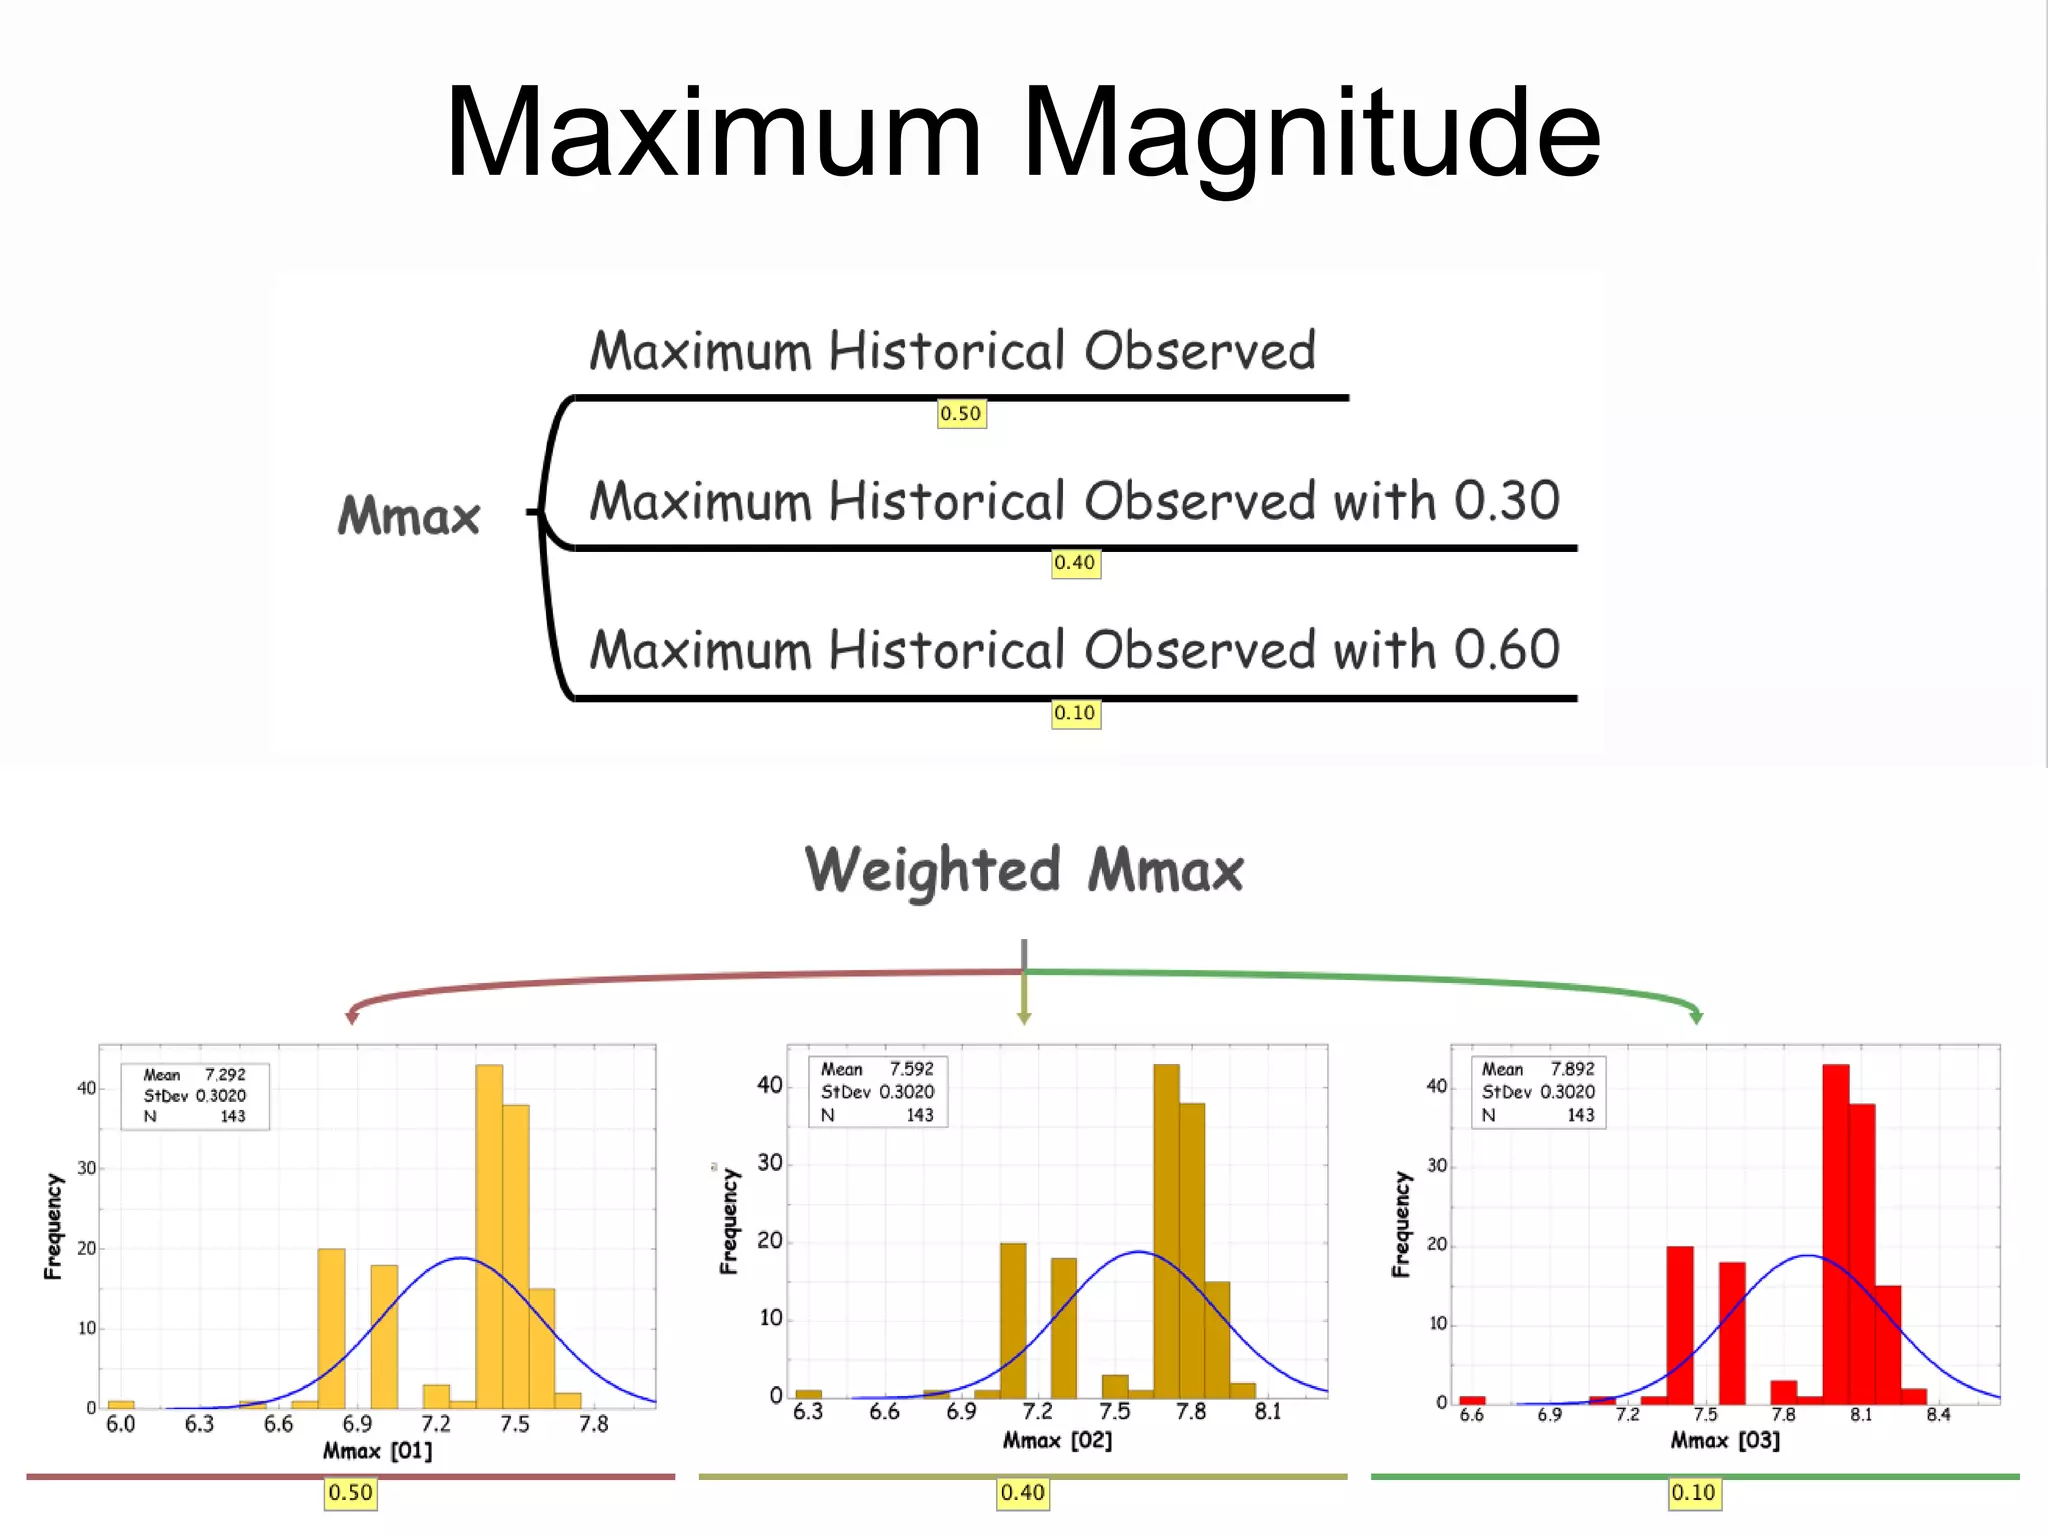
– Maximum magnitude equal to 6.20
– Fully parameterized:
• Geometry
• Slip-rates
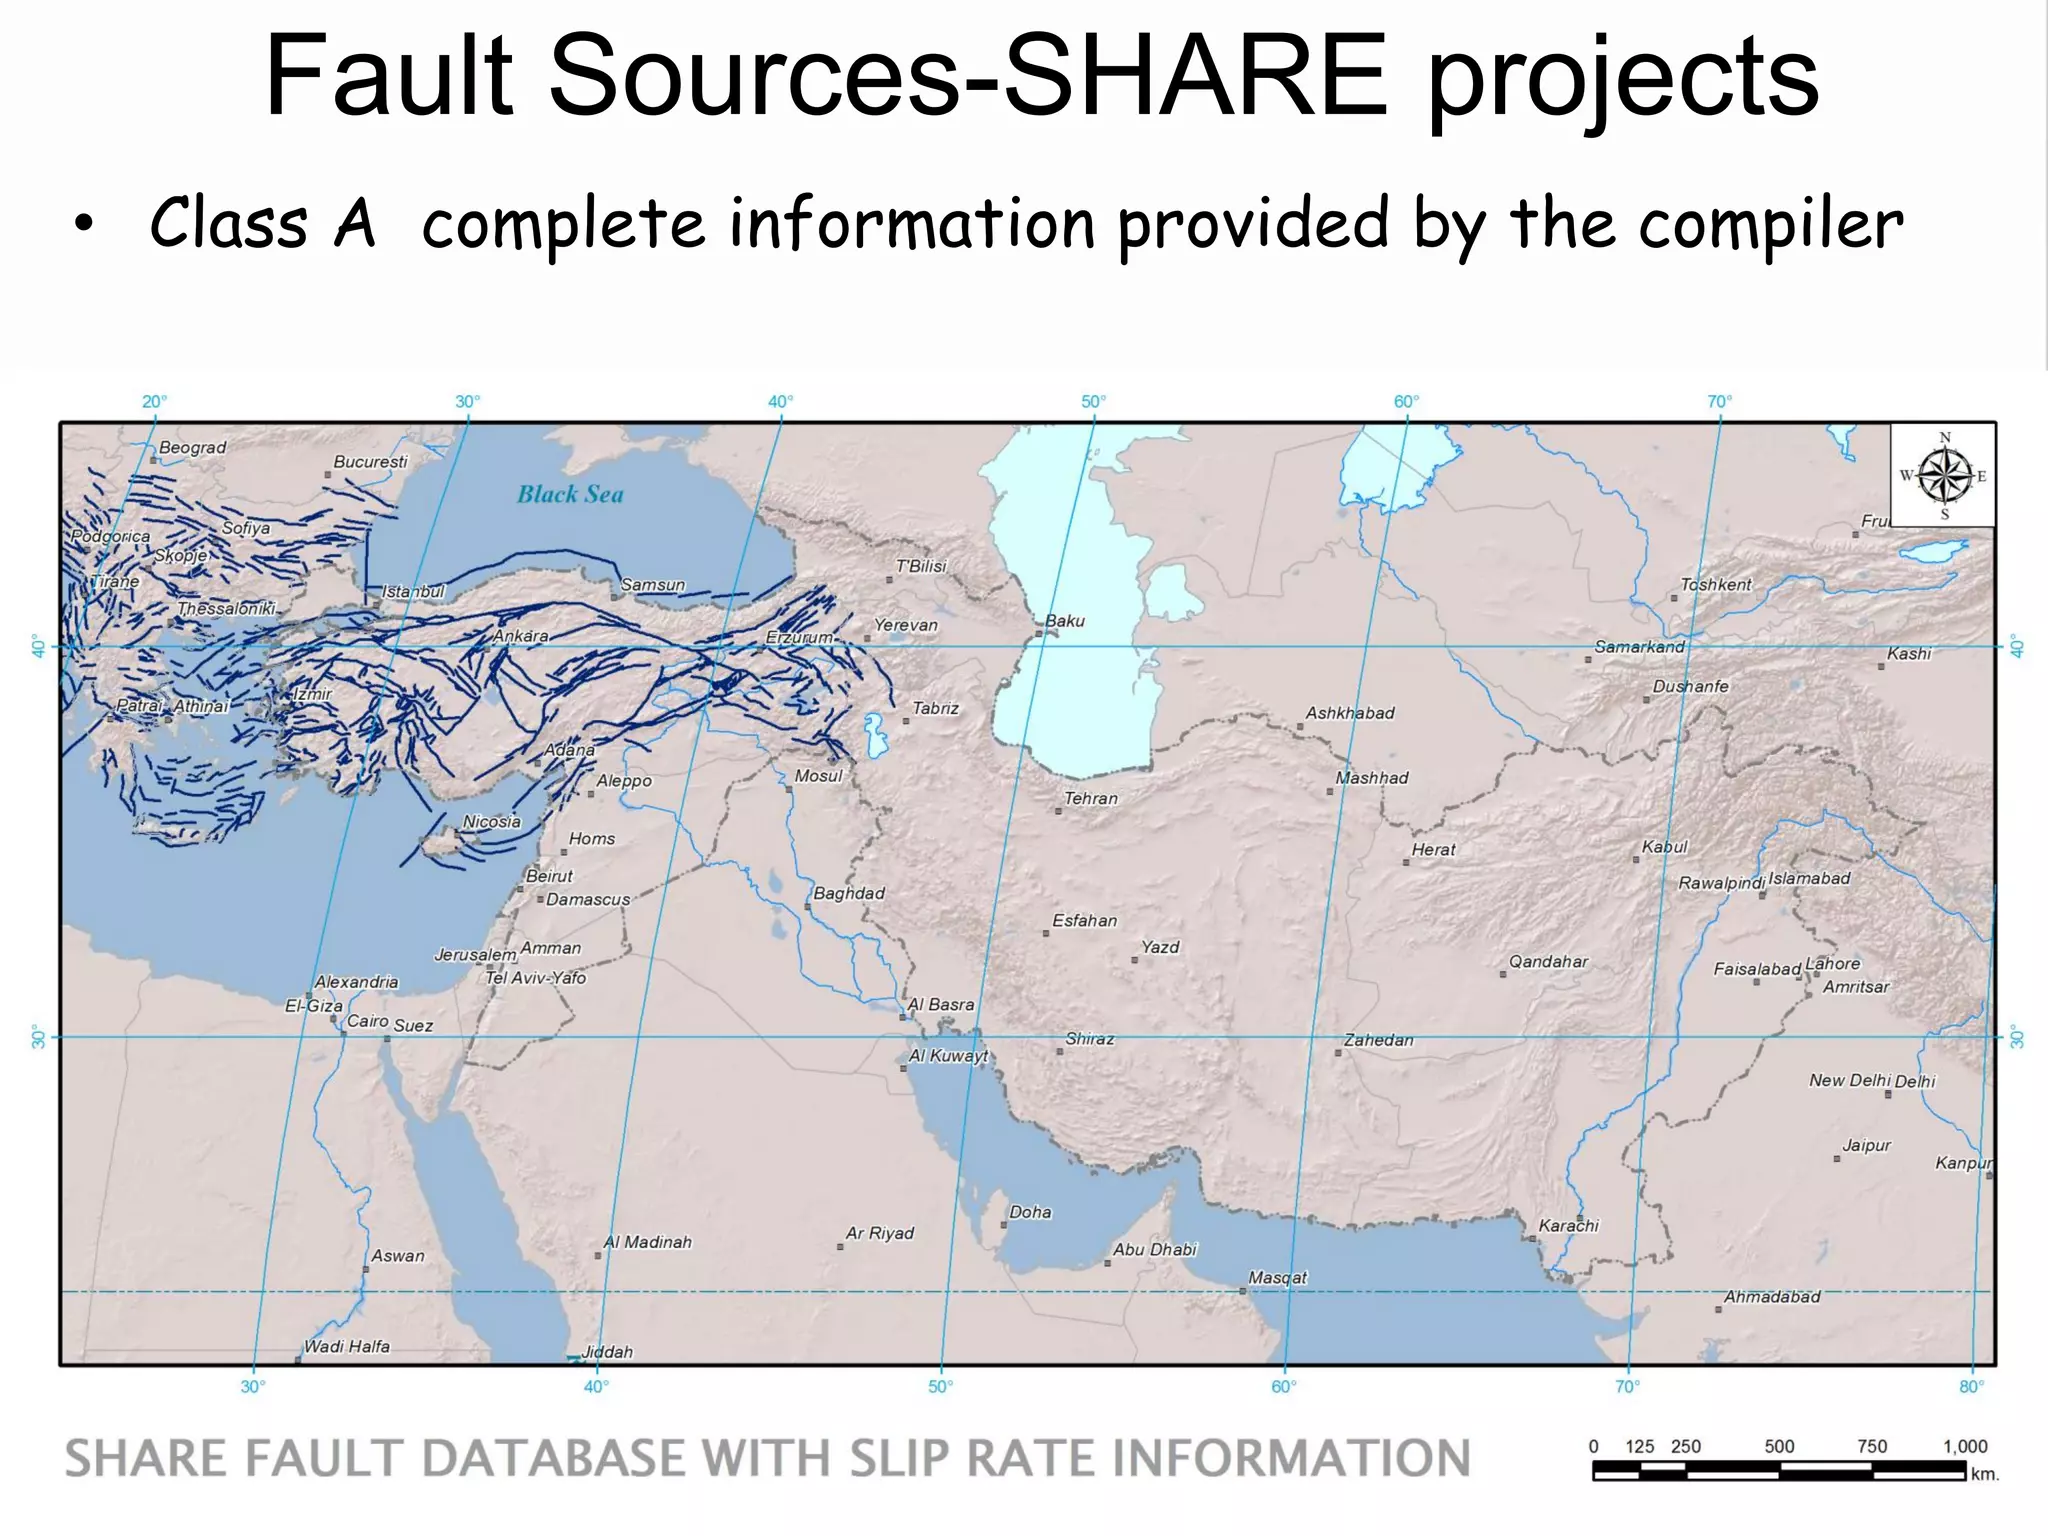
– Confidence Classes:
• Class A: complete information provided by the compiler
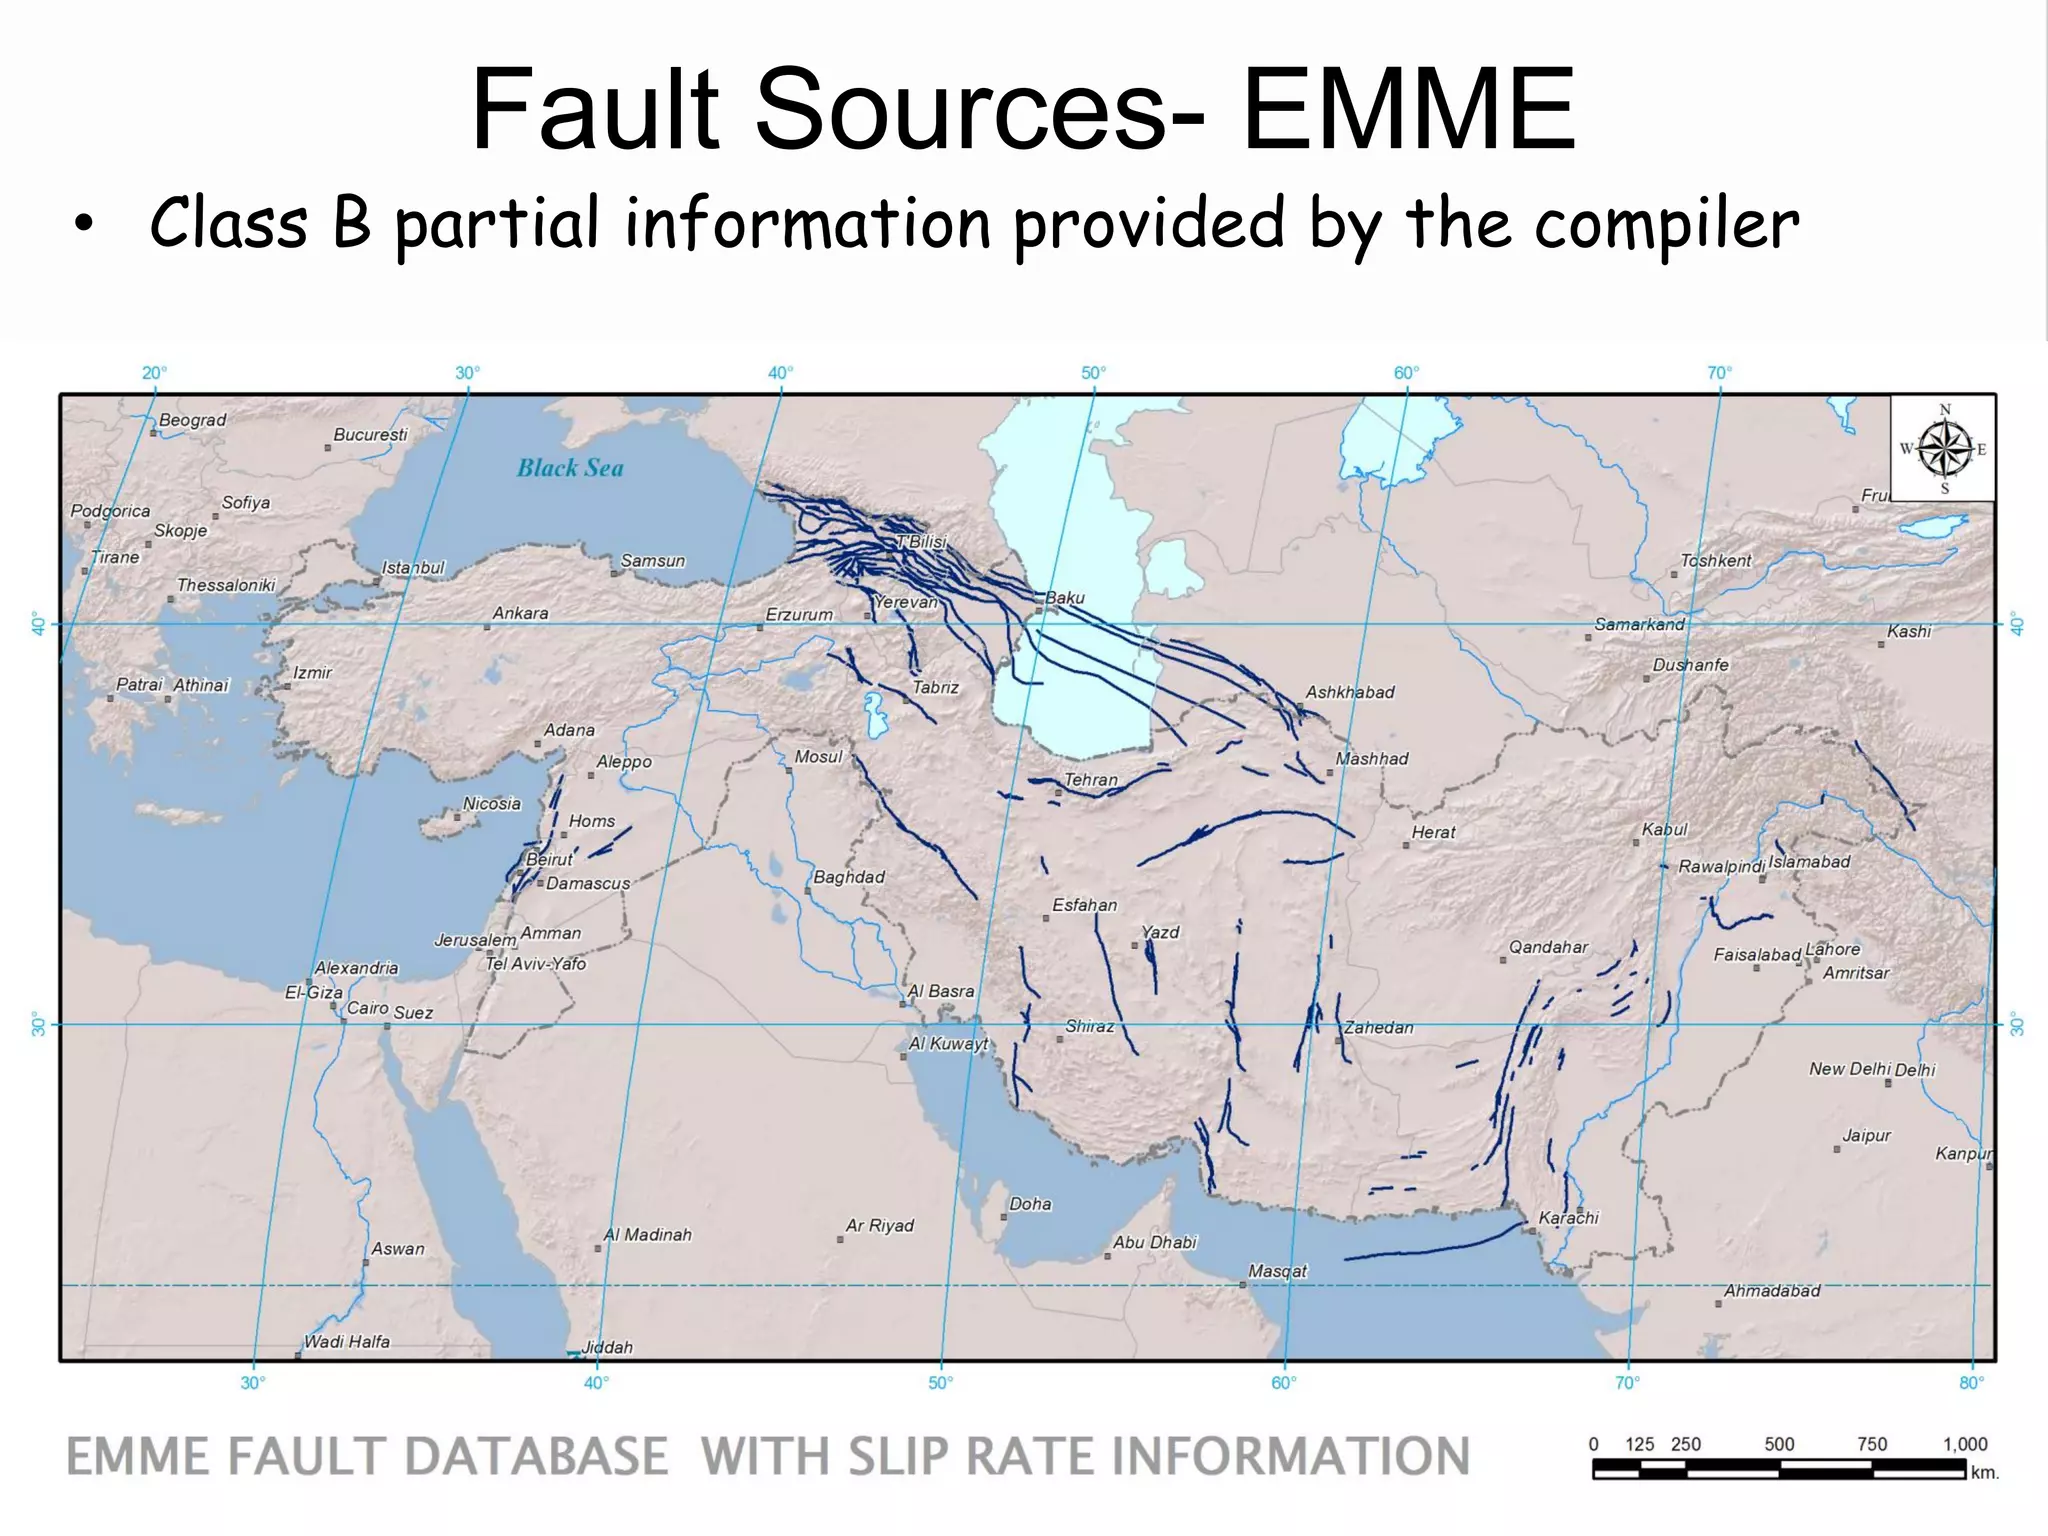
• Class B: partial information provided by compiler
• Class C: limited information provided
• Class D: only top trace available](https://image.slidesharecdn.com/emmesourcemodeldanciuetal201309-130930095907-phpapp01/75/Seismic-Hazard-Model-for-the-Middle-East-Region-Laurentiu-Danciu-Swiss-Seismological-Service-ETH-Zurich-Switzerland-GEM-Hazard-Modeler-Karin-Sesetyan-Mine-Demircioglu-Kandilli-Observatory-and-Earthquake-Research-Institute-Istanbul-Turkey-48-2048.jpg)
![Source Parameterization
• Depth Distribution
• Focal Mechanisms
– Rake Angle values (Aki’s definition)
– Percentage weights
• Ruptures Orientation: Strike and Dip Angles
• Rupture Properties
– Upper and Lower Seismogenic Depth
Point Source
[Single Rupture]
Simple Fault• Fault Top Trace
• Focal Mechanisms
– Rake Angle values (Aki’s definition)
• Ruptures Orientation: Strike and Dip Angles
• Rupture Properties
– Upper and Lower Seismogenic Depth](https://image.slidesharecdn.com/emmesourcemodeldanciuetal201309-130930095907-phpapp01/75/Seismic-Hazard-Model-for-the-Middle-East-Region-Laurentiu-Danciu-Swiss-Seismological-Service-ETH-Zurich-Switzerland-GEM-Hazard-Modeler-Karin-Sesetyan-Mine-Demircioglu-Kandilli-Observatory-and-Earthquake-Research-Institute-Istanbul-Turkey-68-2048.jpg)
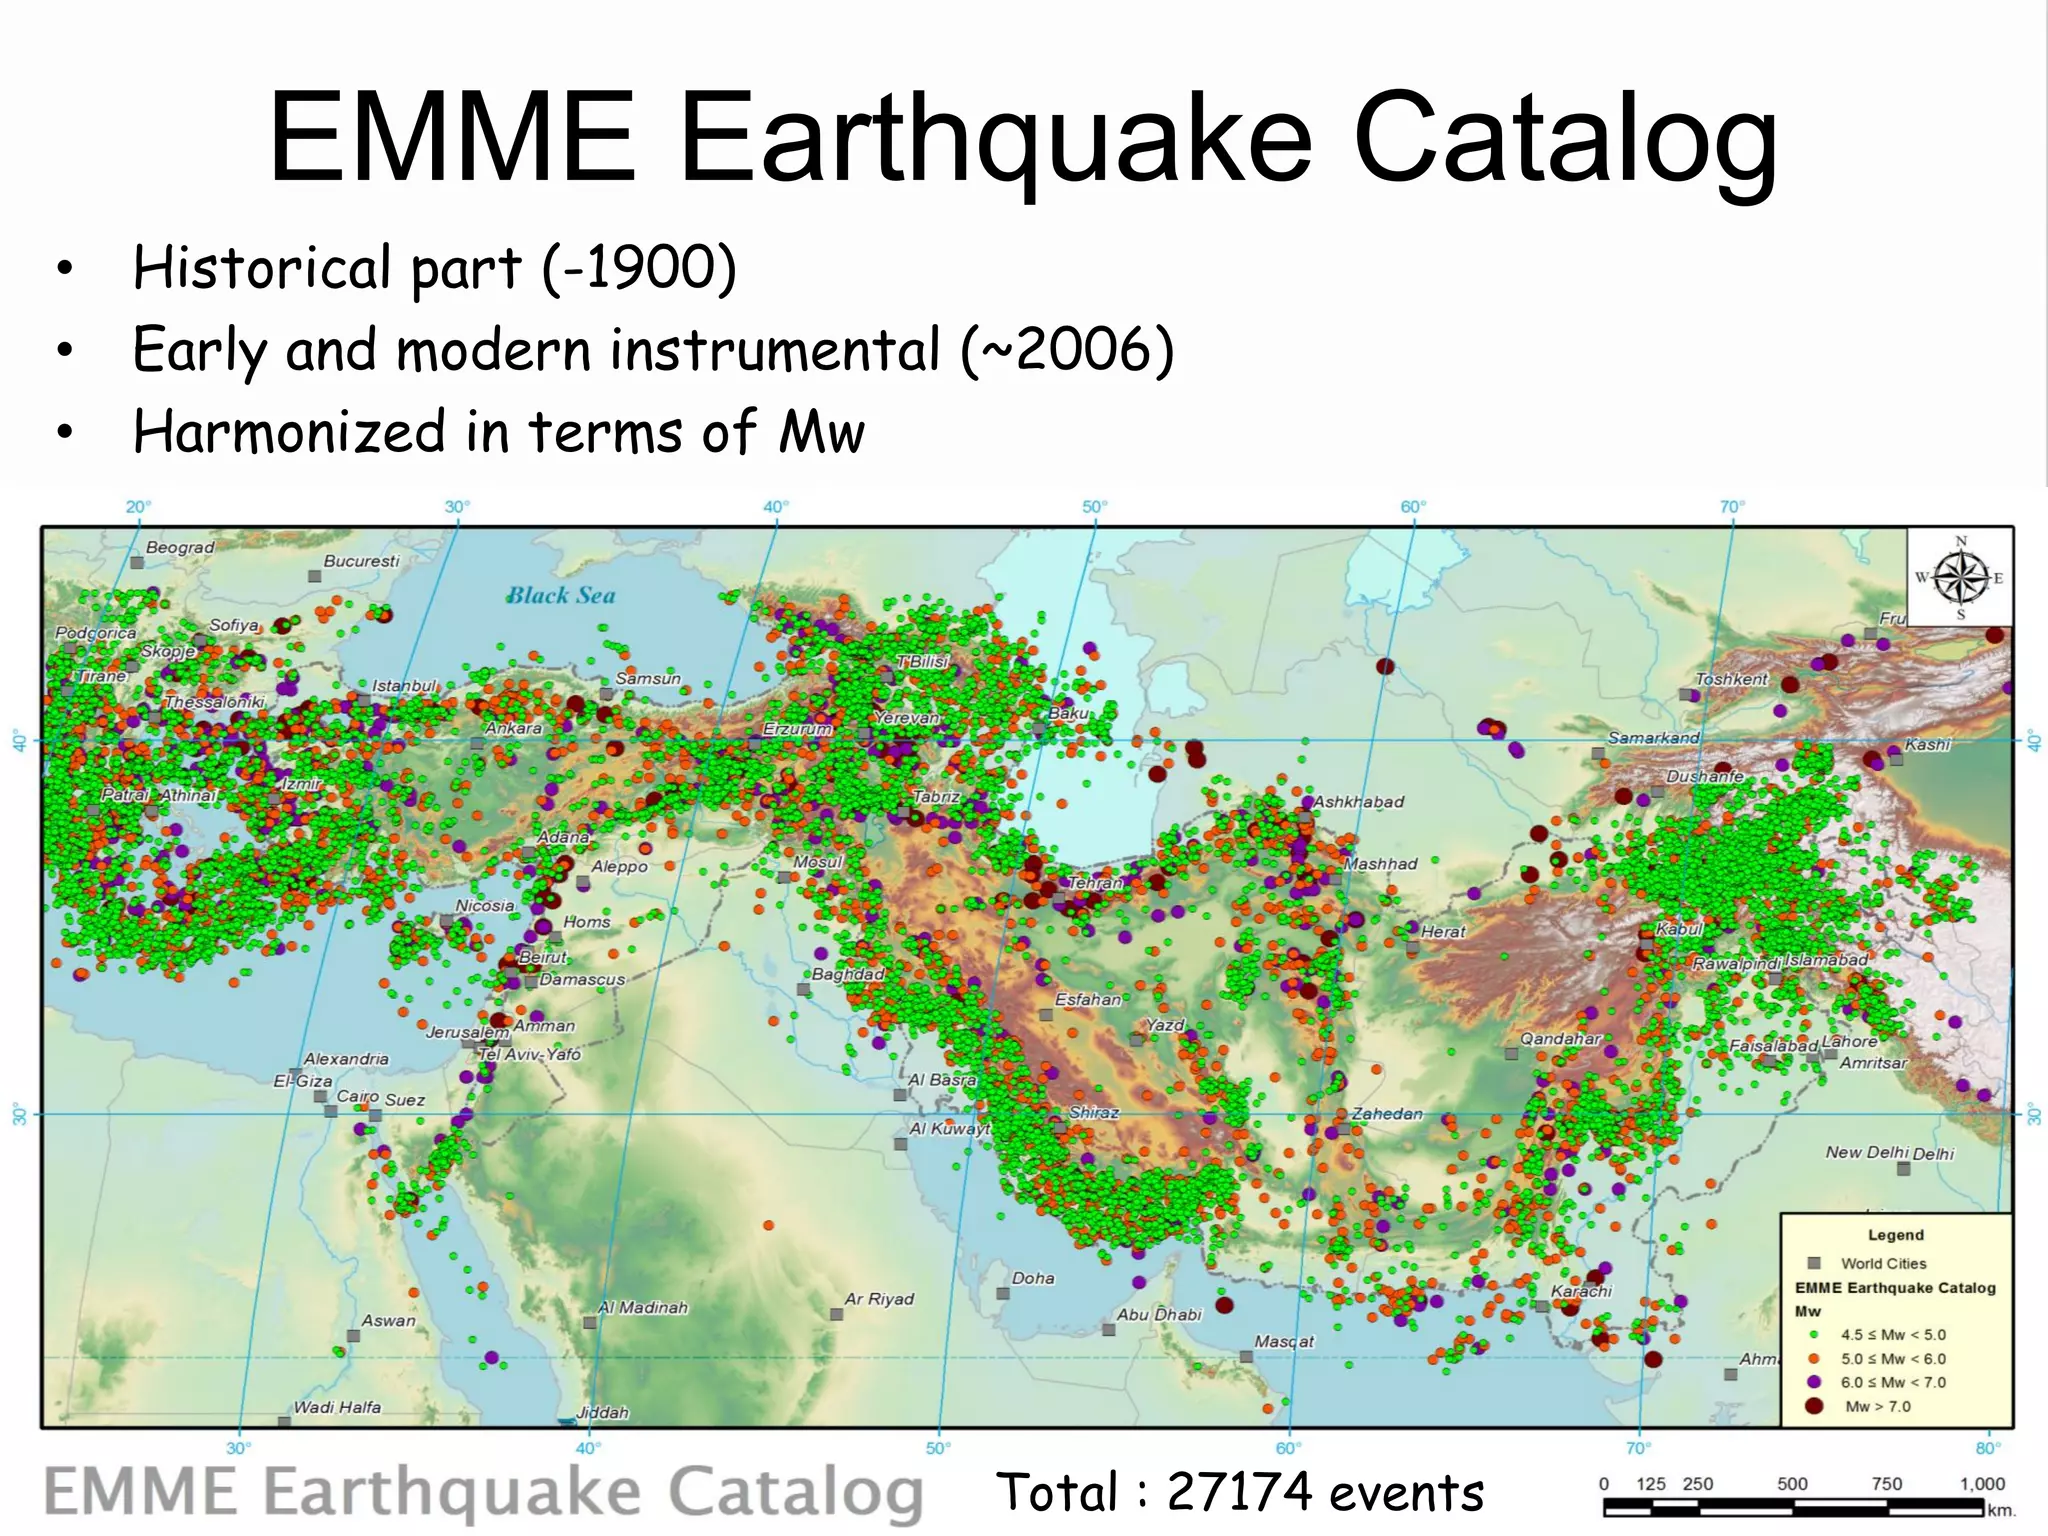
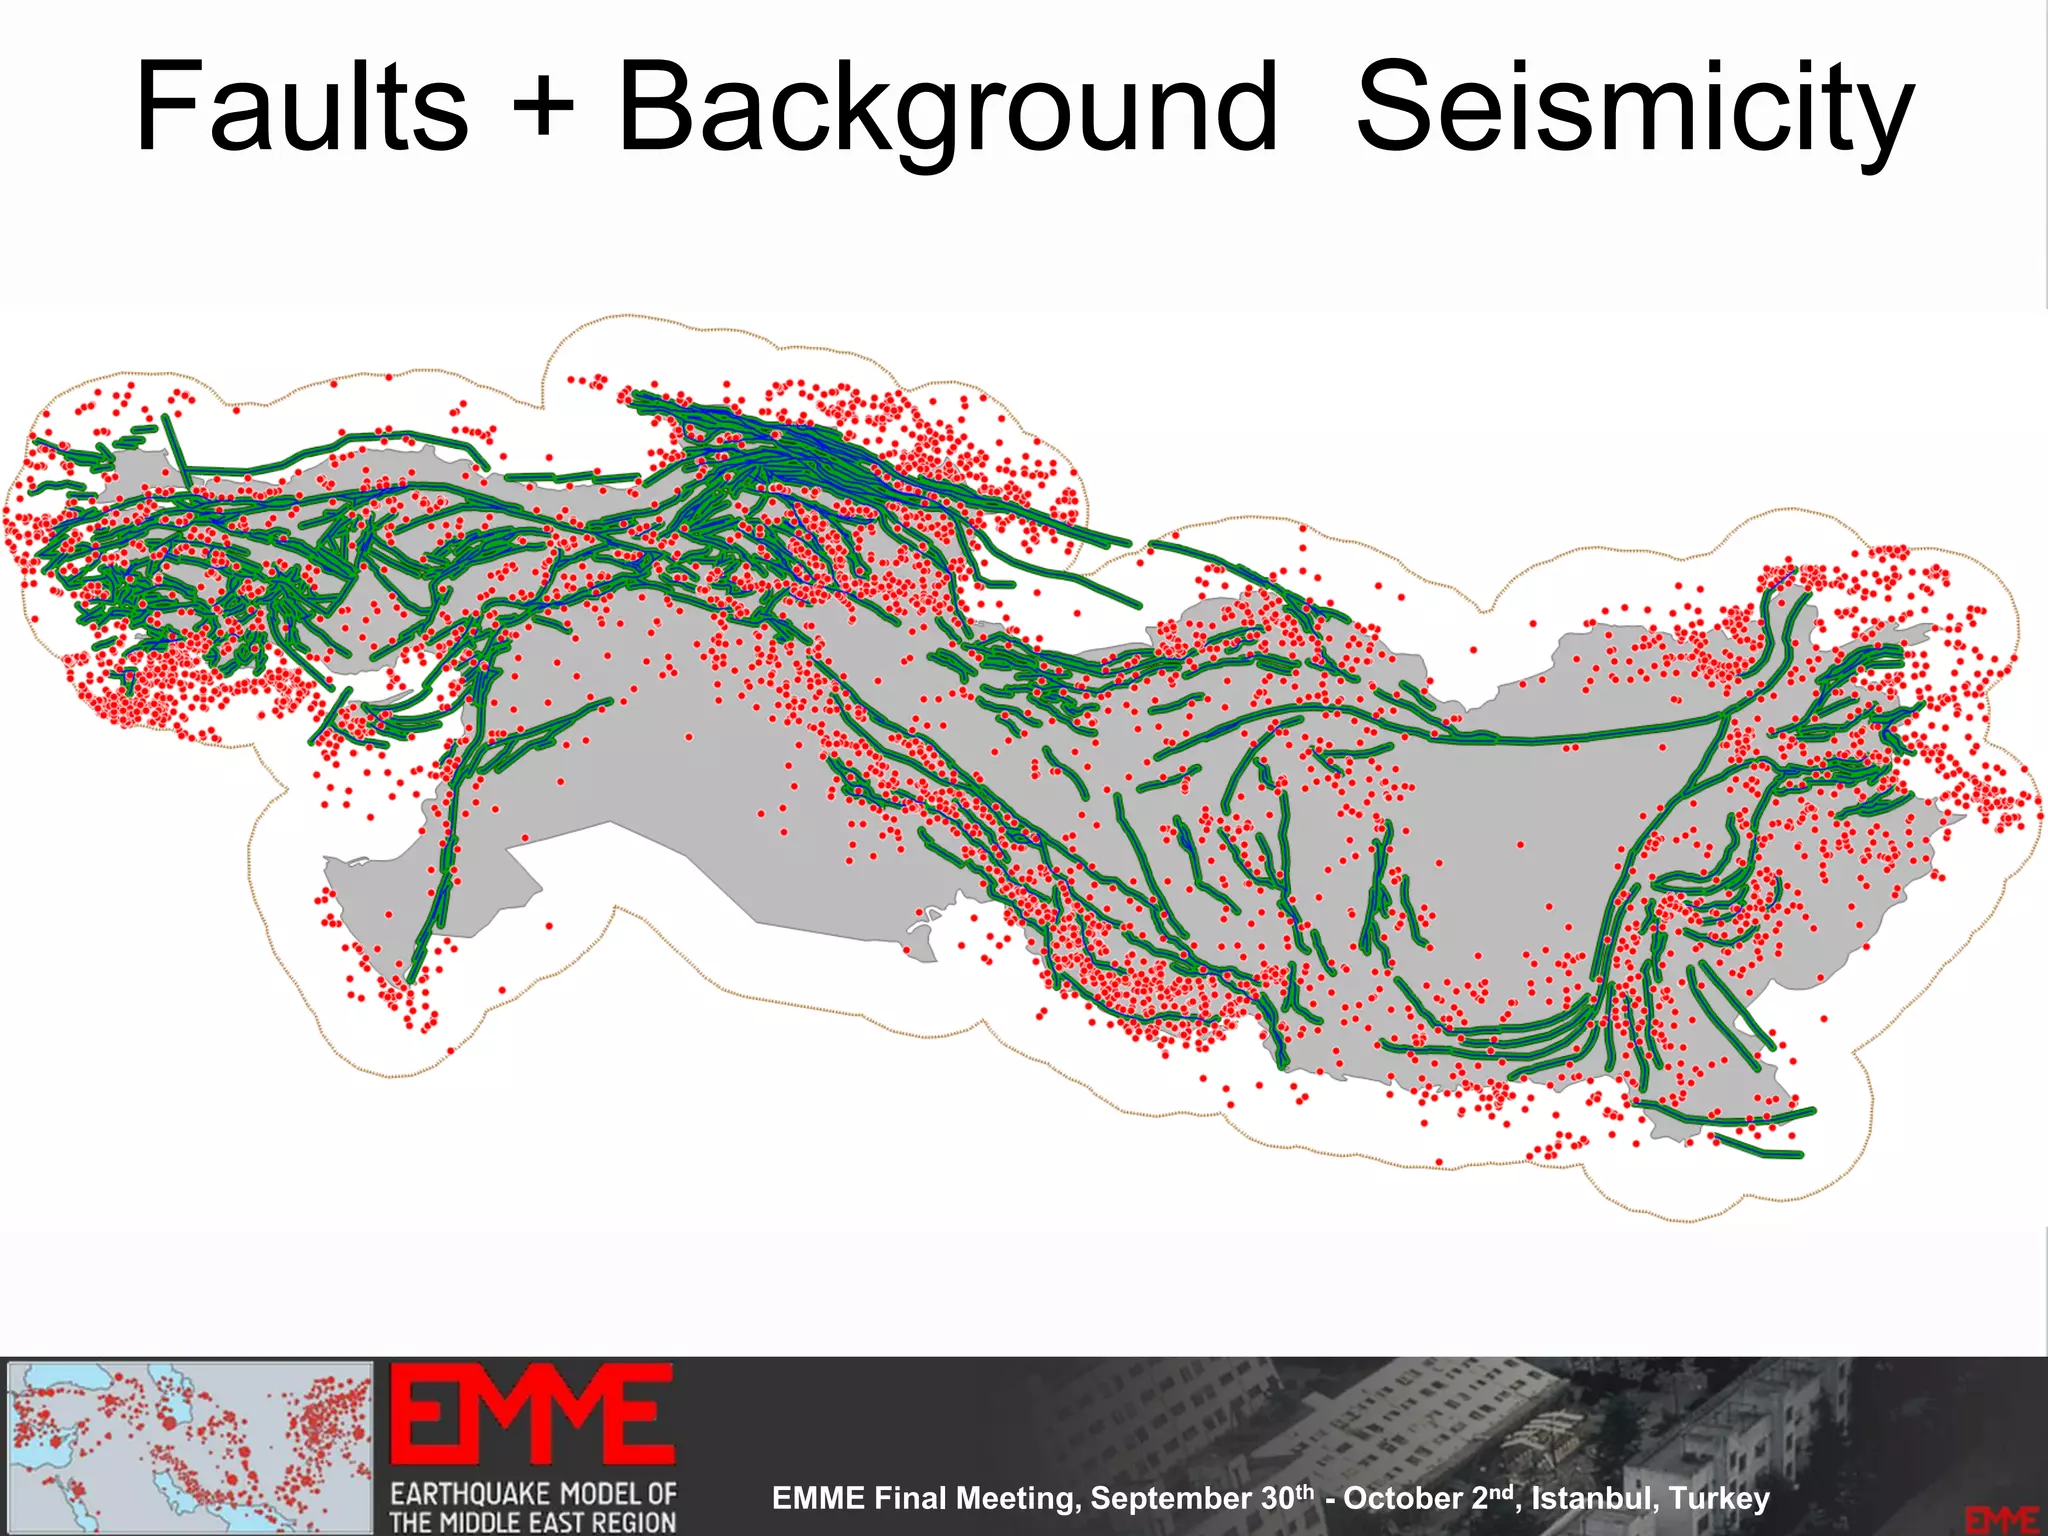
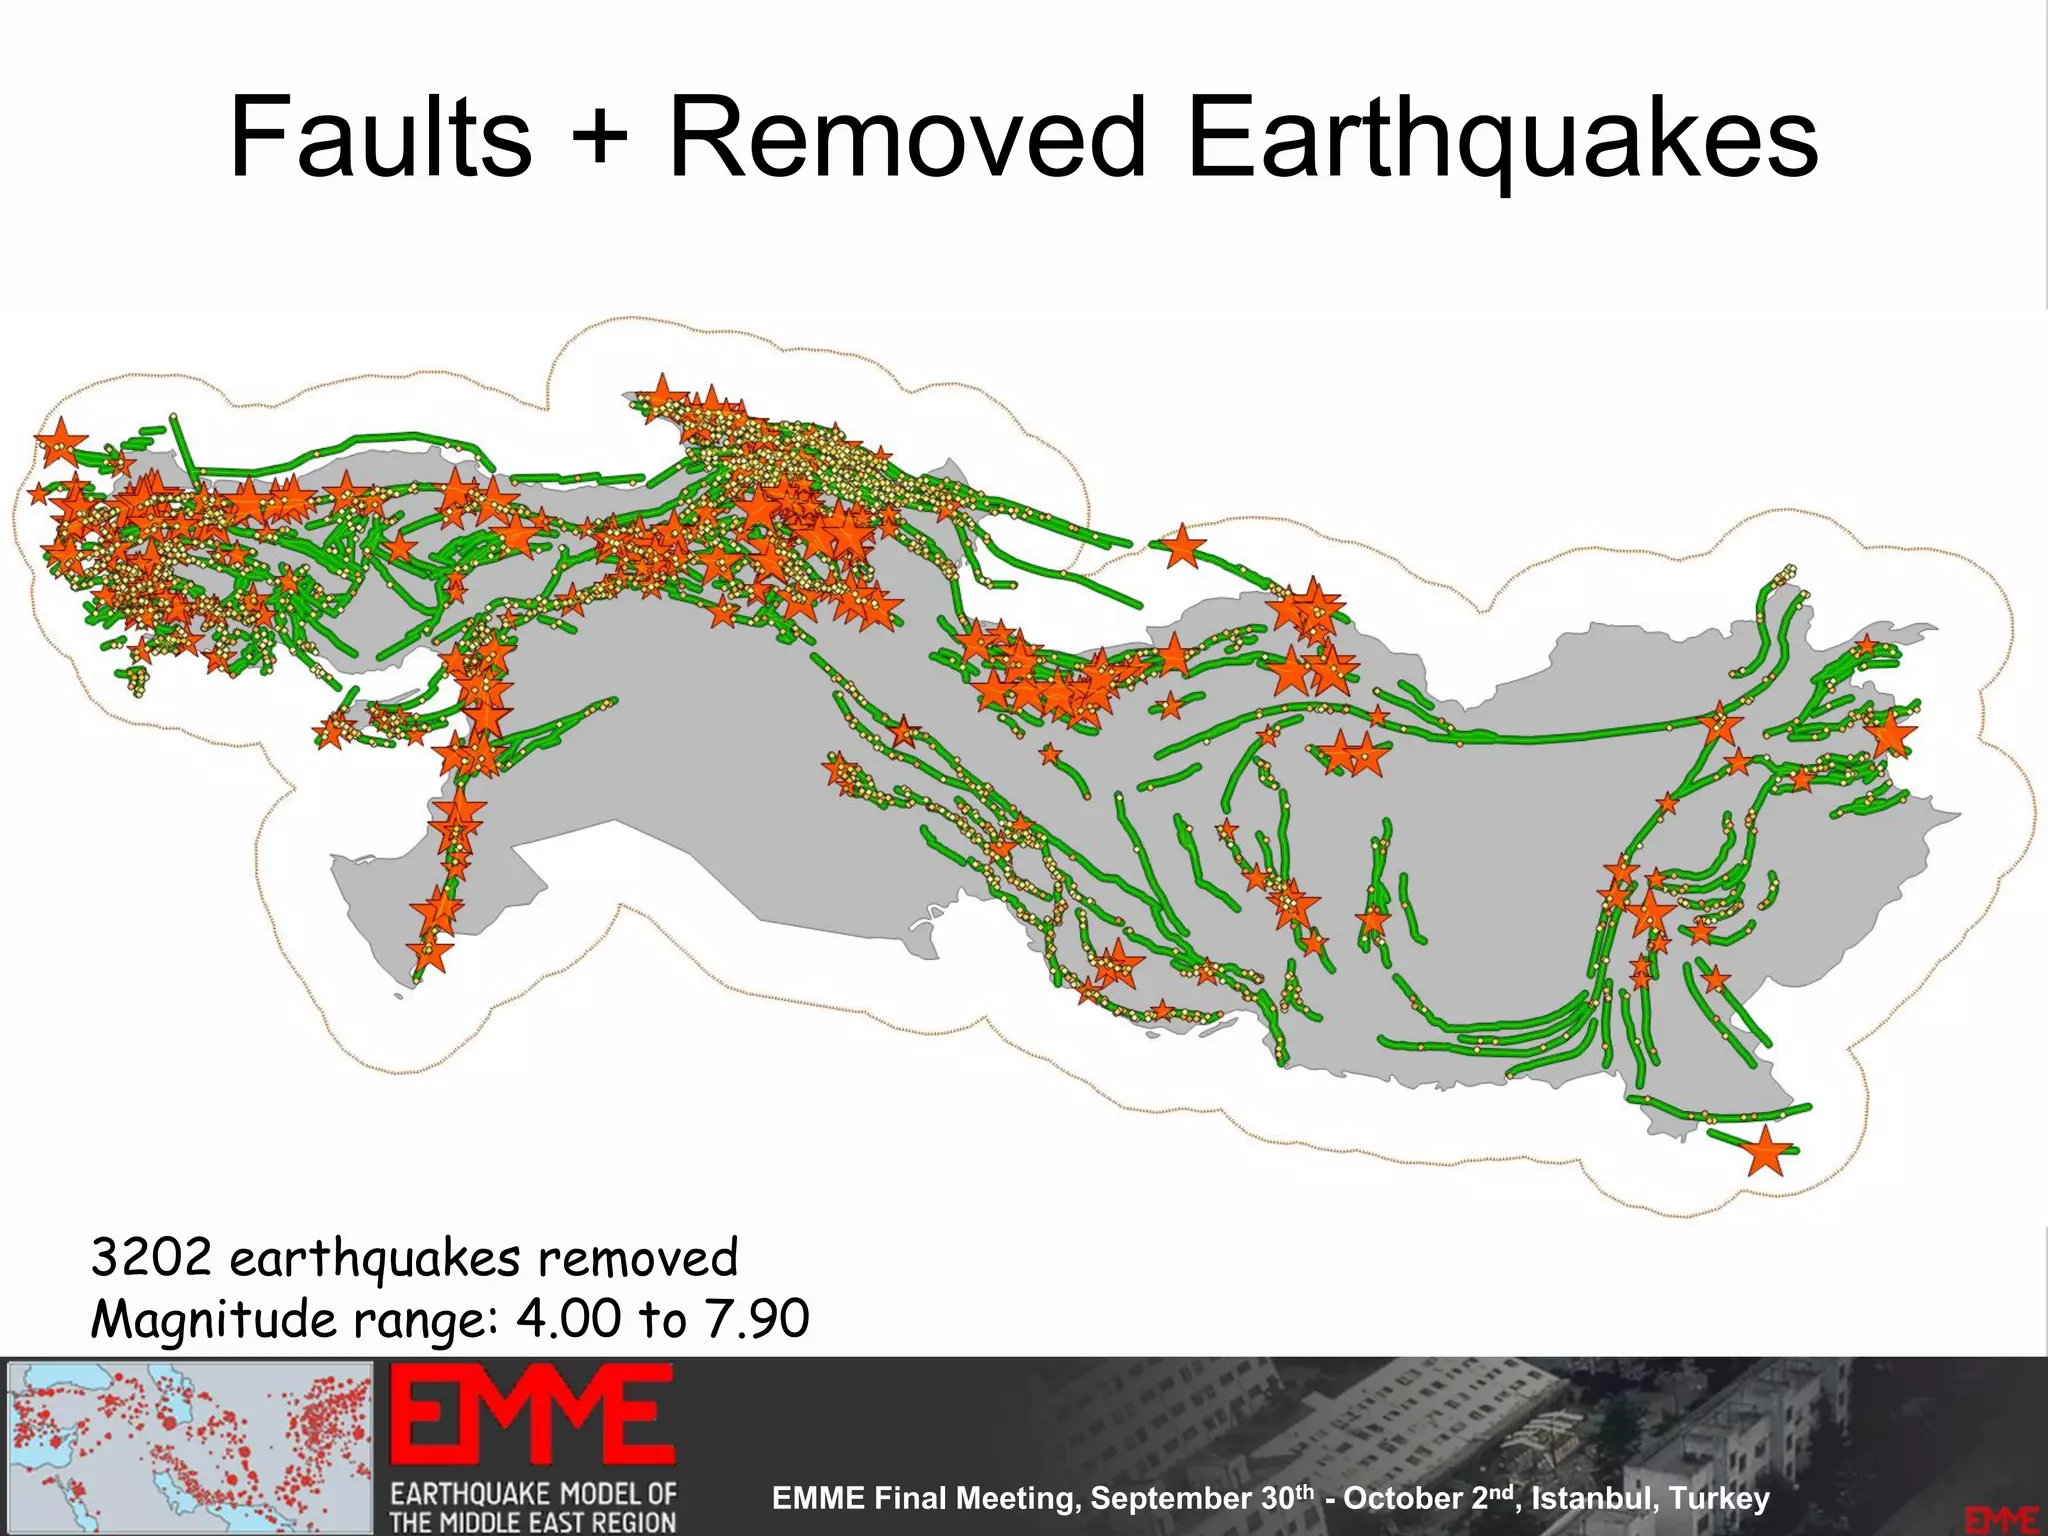
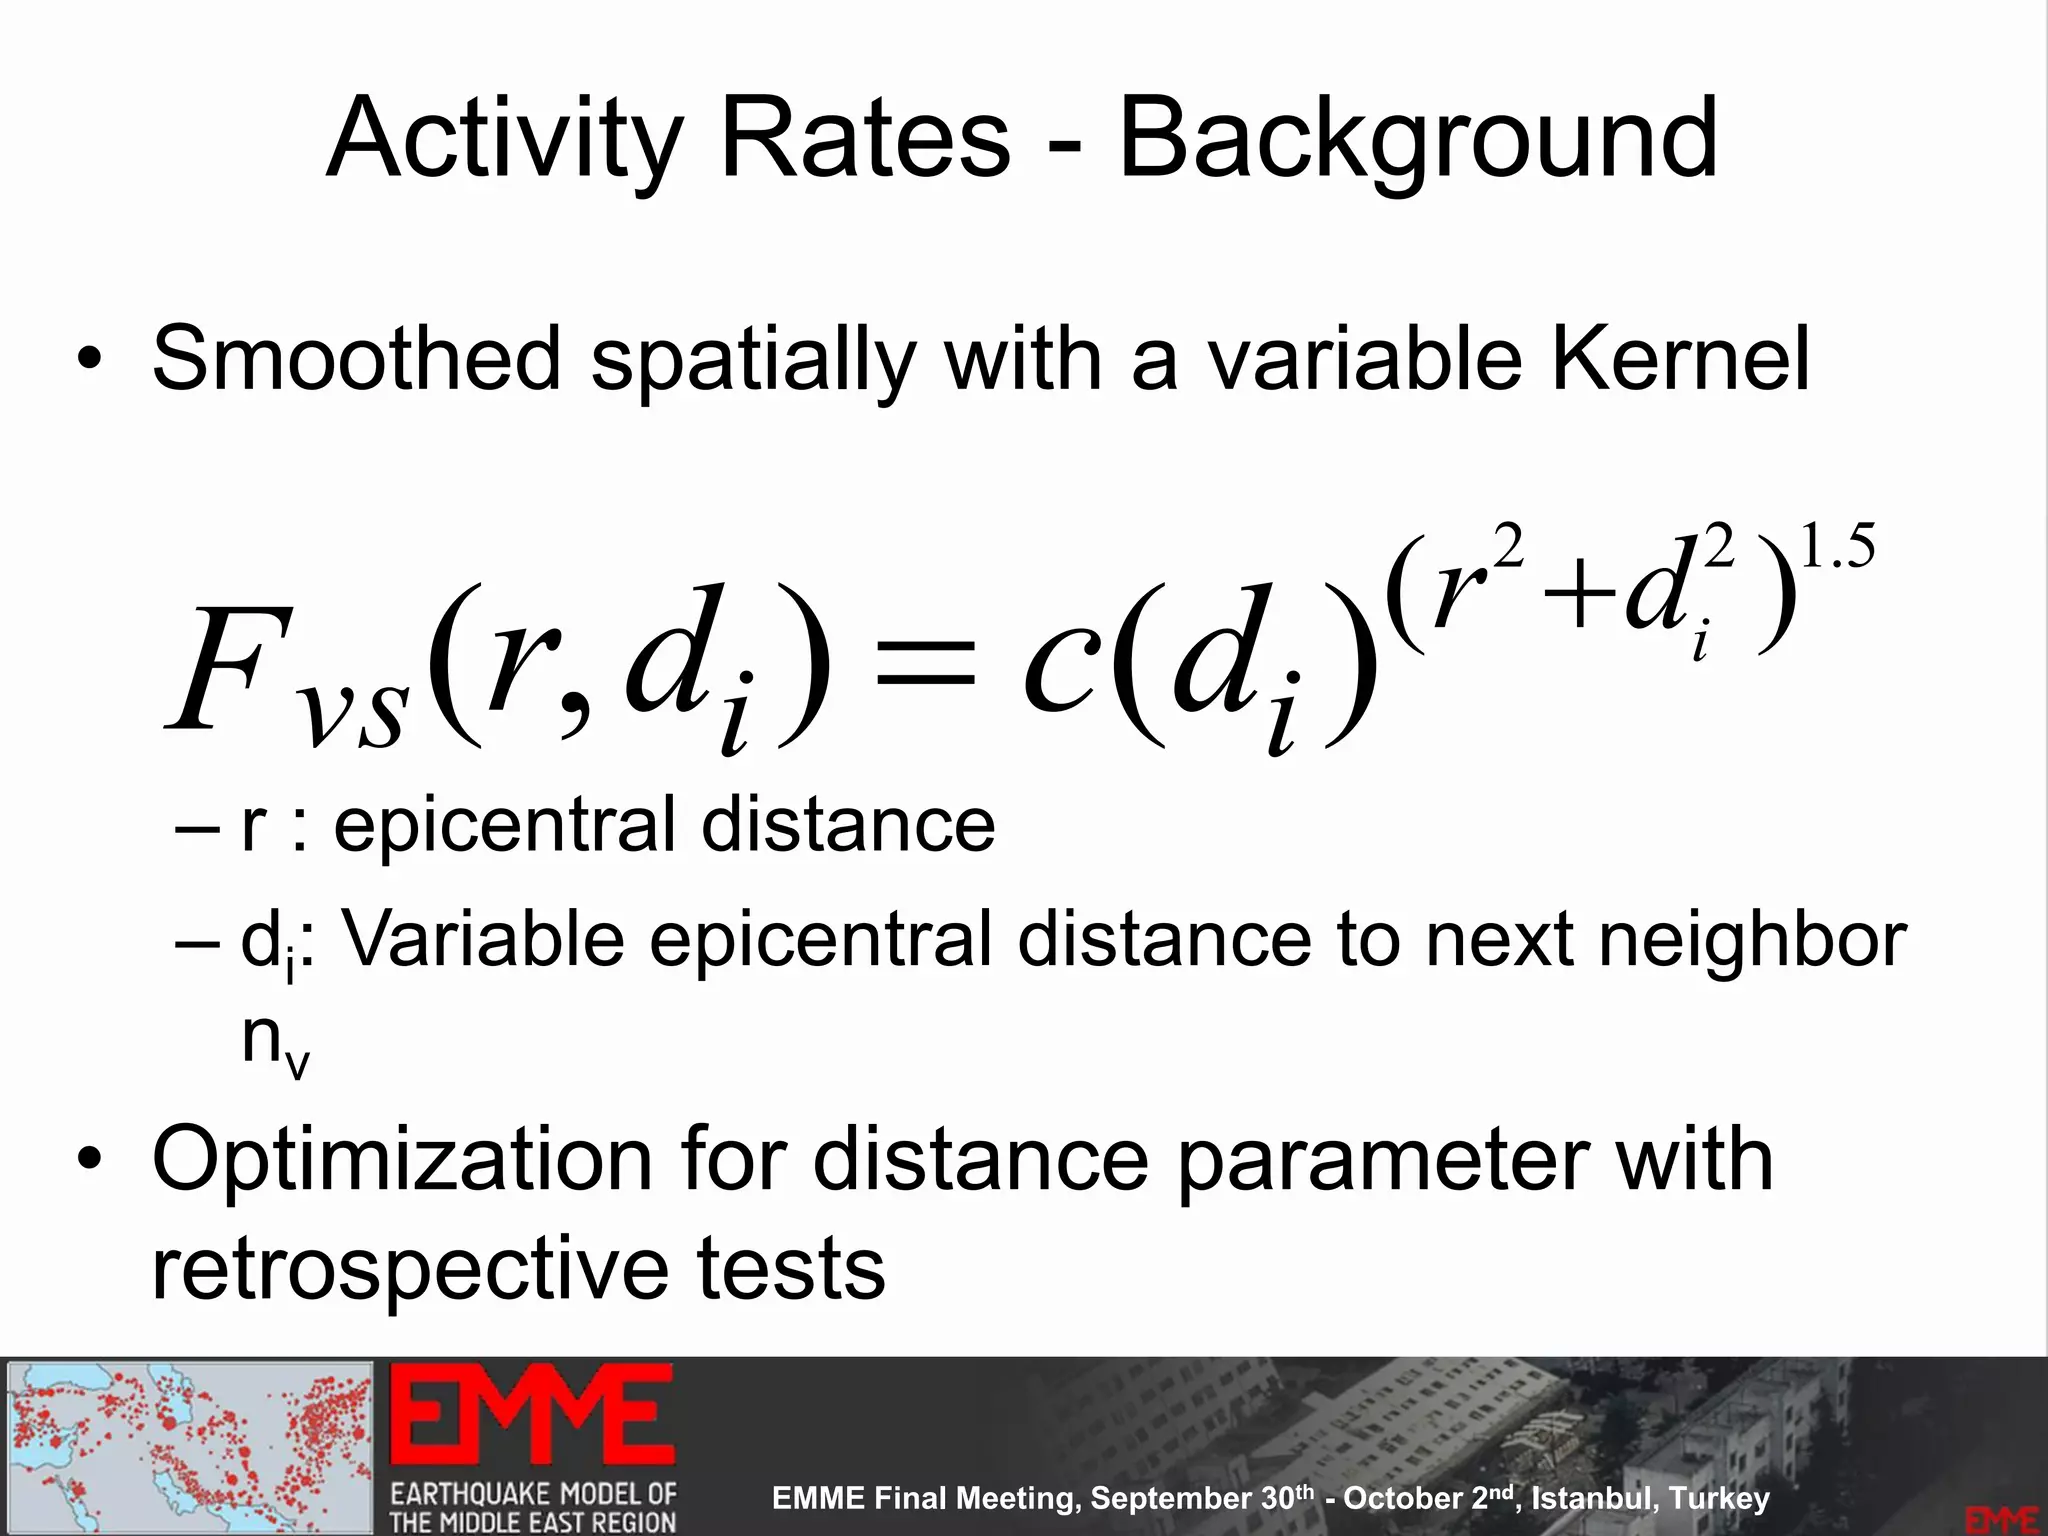
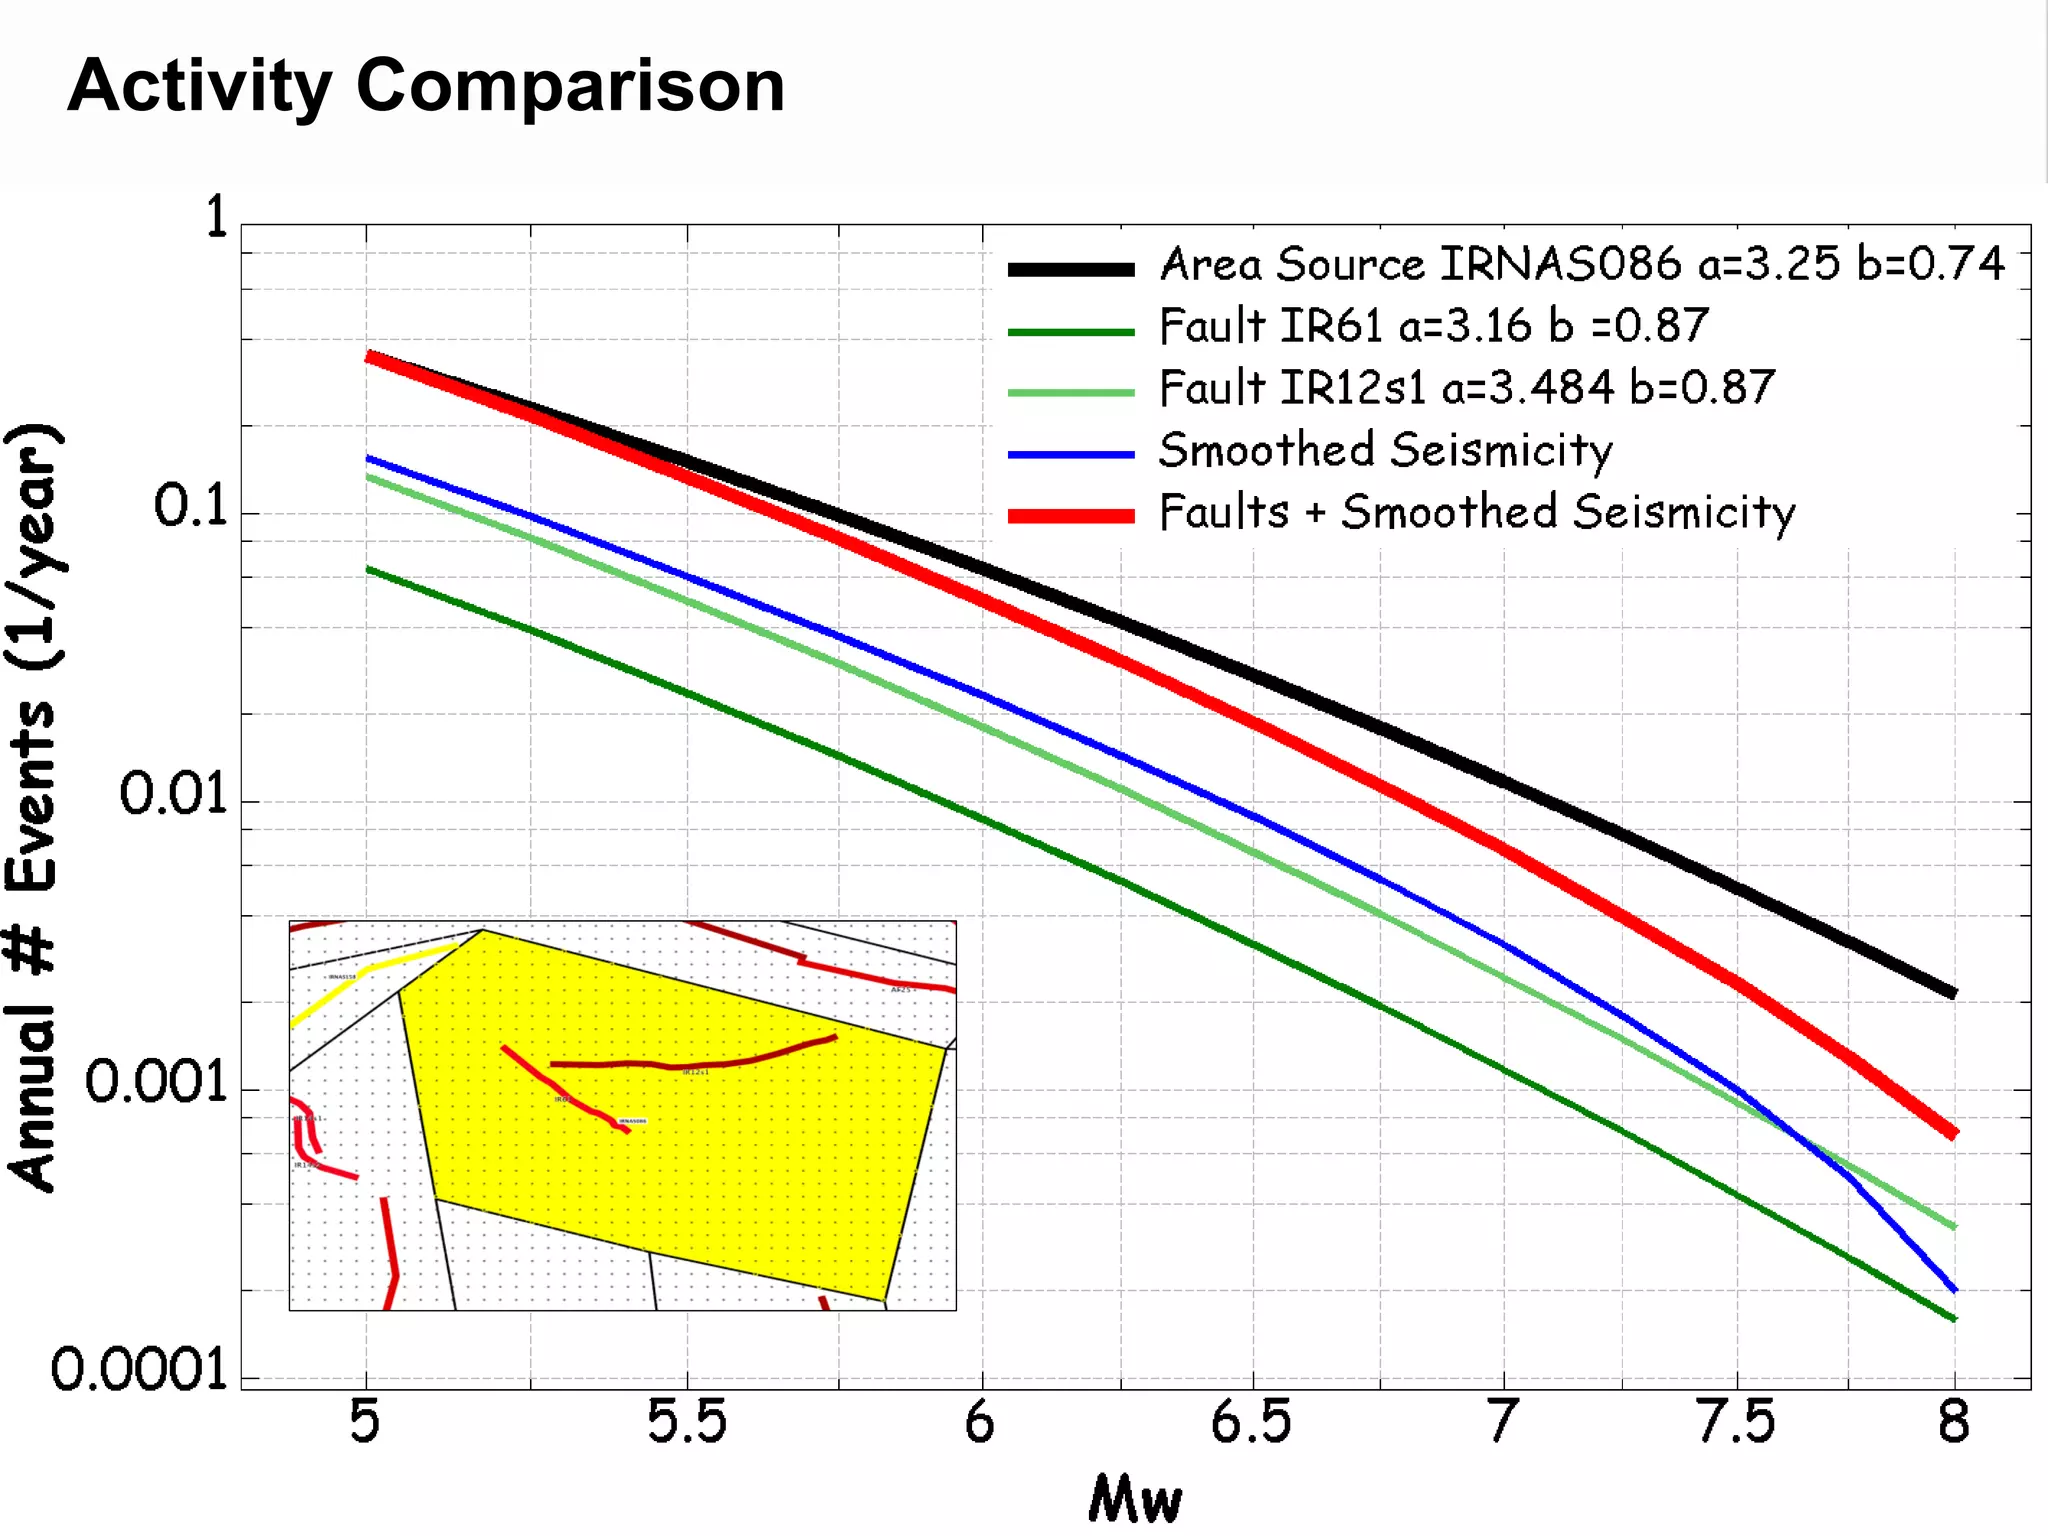
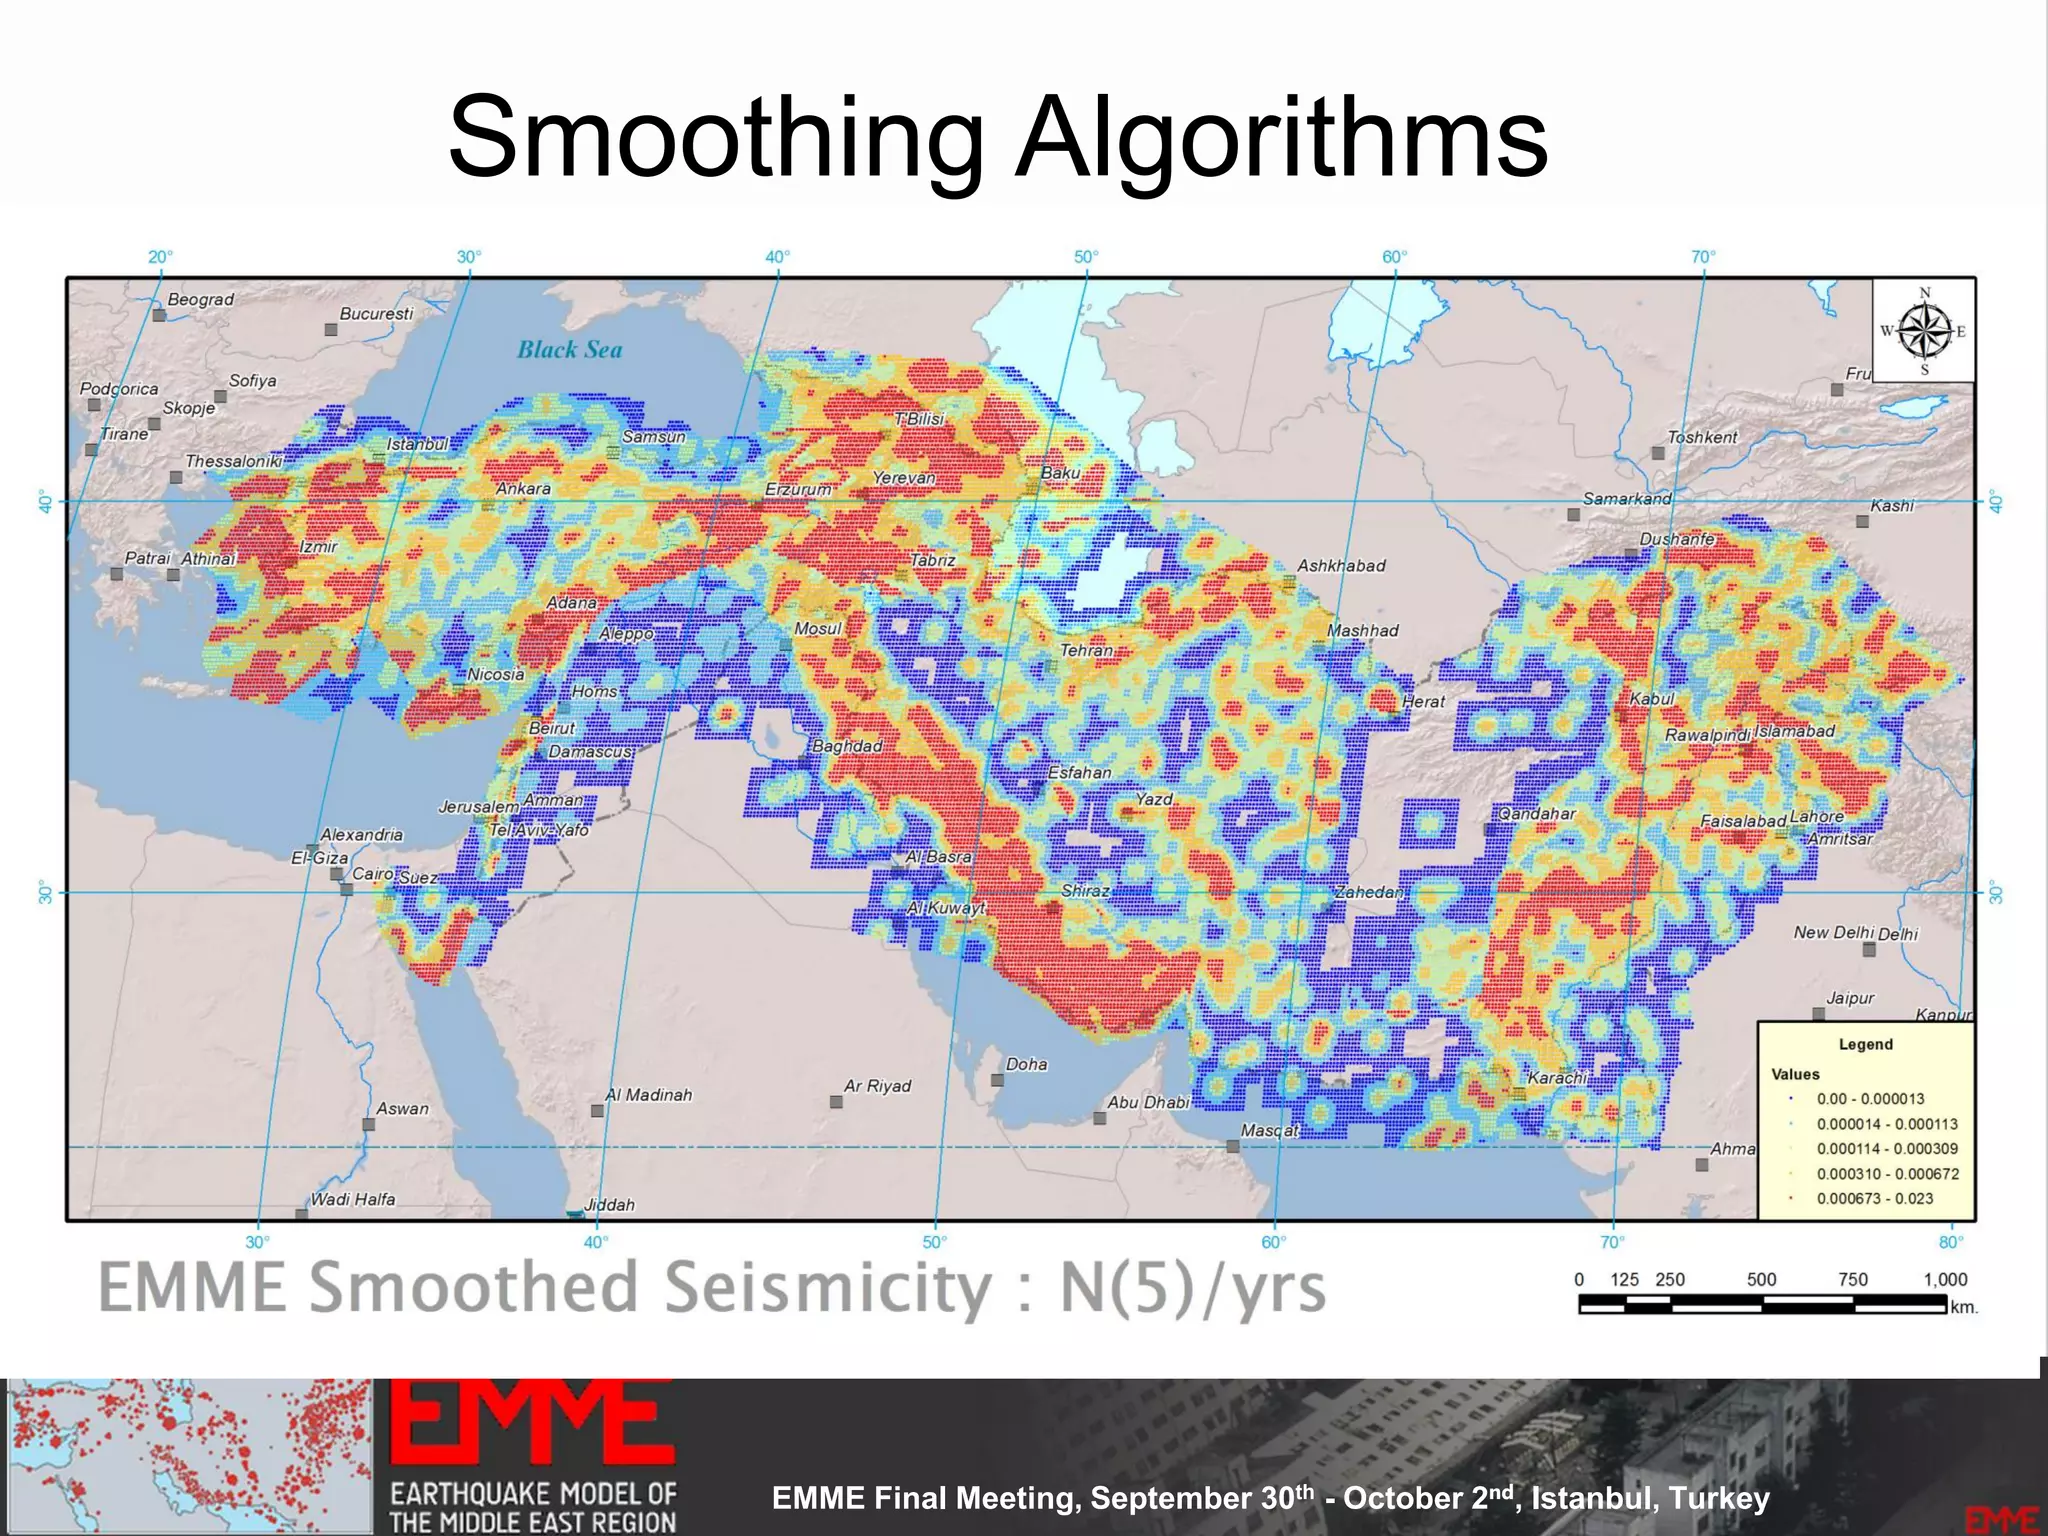
![Spatially Smoothed Seismicity
• Based on the
– Up-to-date seismicity
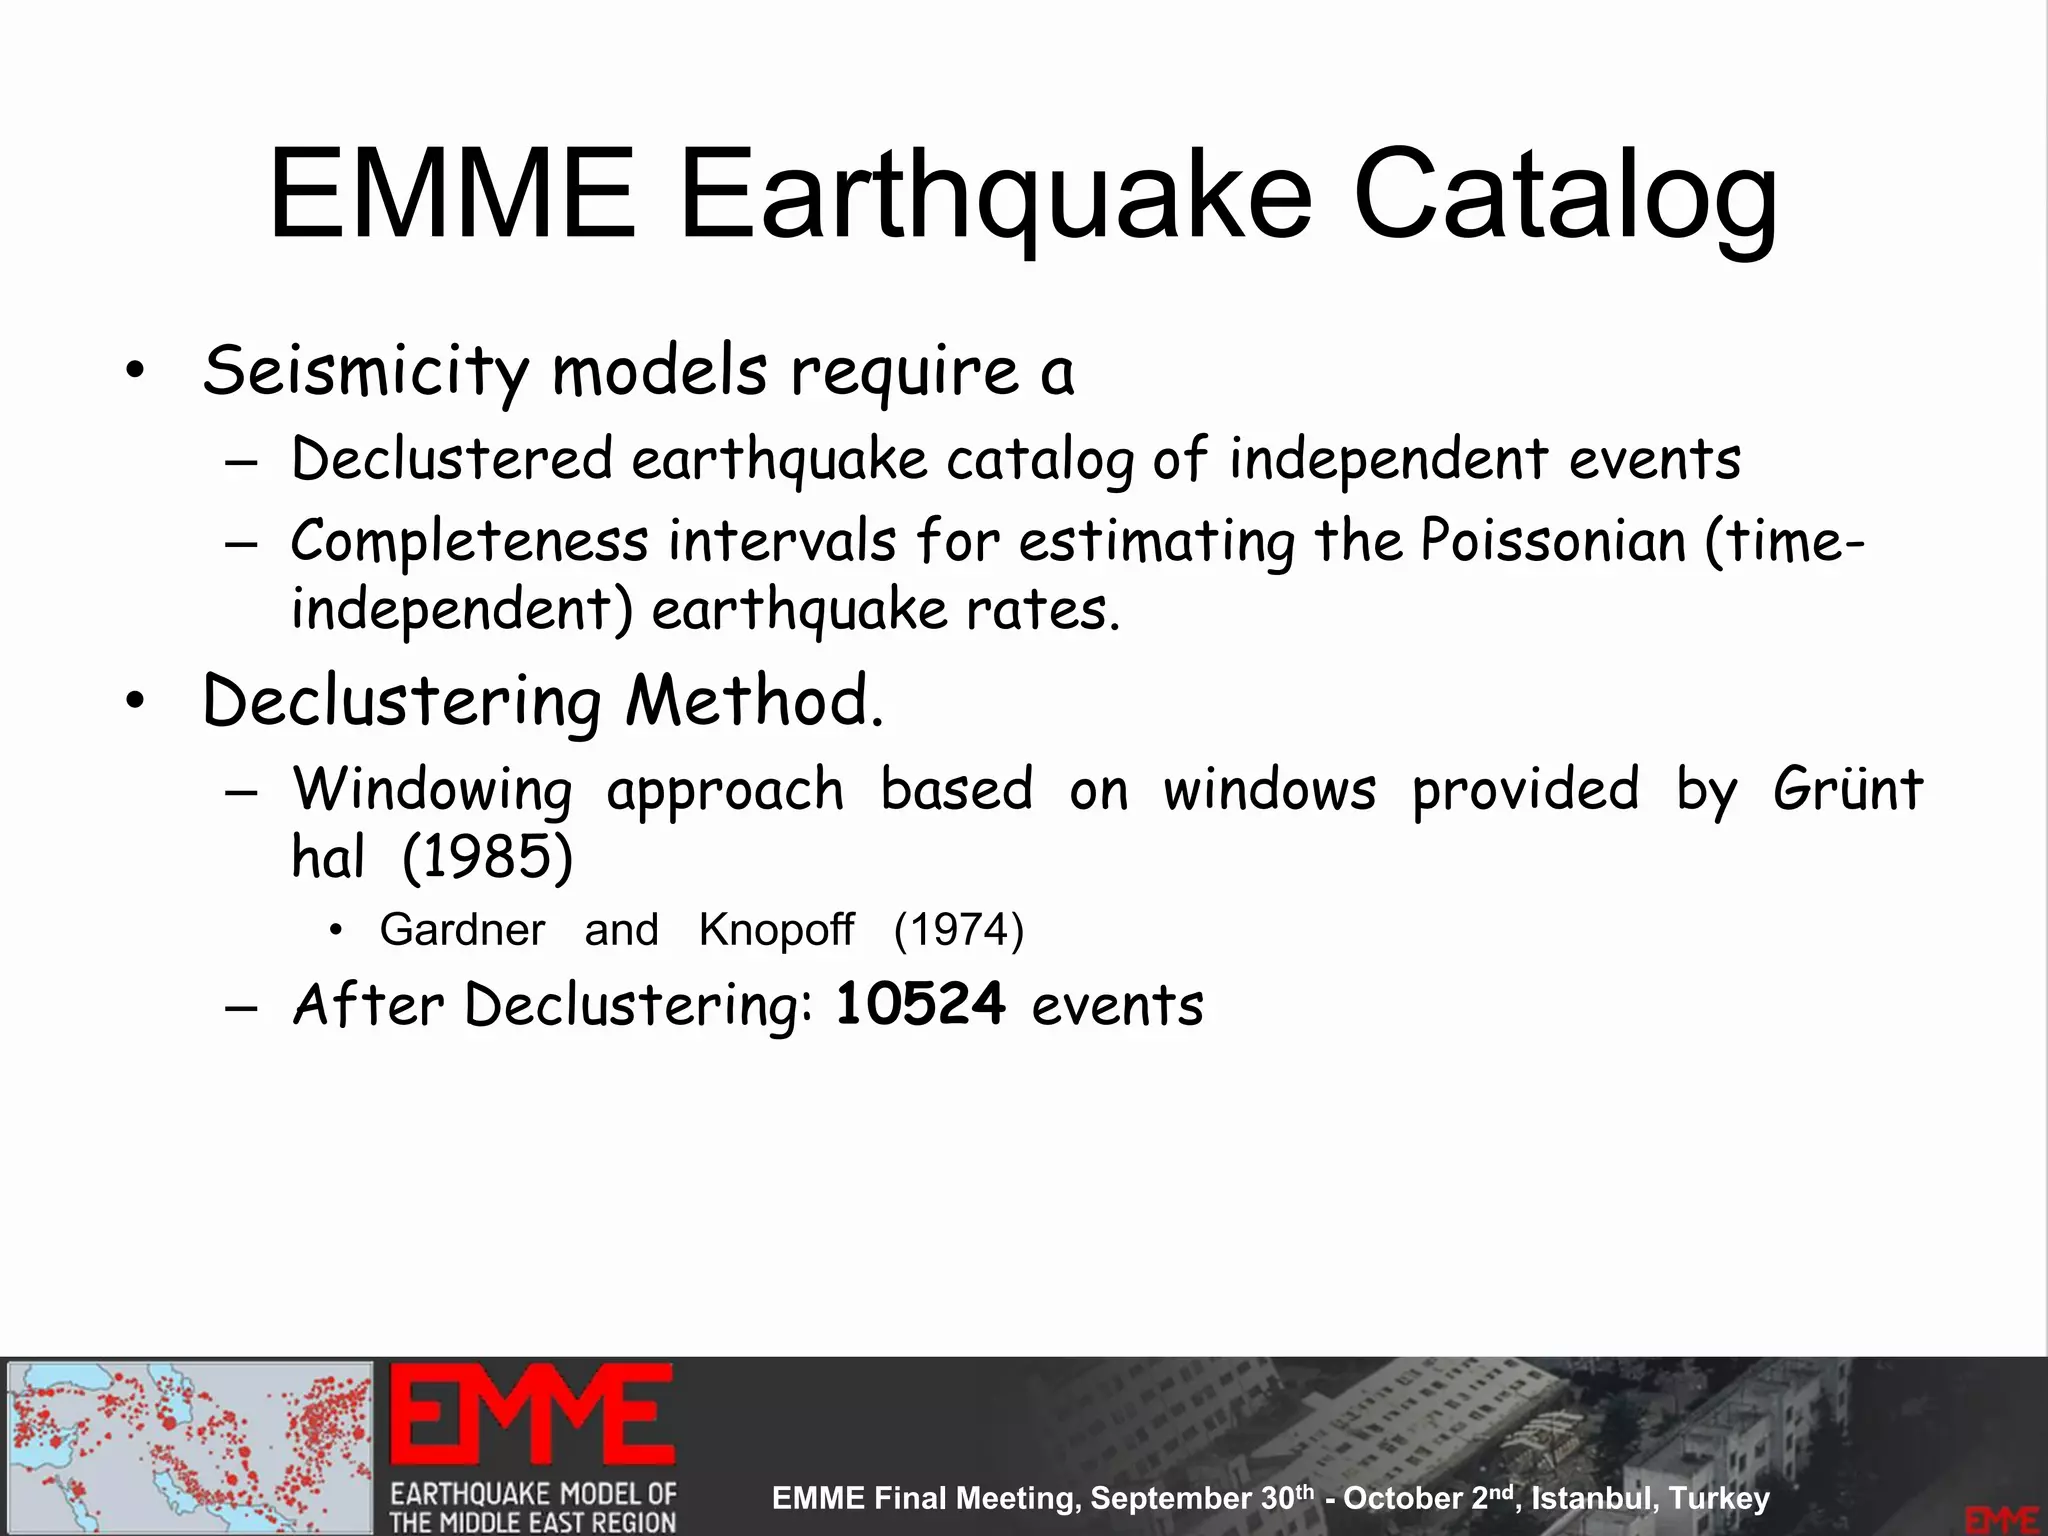
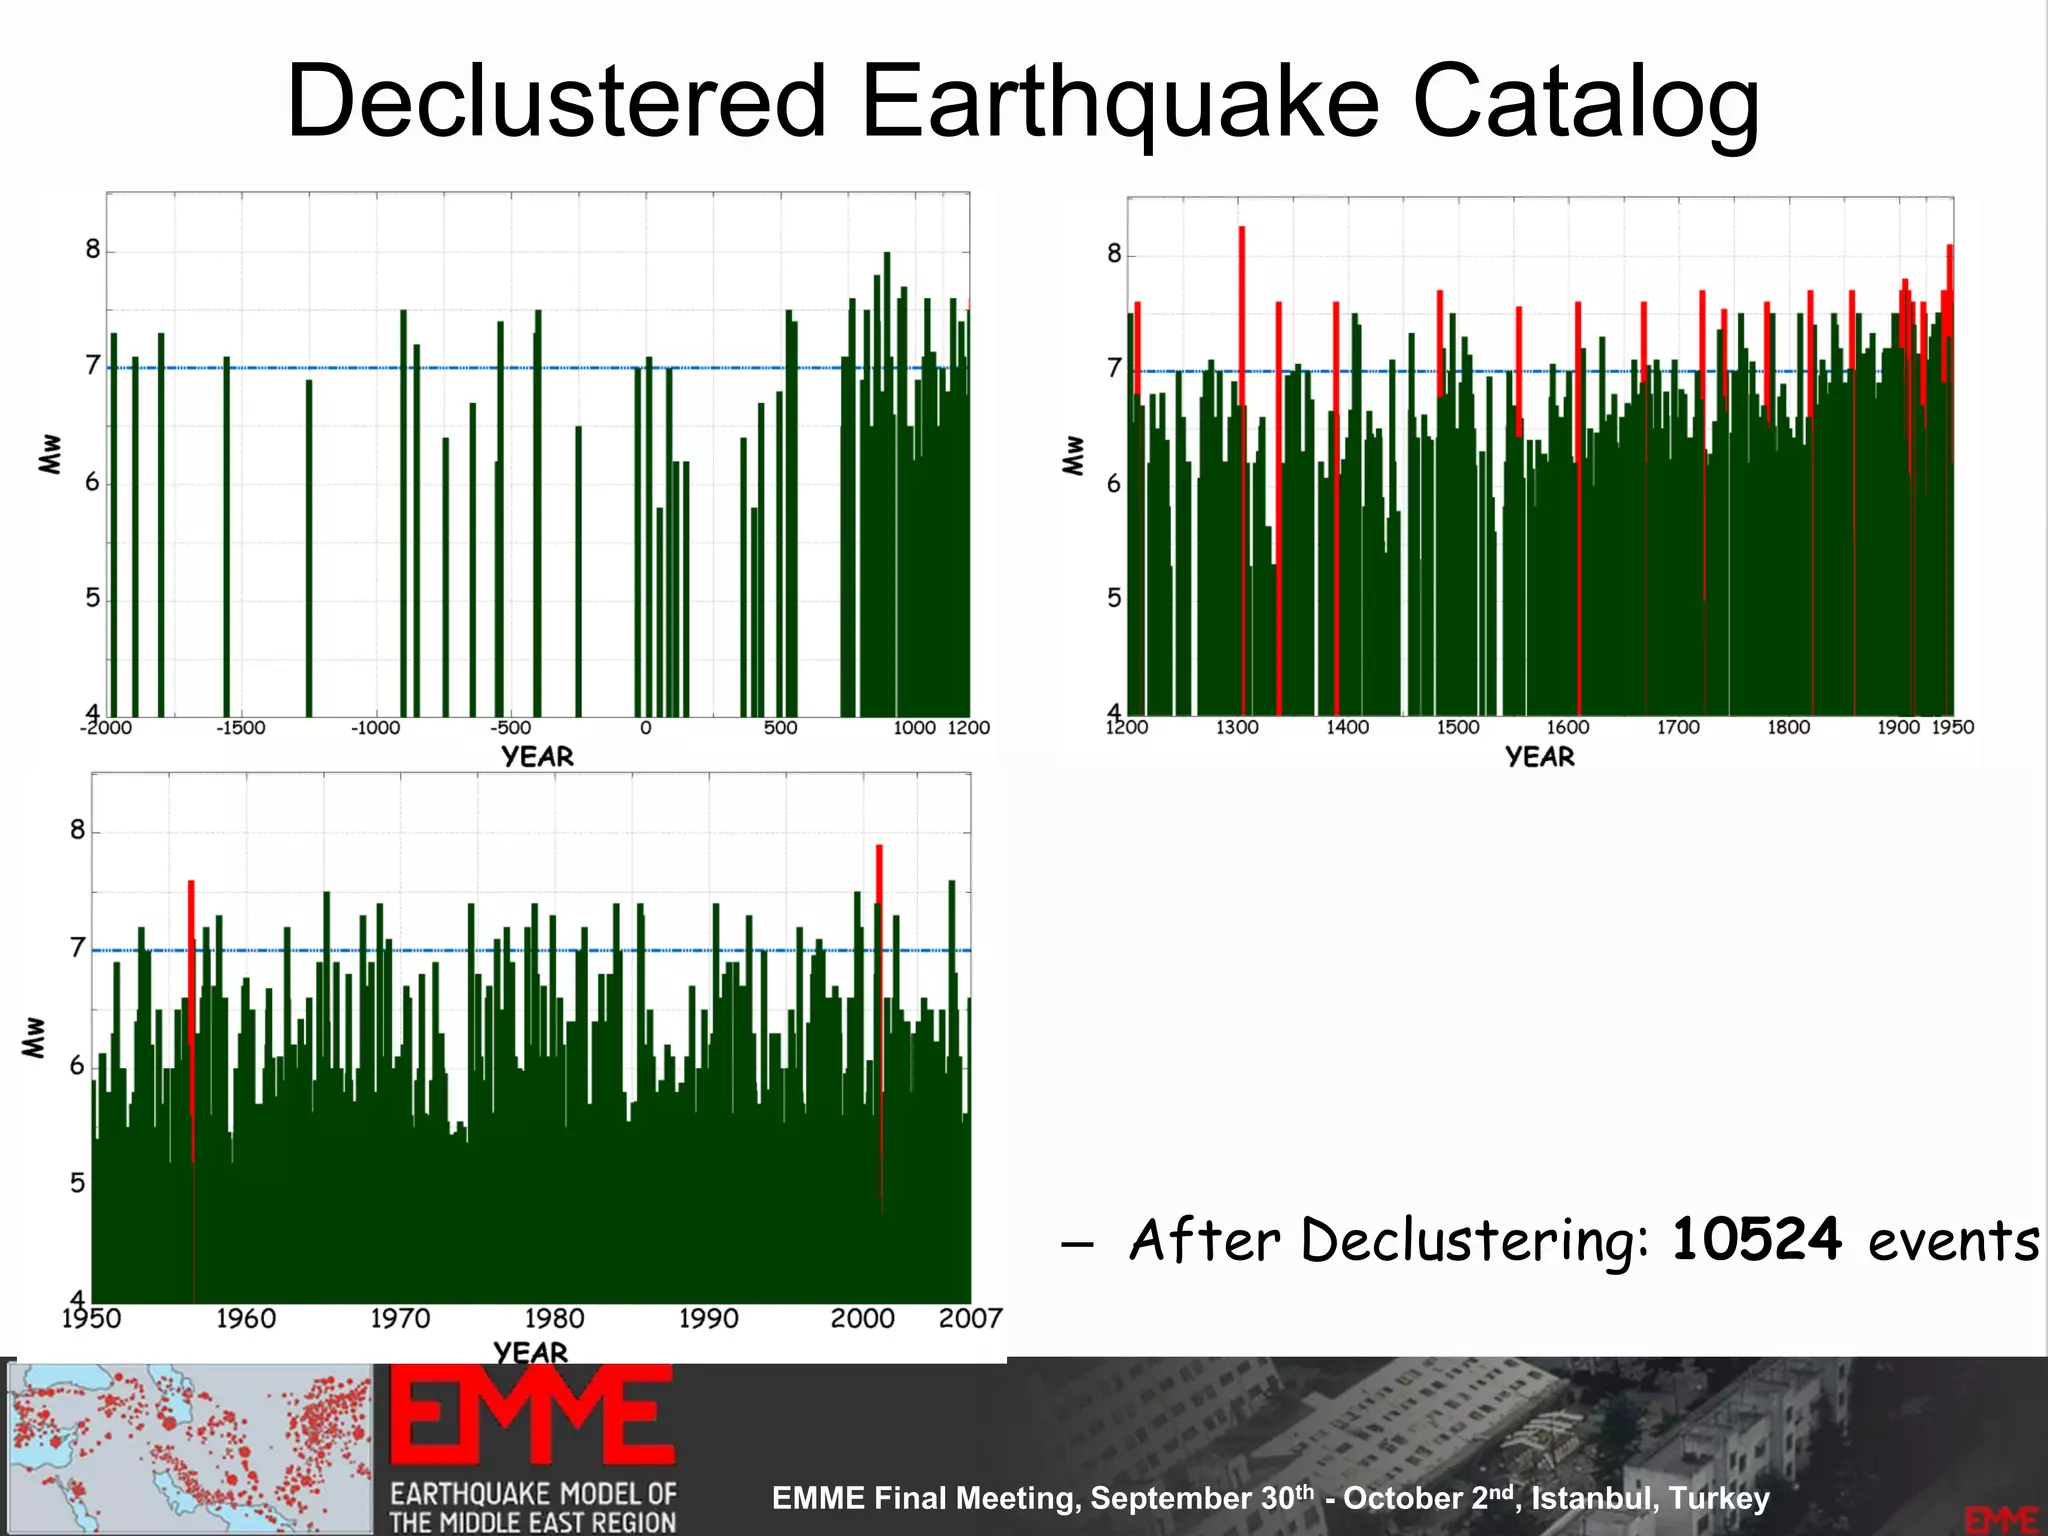
– Declustered catalogue
• Main Assumption:
– Earthquake's self-similarity: earthquakes occur at near clusters of
previous smaller earthquakes.
– Derived equally spaced [10 x 10 km] cells
– 53300 non-overlapping cells
– the earthquake rates determined for cells are spatially smoothed
using a one Gaussian smoothing kernel Frankel 1995]
– Kernel constant size equals to 25km](https://image.slidesharecdn.com/emmesourcemodeldanciuetal201309-130930095907-phpapp01/75/Seismic-Hazard-Model-for-the-Middle-East-Region-Laurentiu-Danciu-Swiss-Seismological-Service-ETH-Zurich-Switzerland-GEM-Hazard-Modeler-Karin-Sesetyan-Mine-Demircioglu-Kandilli-Observatory-and-Earthquake-Research-Institute-Istanbul-Turkey-73-2048.jpg)
![Source Parameterization
• Depth Distribution (three values and the corresponding
weights):
• Focal Mechanisms
– Rake Angle values (Aki’s definition)
– Percentage weights
• Ruptures Orientation
– Strike Angle (Azimuth)
– Dip Angle
• Rupture Properties
– Upper and Lower Seismogenic Depth
Point Source
[Single Rupture]](https://image.slidesharecdn.com/emmesourcemodeldanciuetal201309-130930095907-phpapp01/75/Seismic-Hazard-Model-for-the-Middle-East-Region-Laurentiu-Danciu-Swiss-Seismological-Service-ETH-Zurich-Switzerland-GEM-Hazard-Modeler-Karin-Sesetyan-Mine-Demircioglu-Kandilli-Observatory-and-Earthquake-Research-Institute-Istanbul-Turkey-75-2048.jpg)
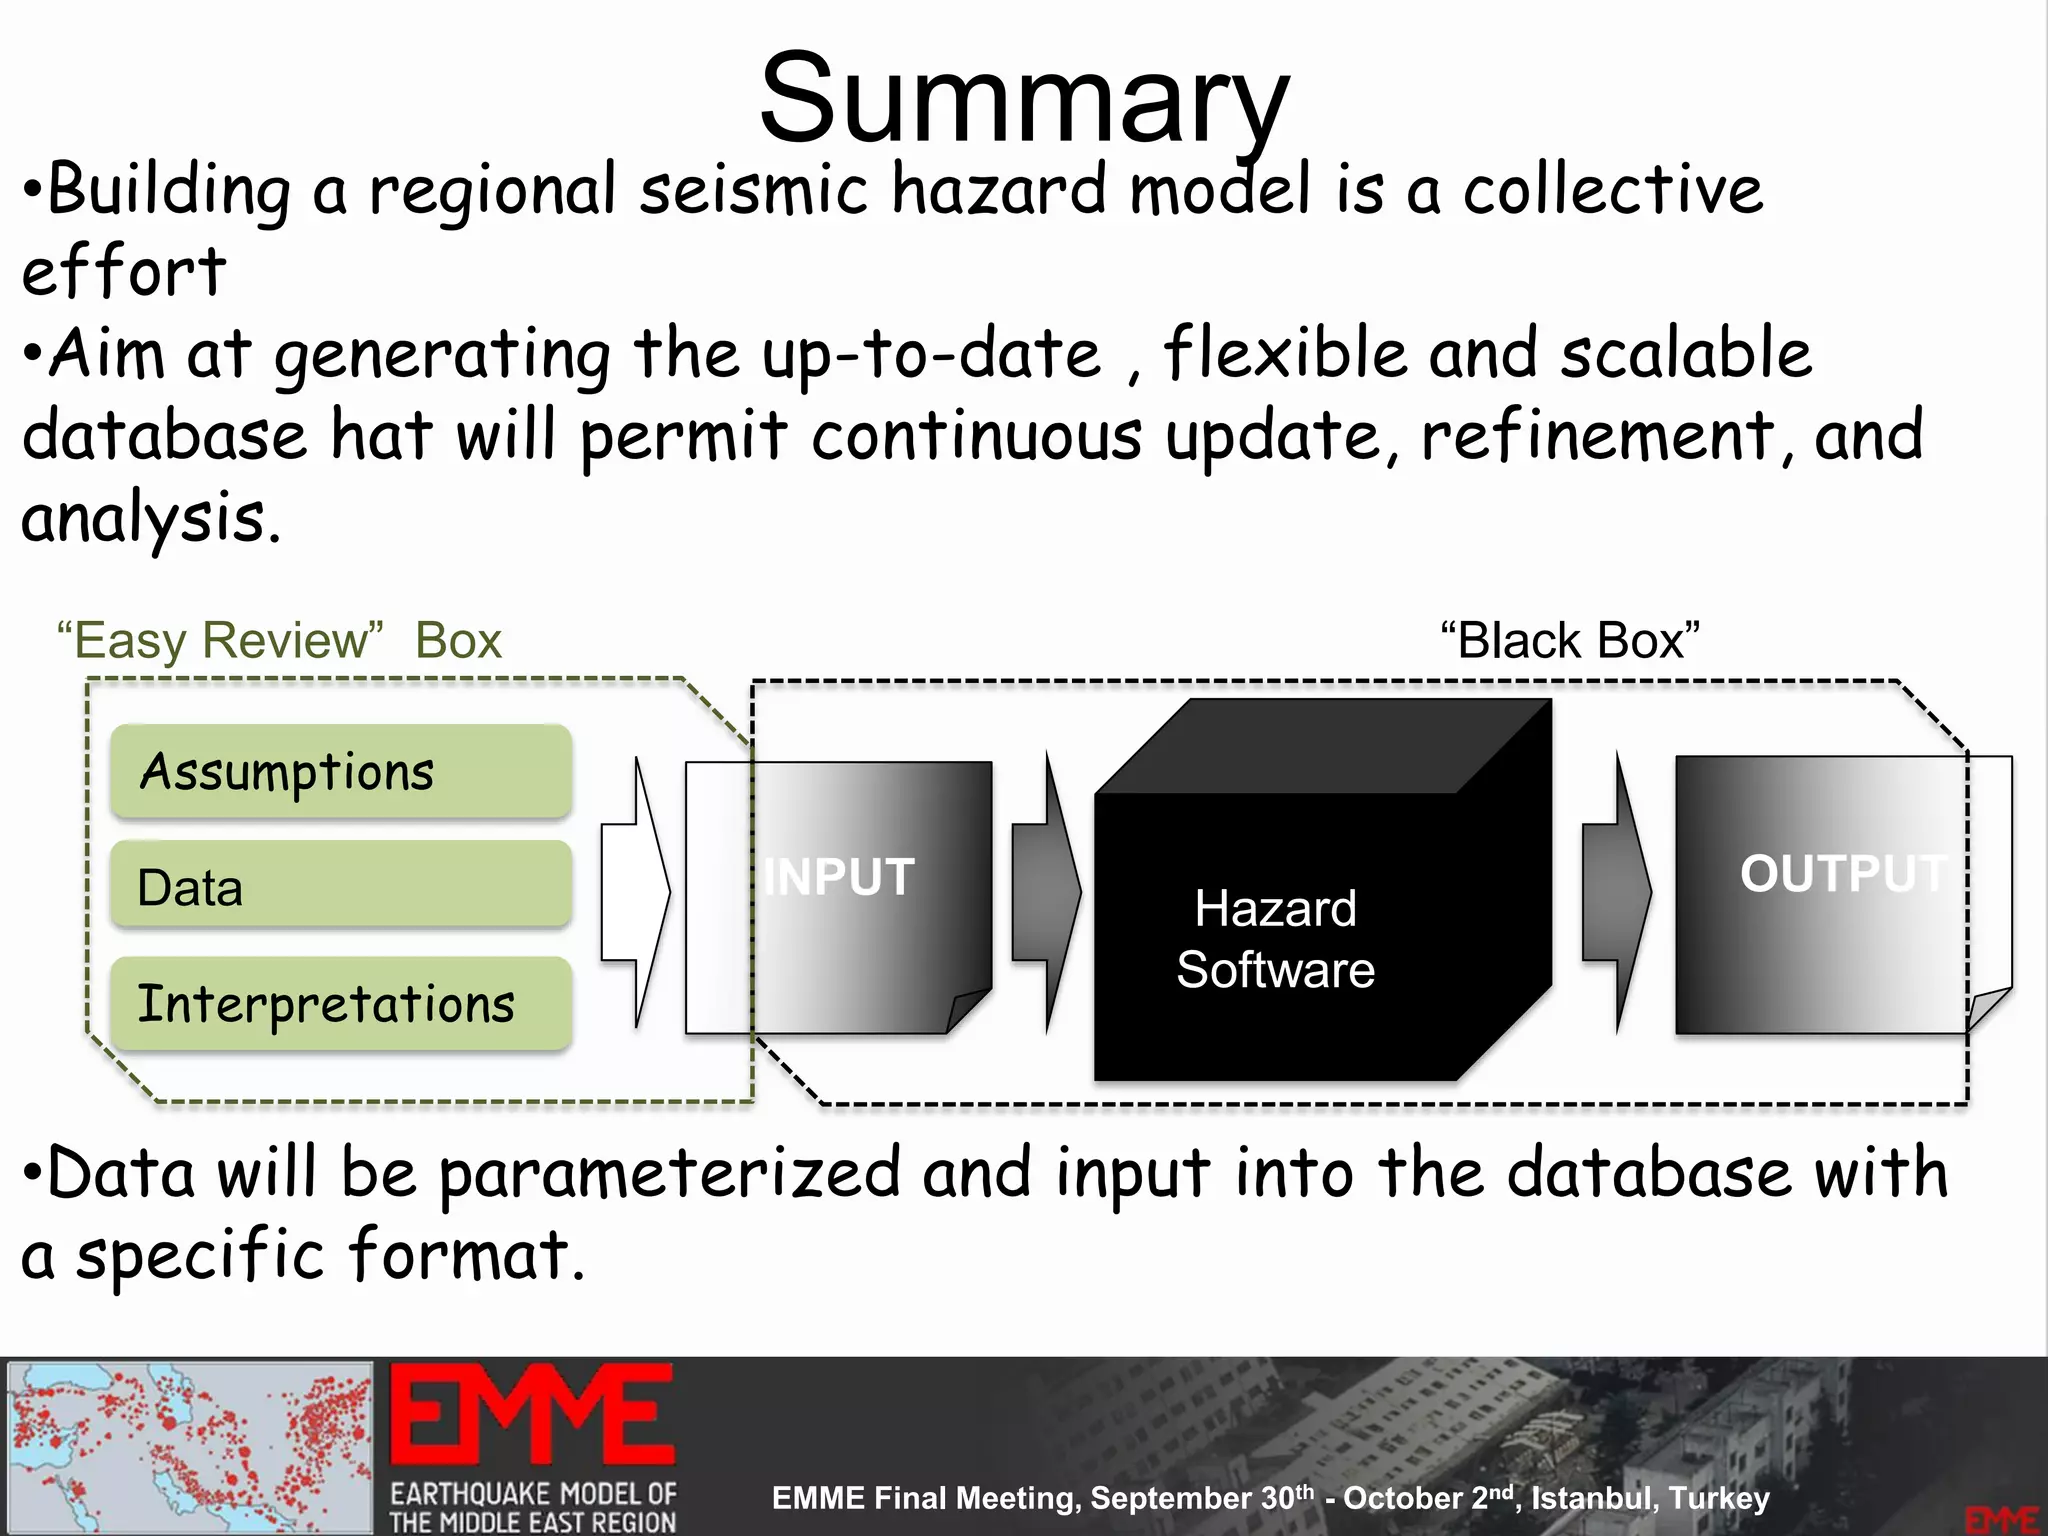

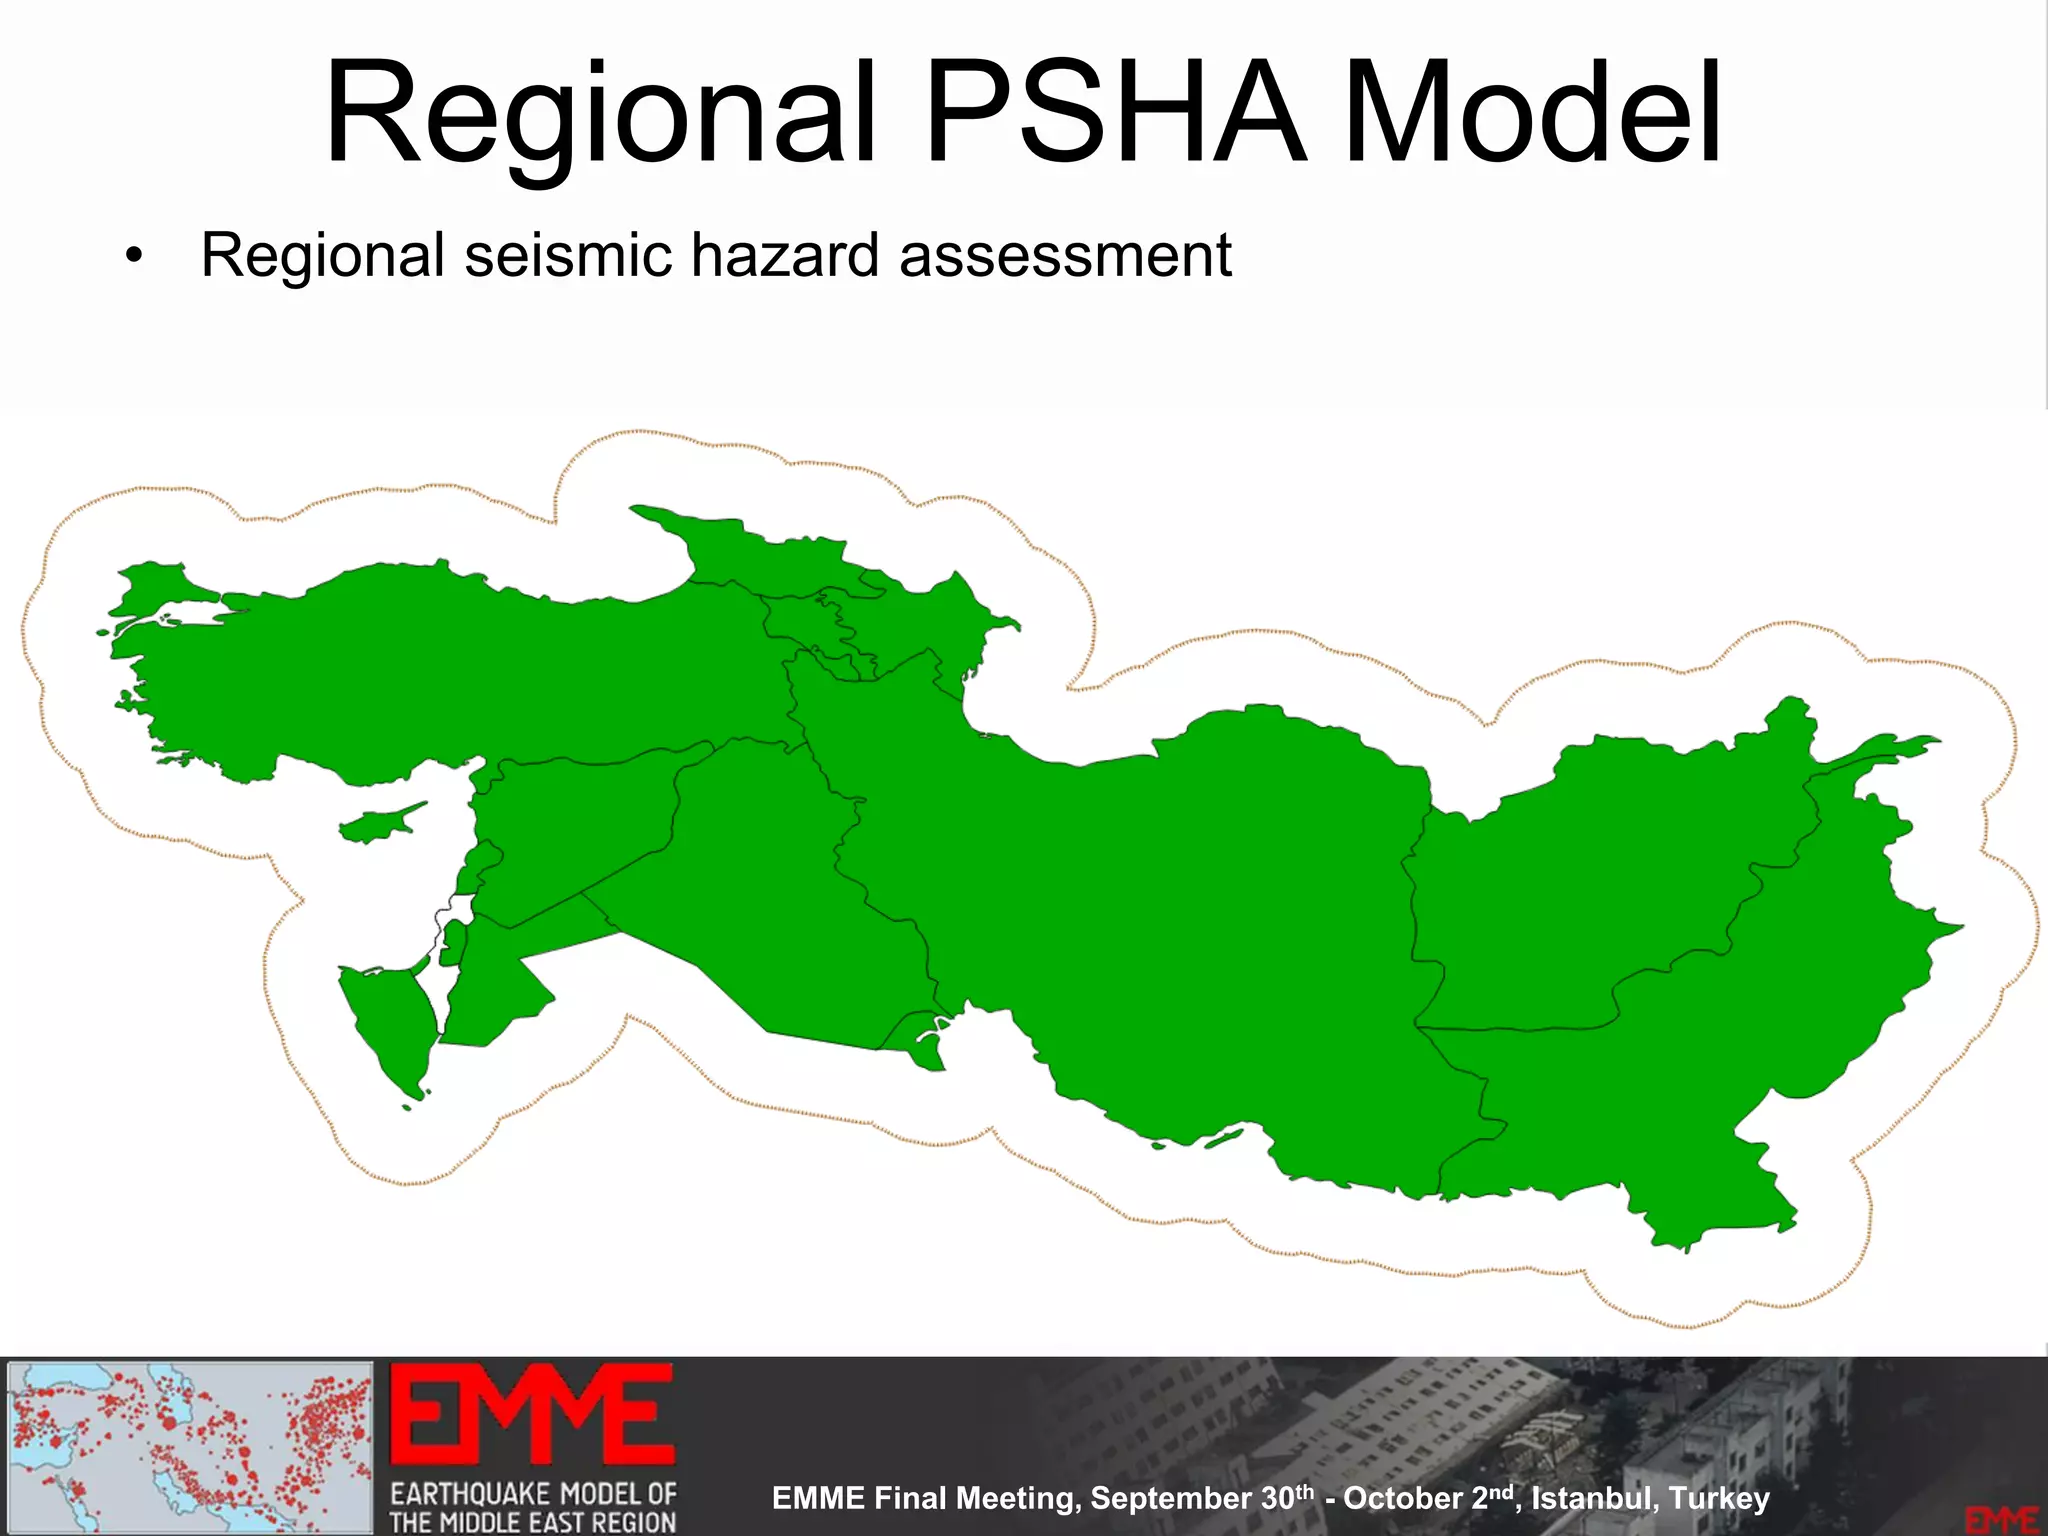
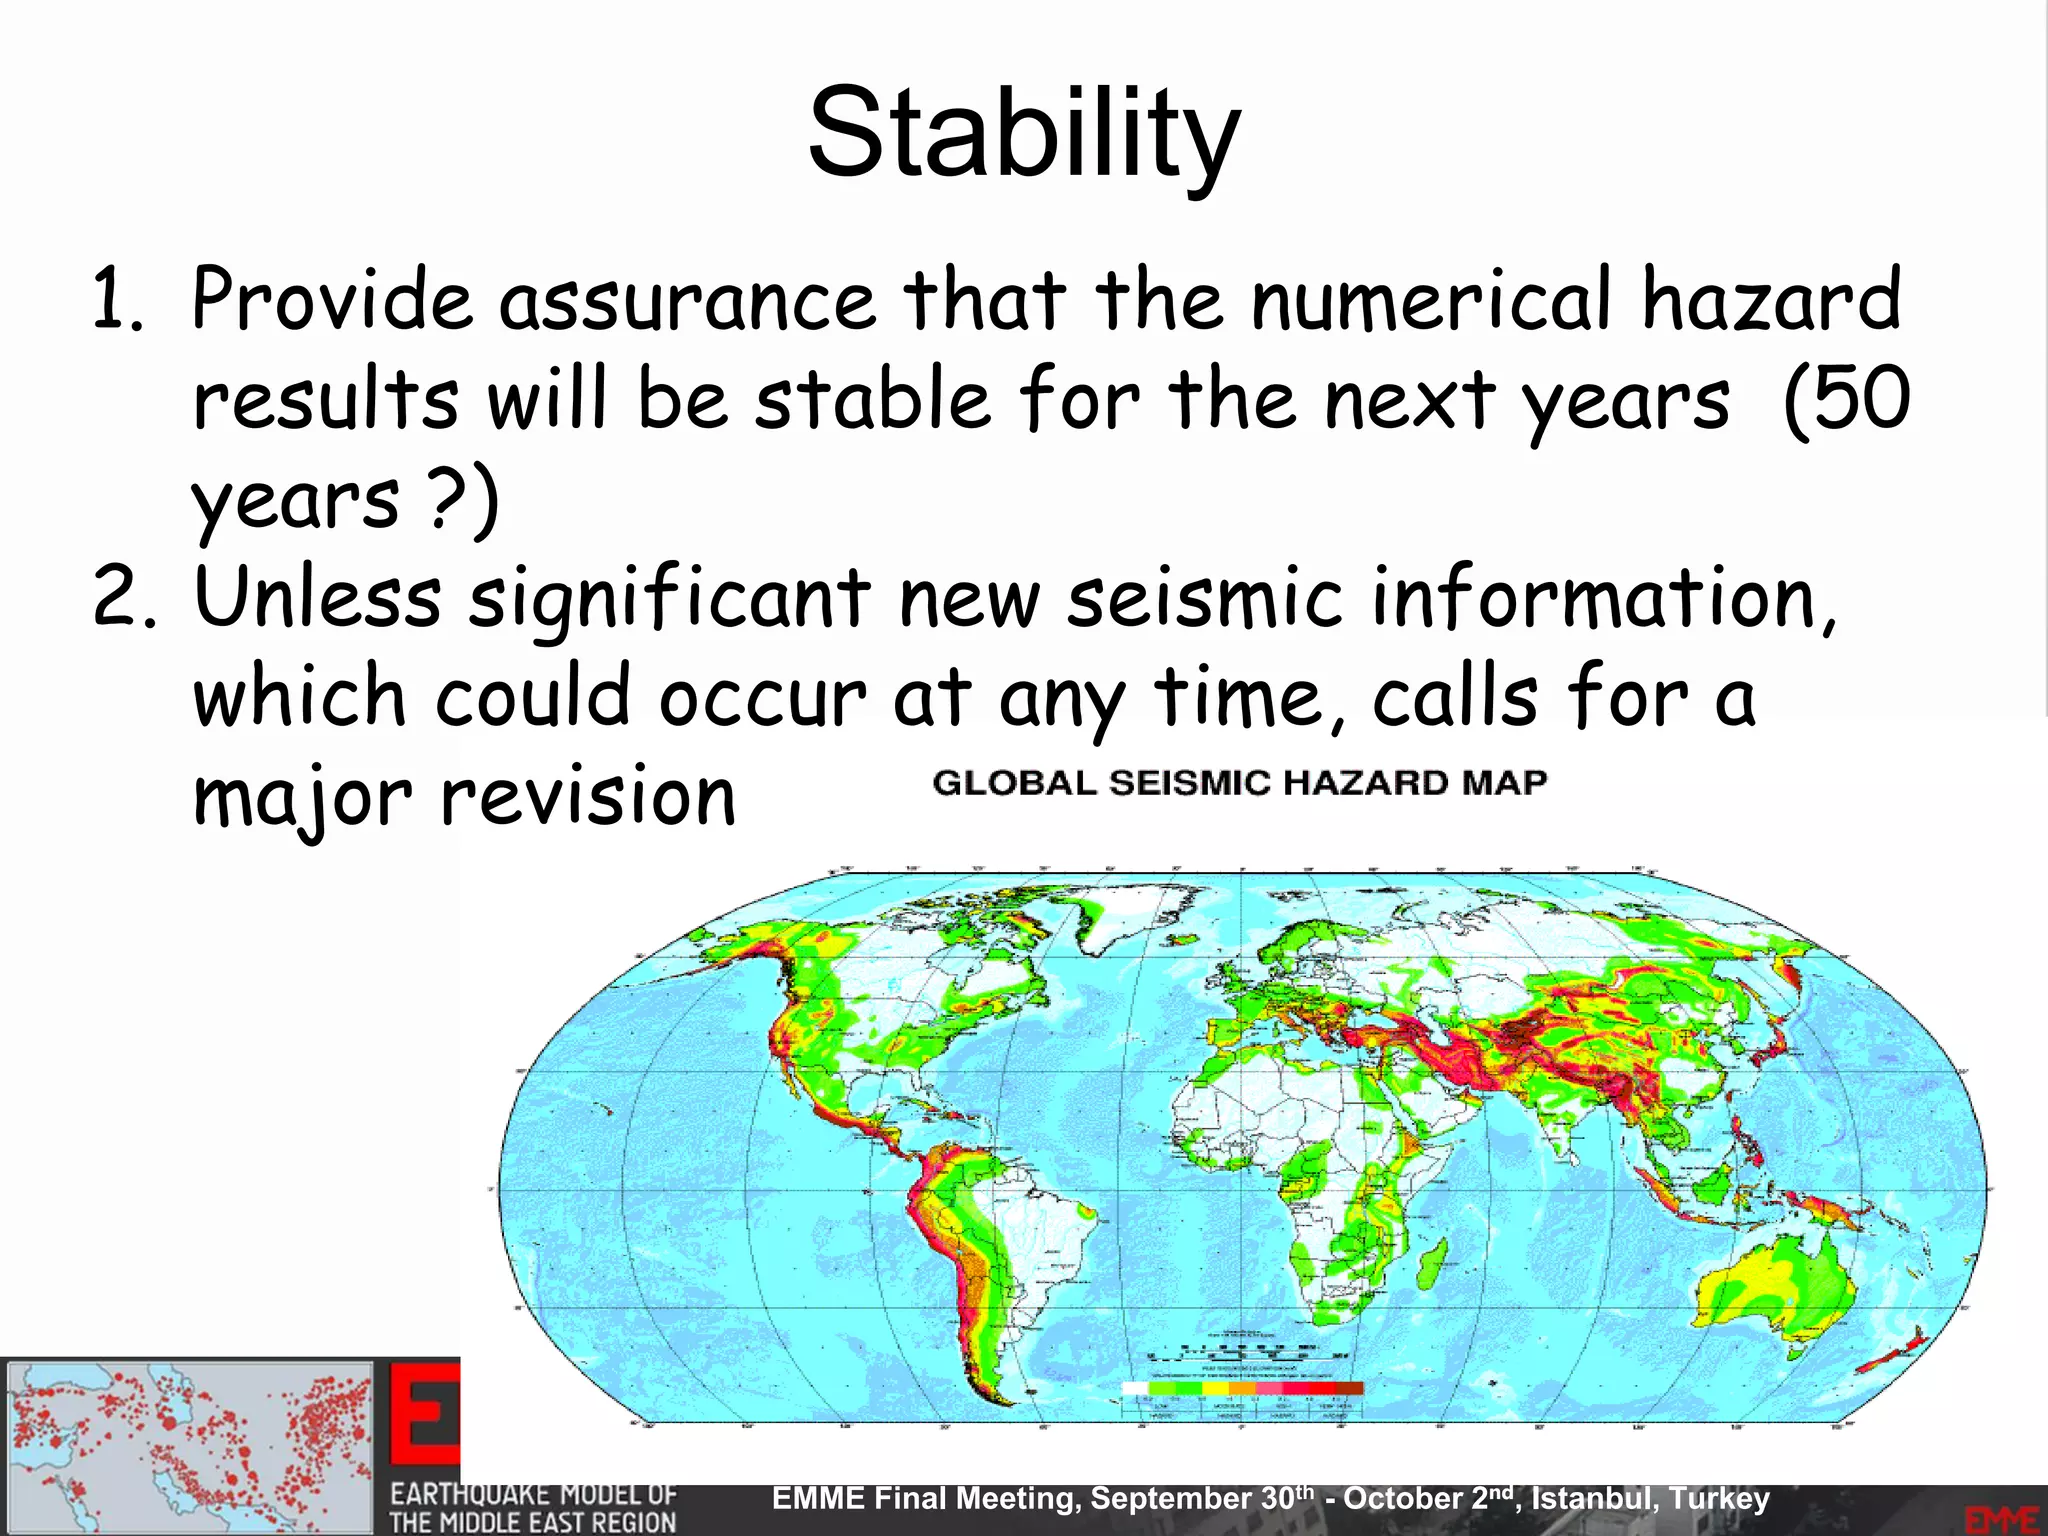
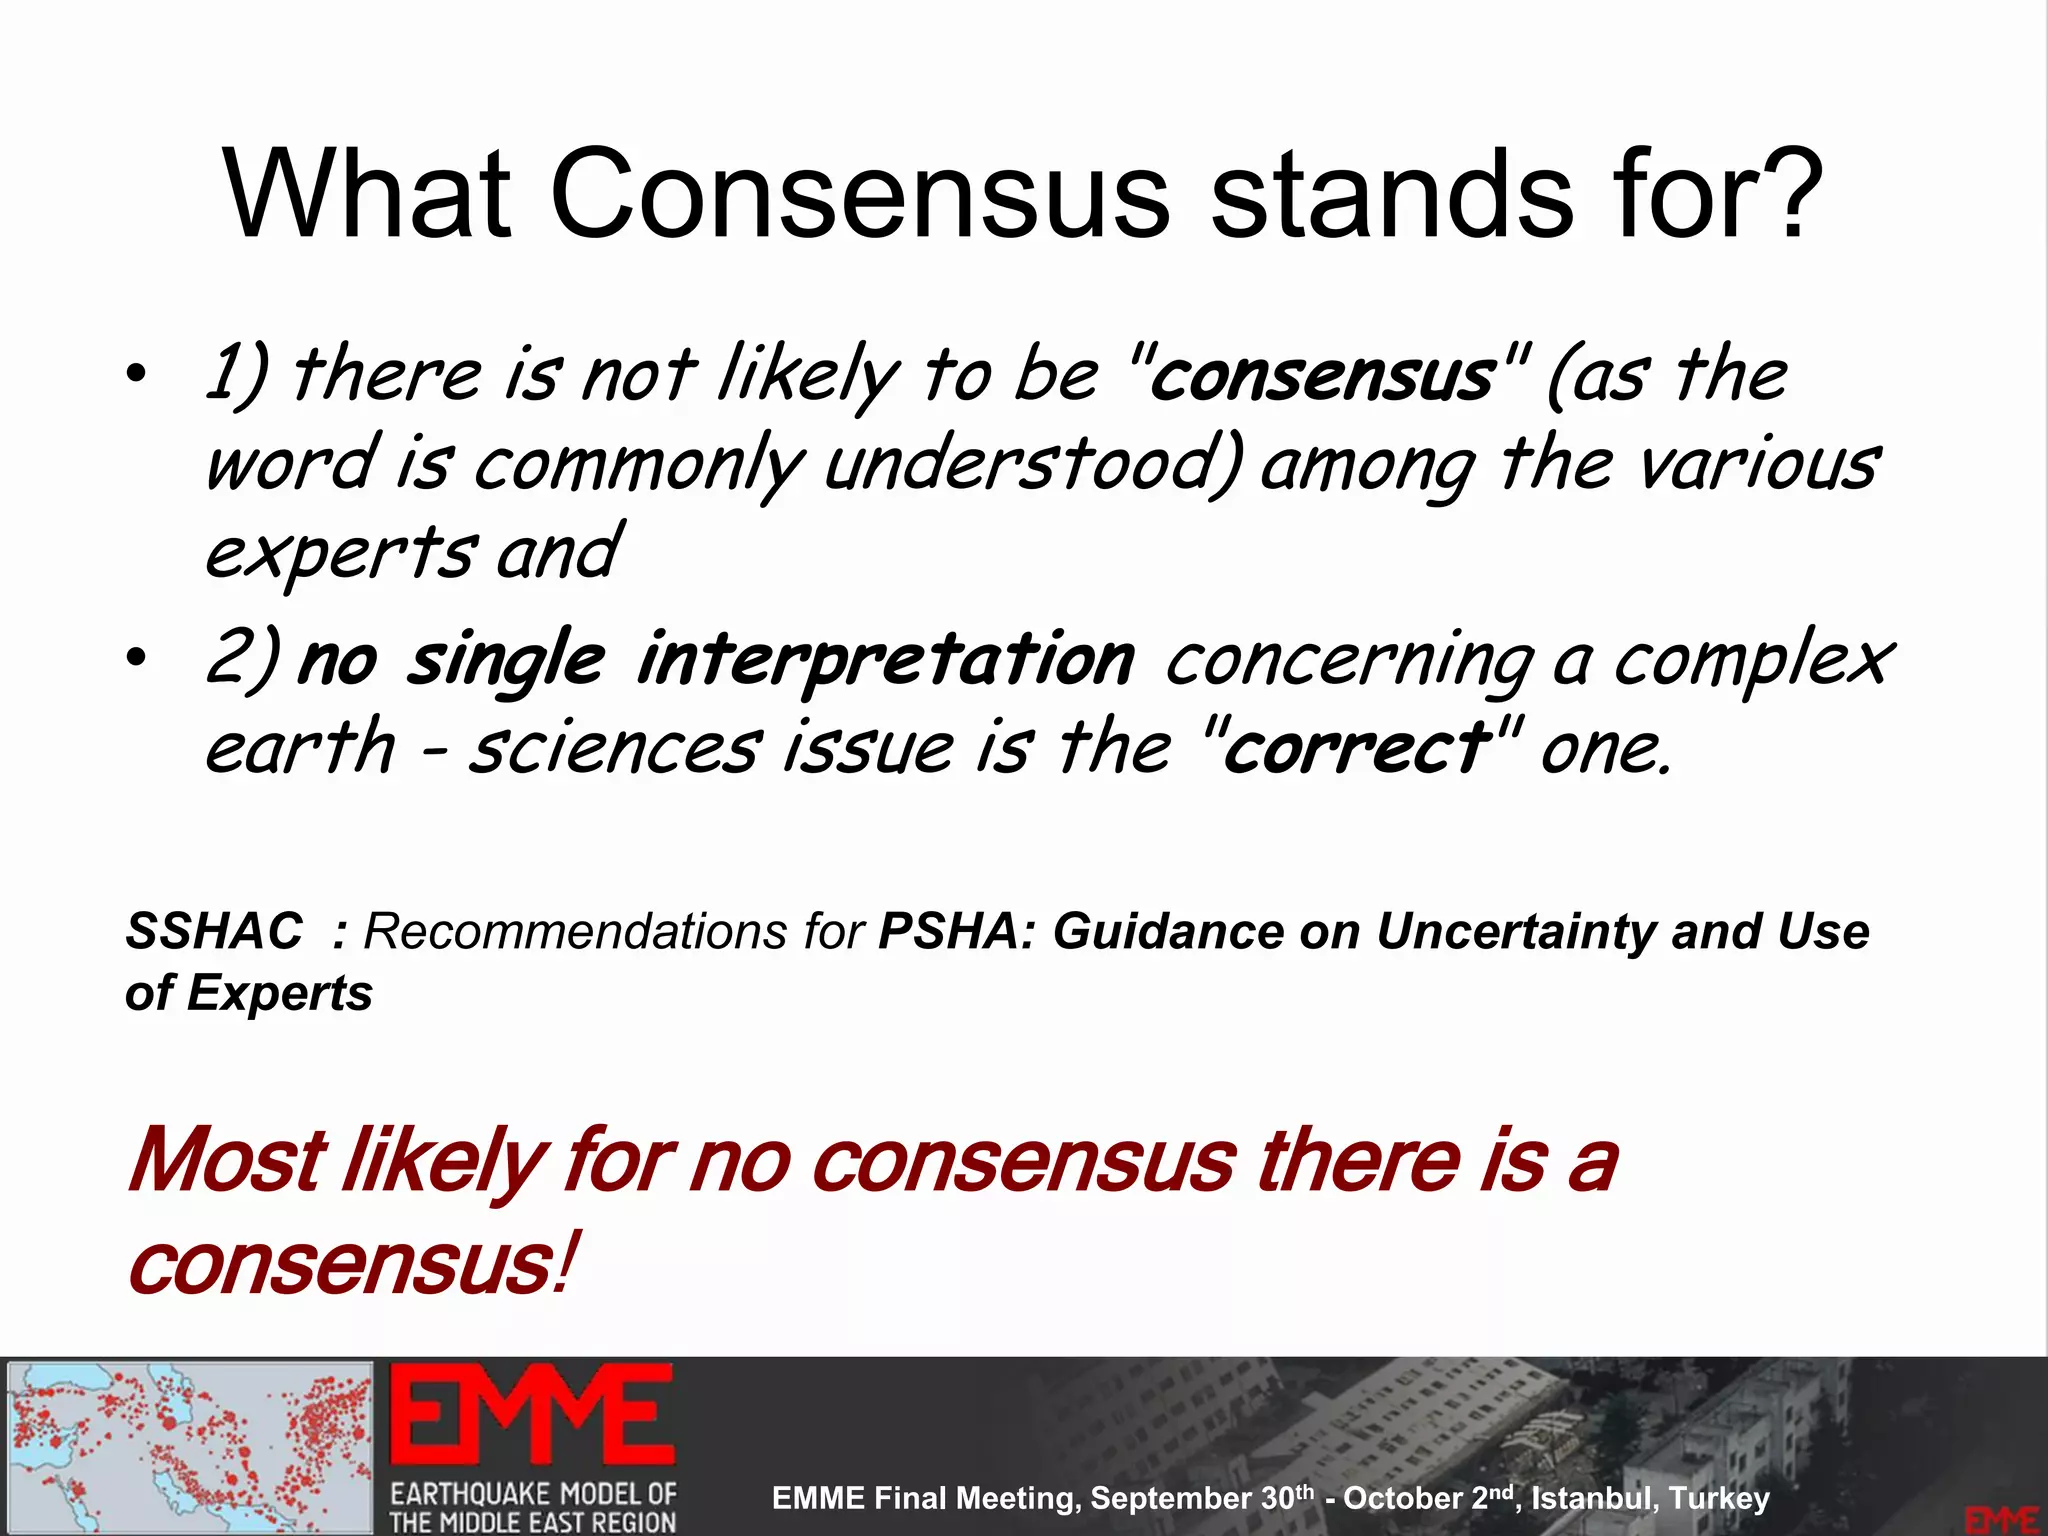
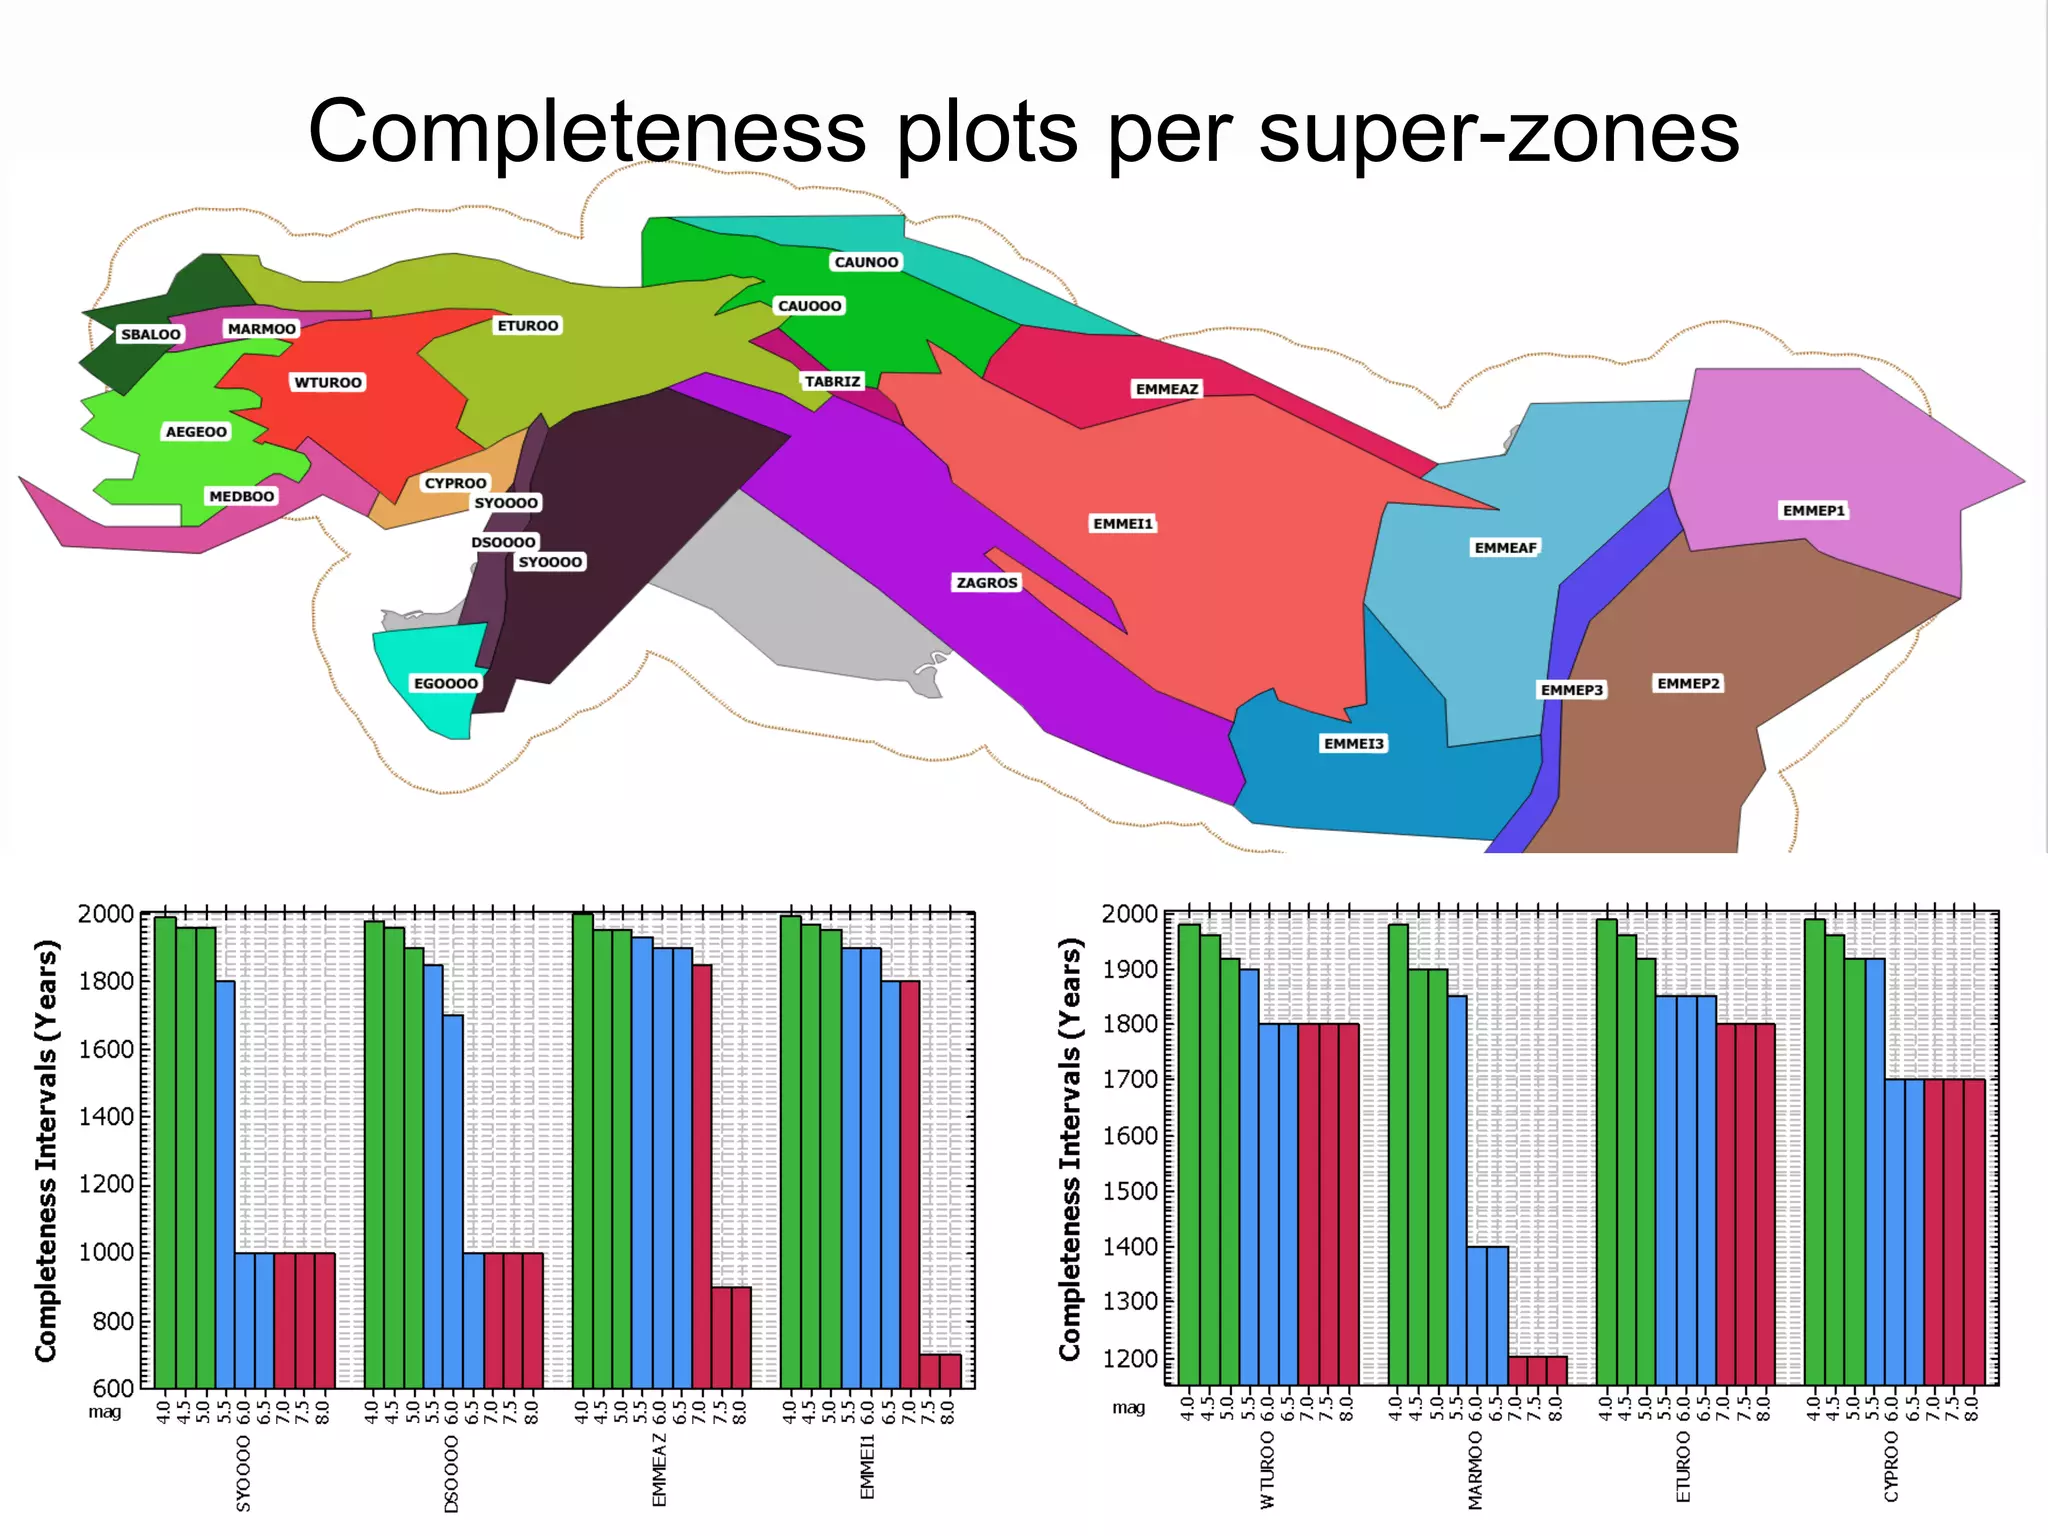
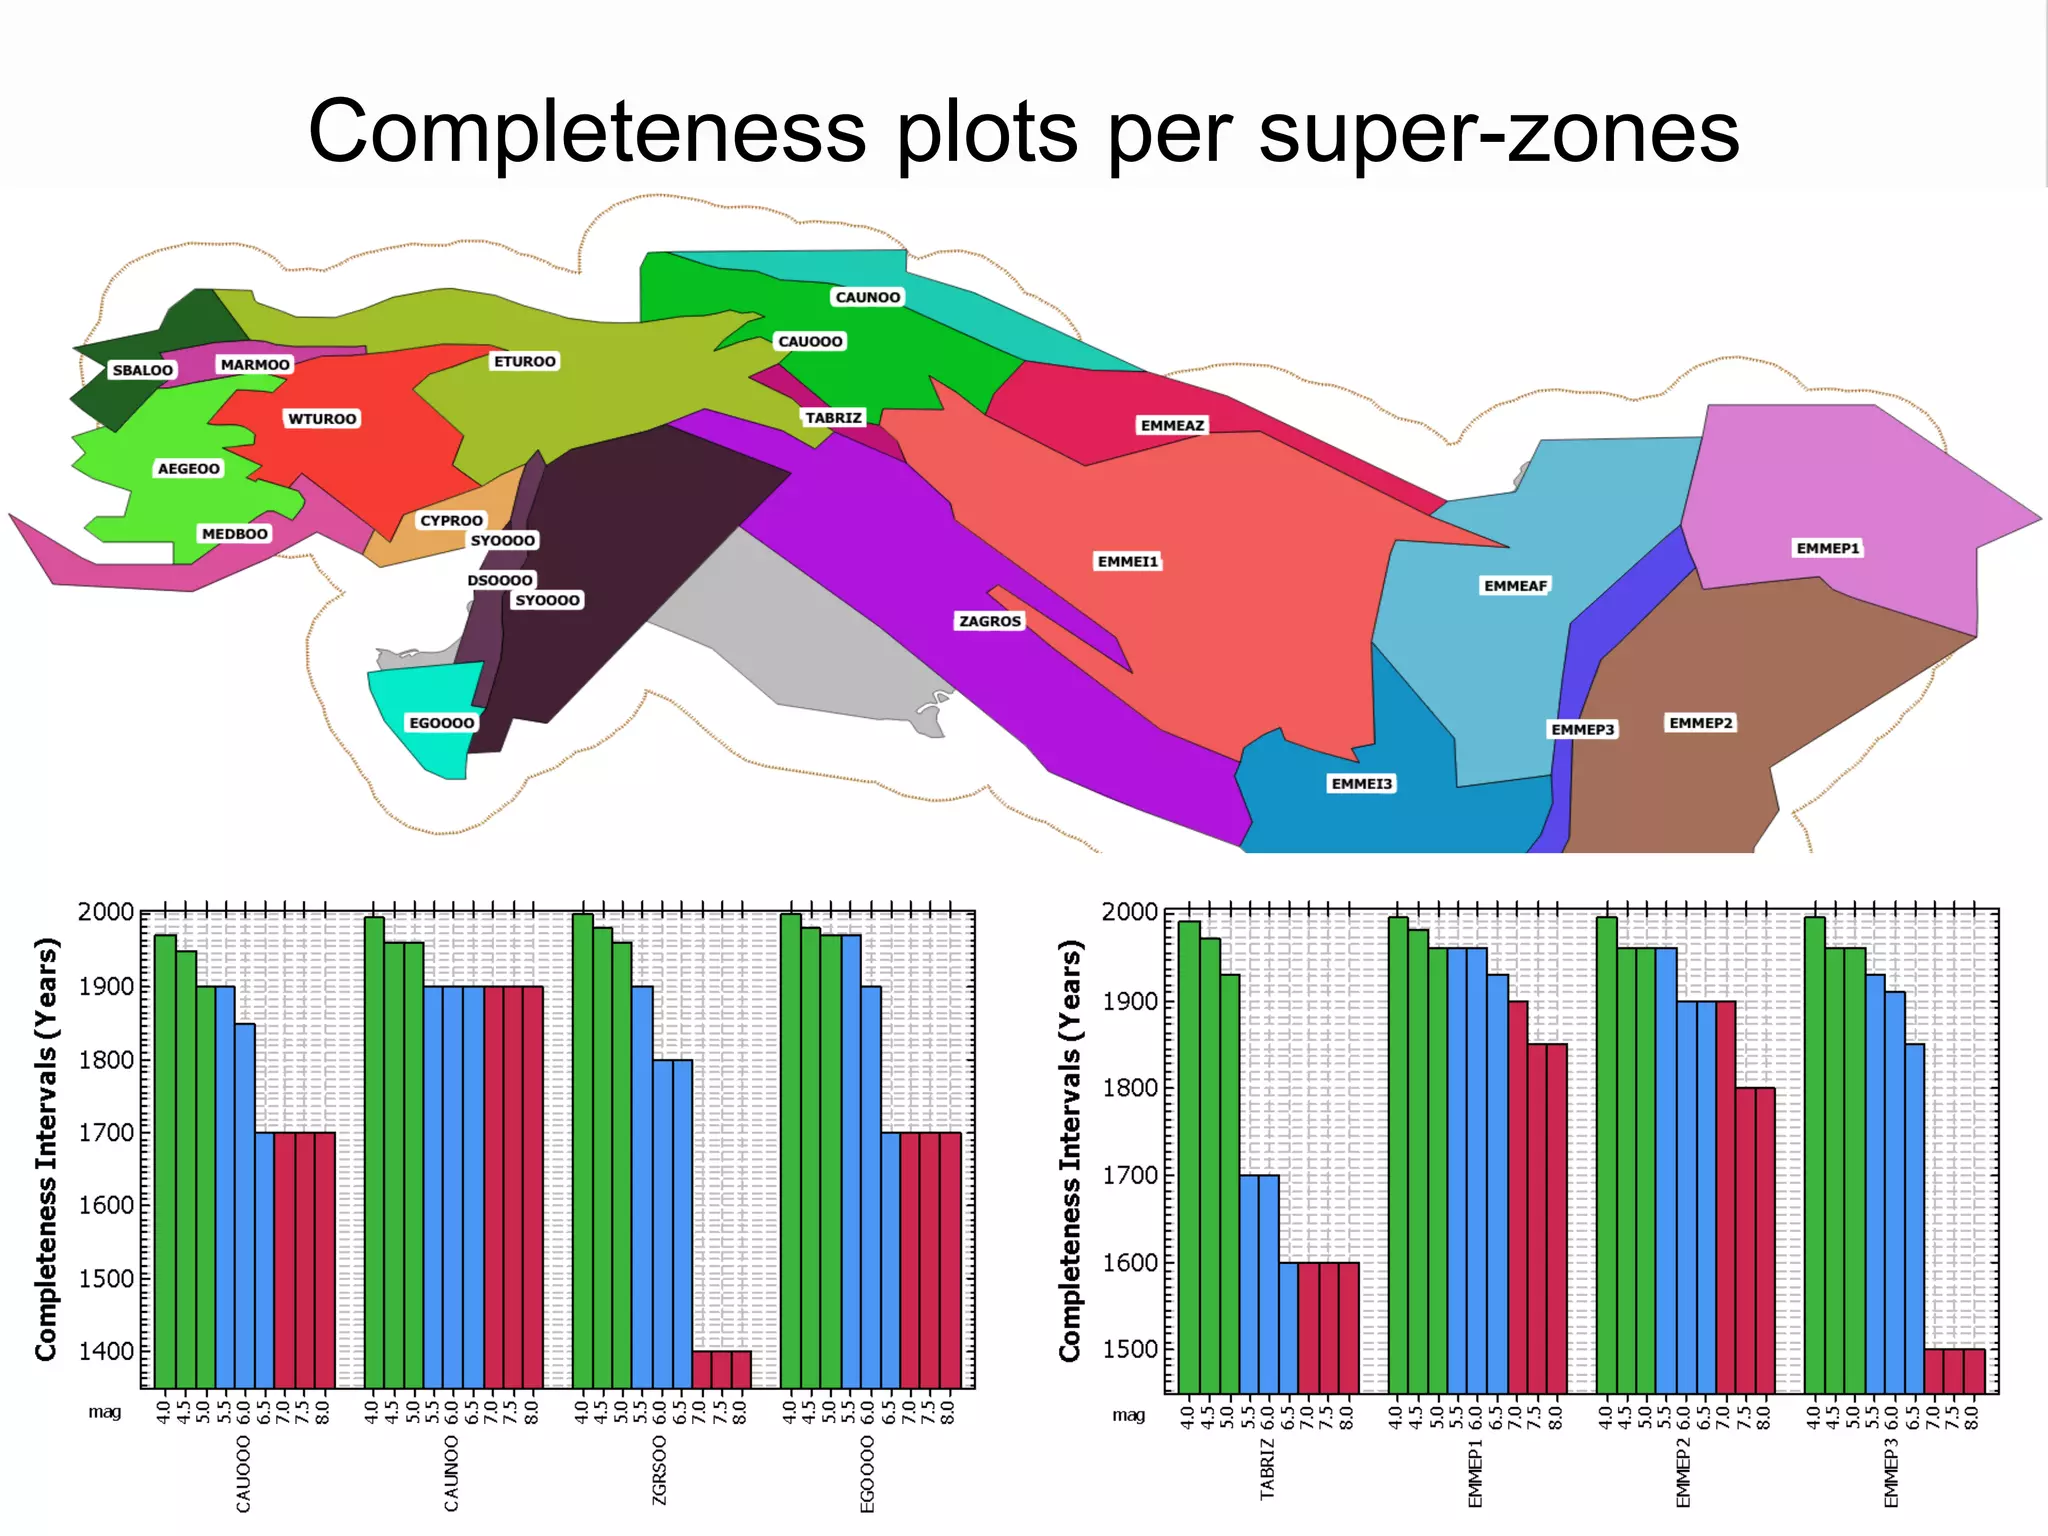
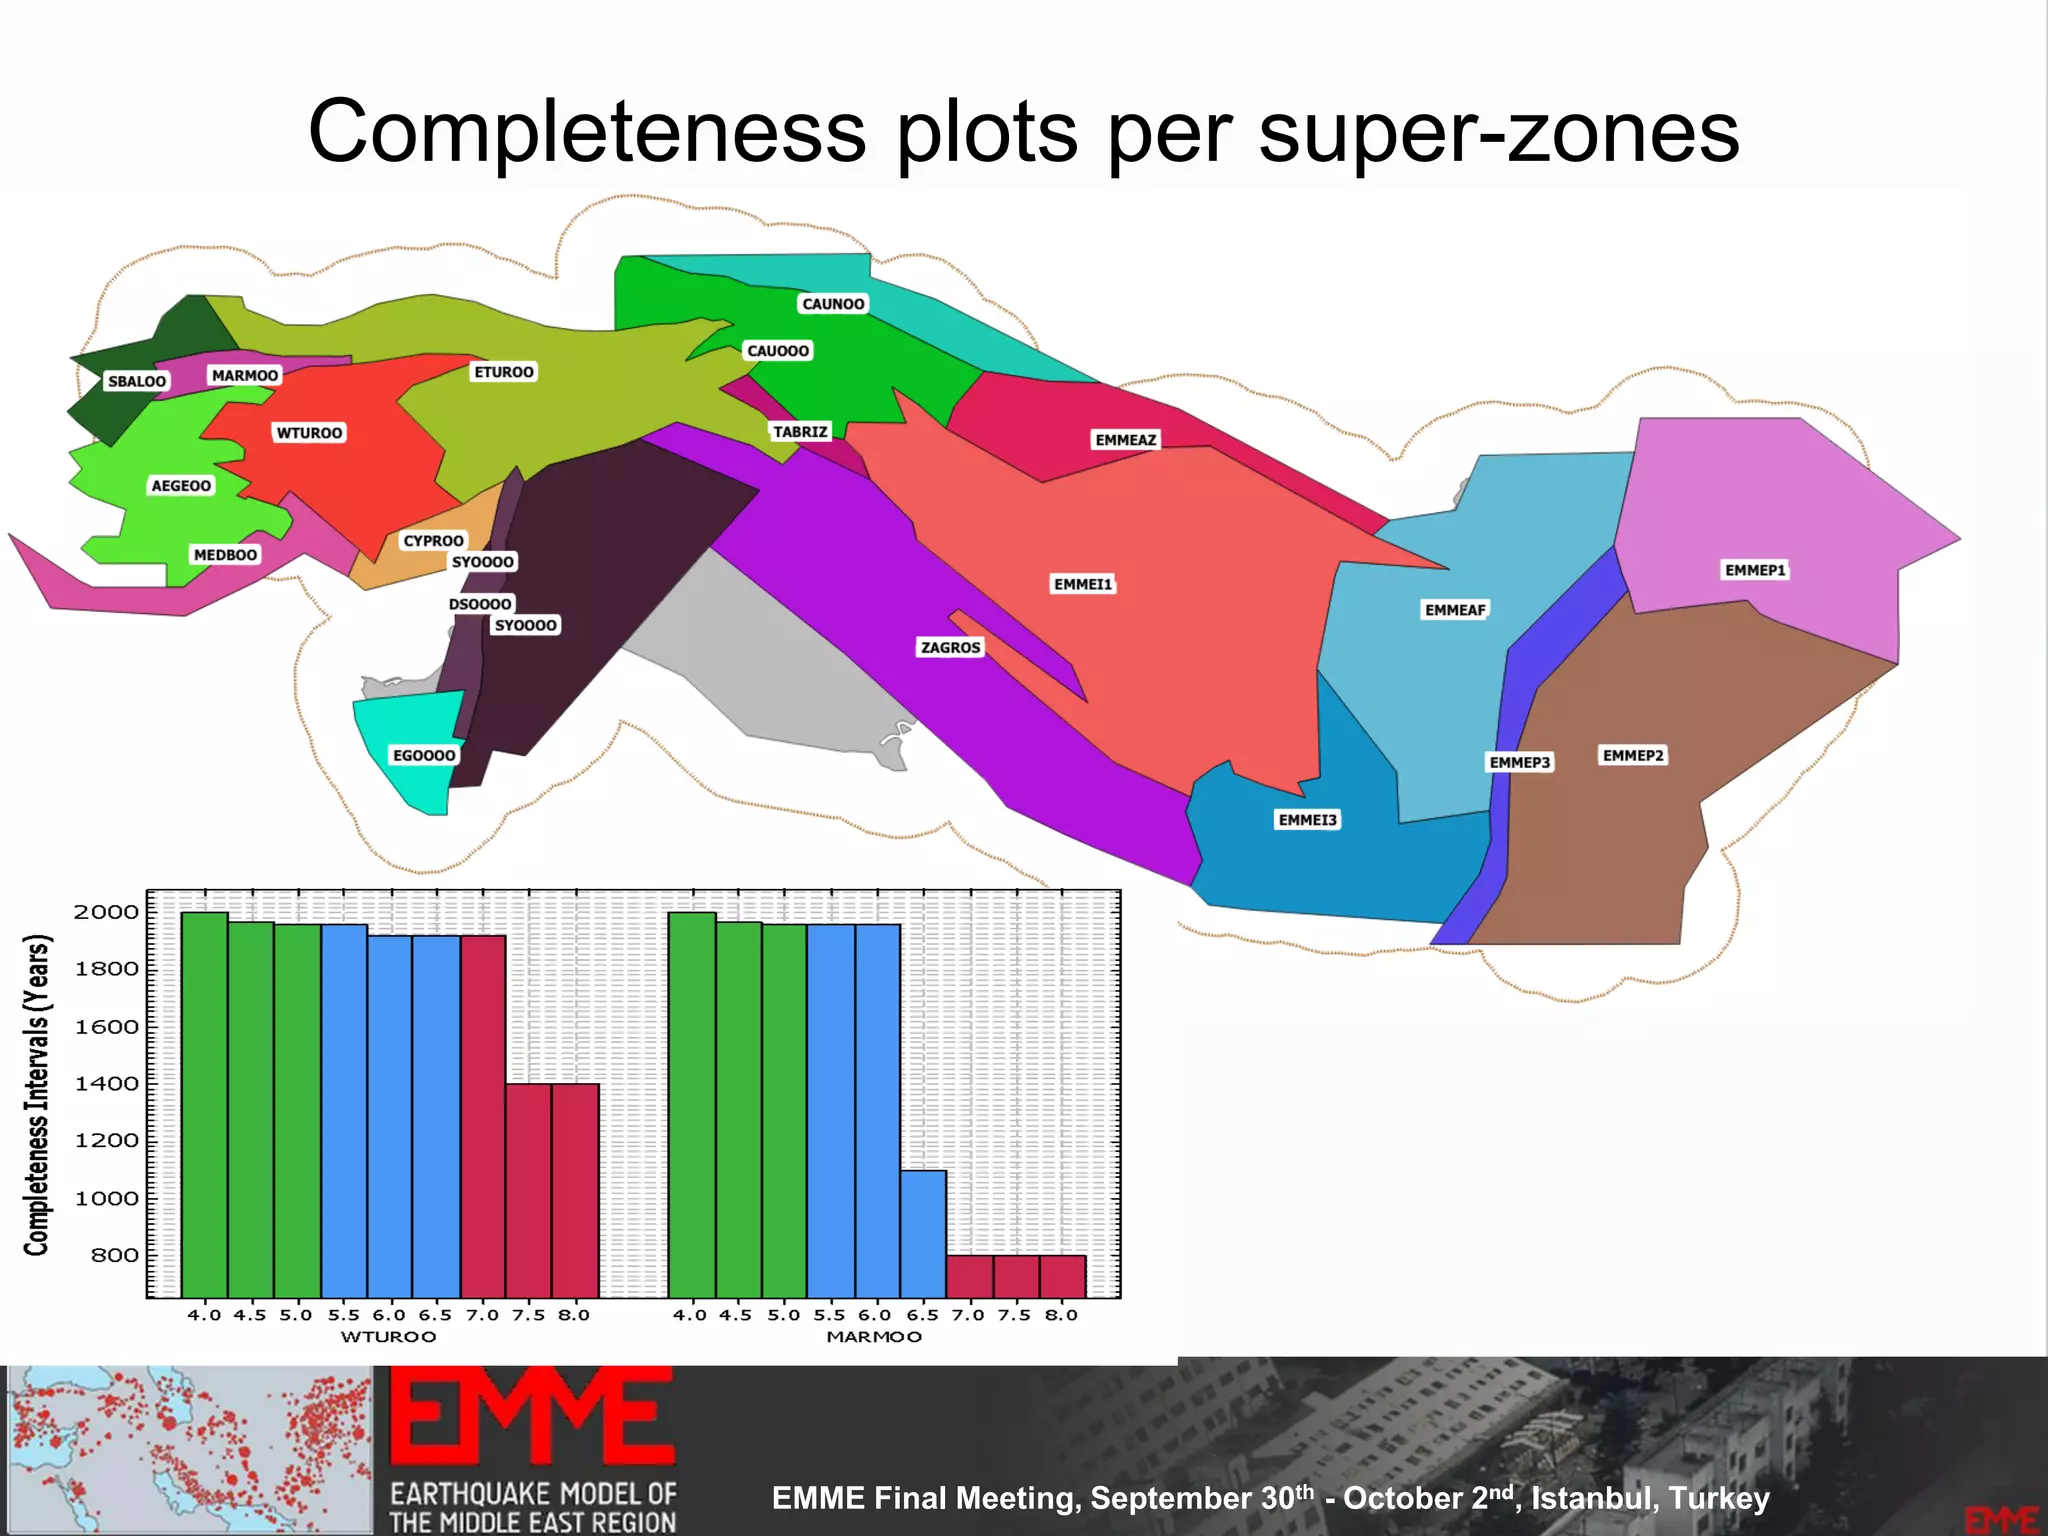
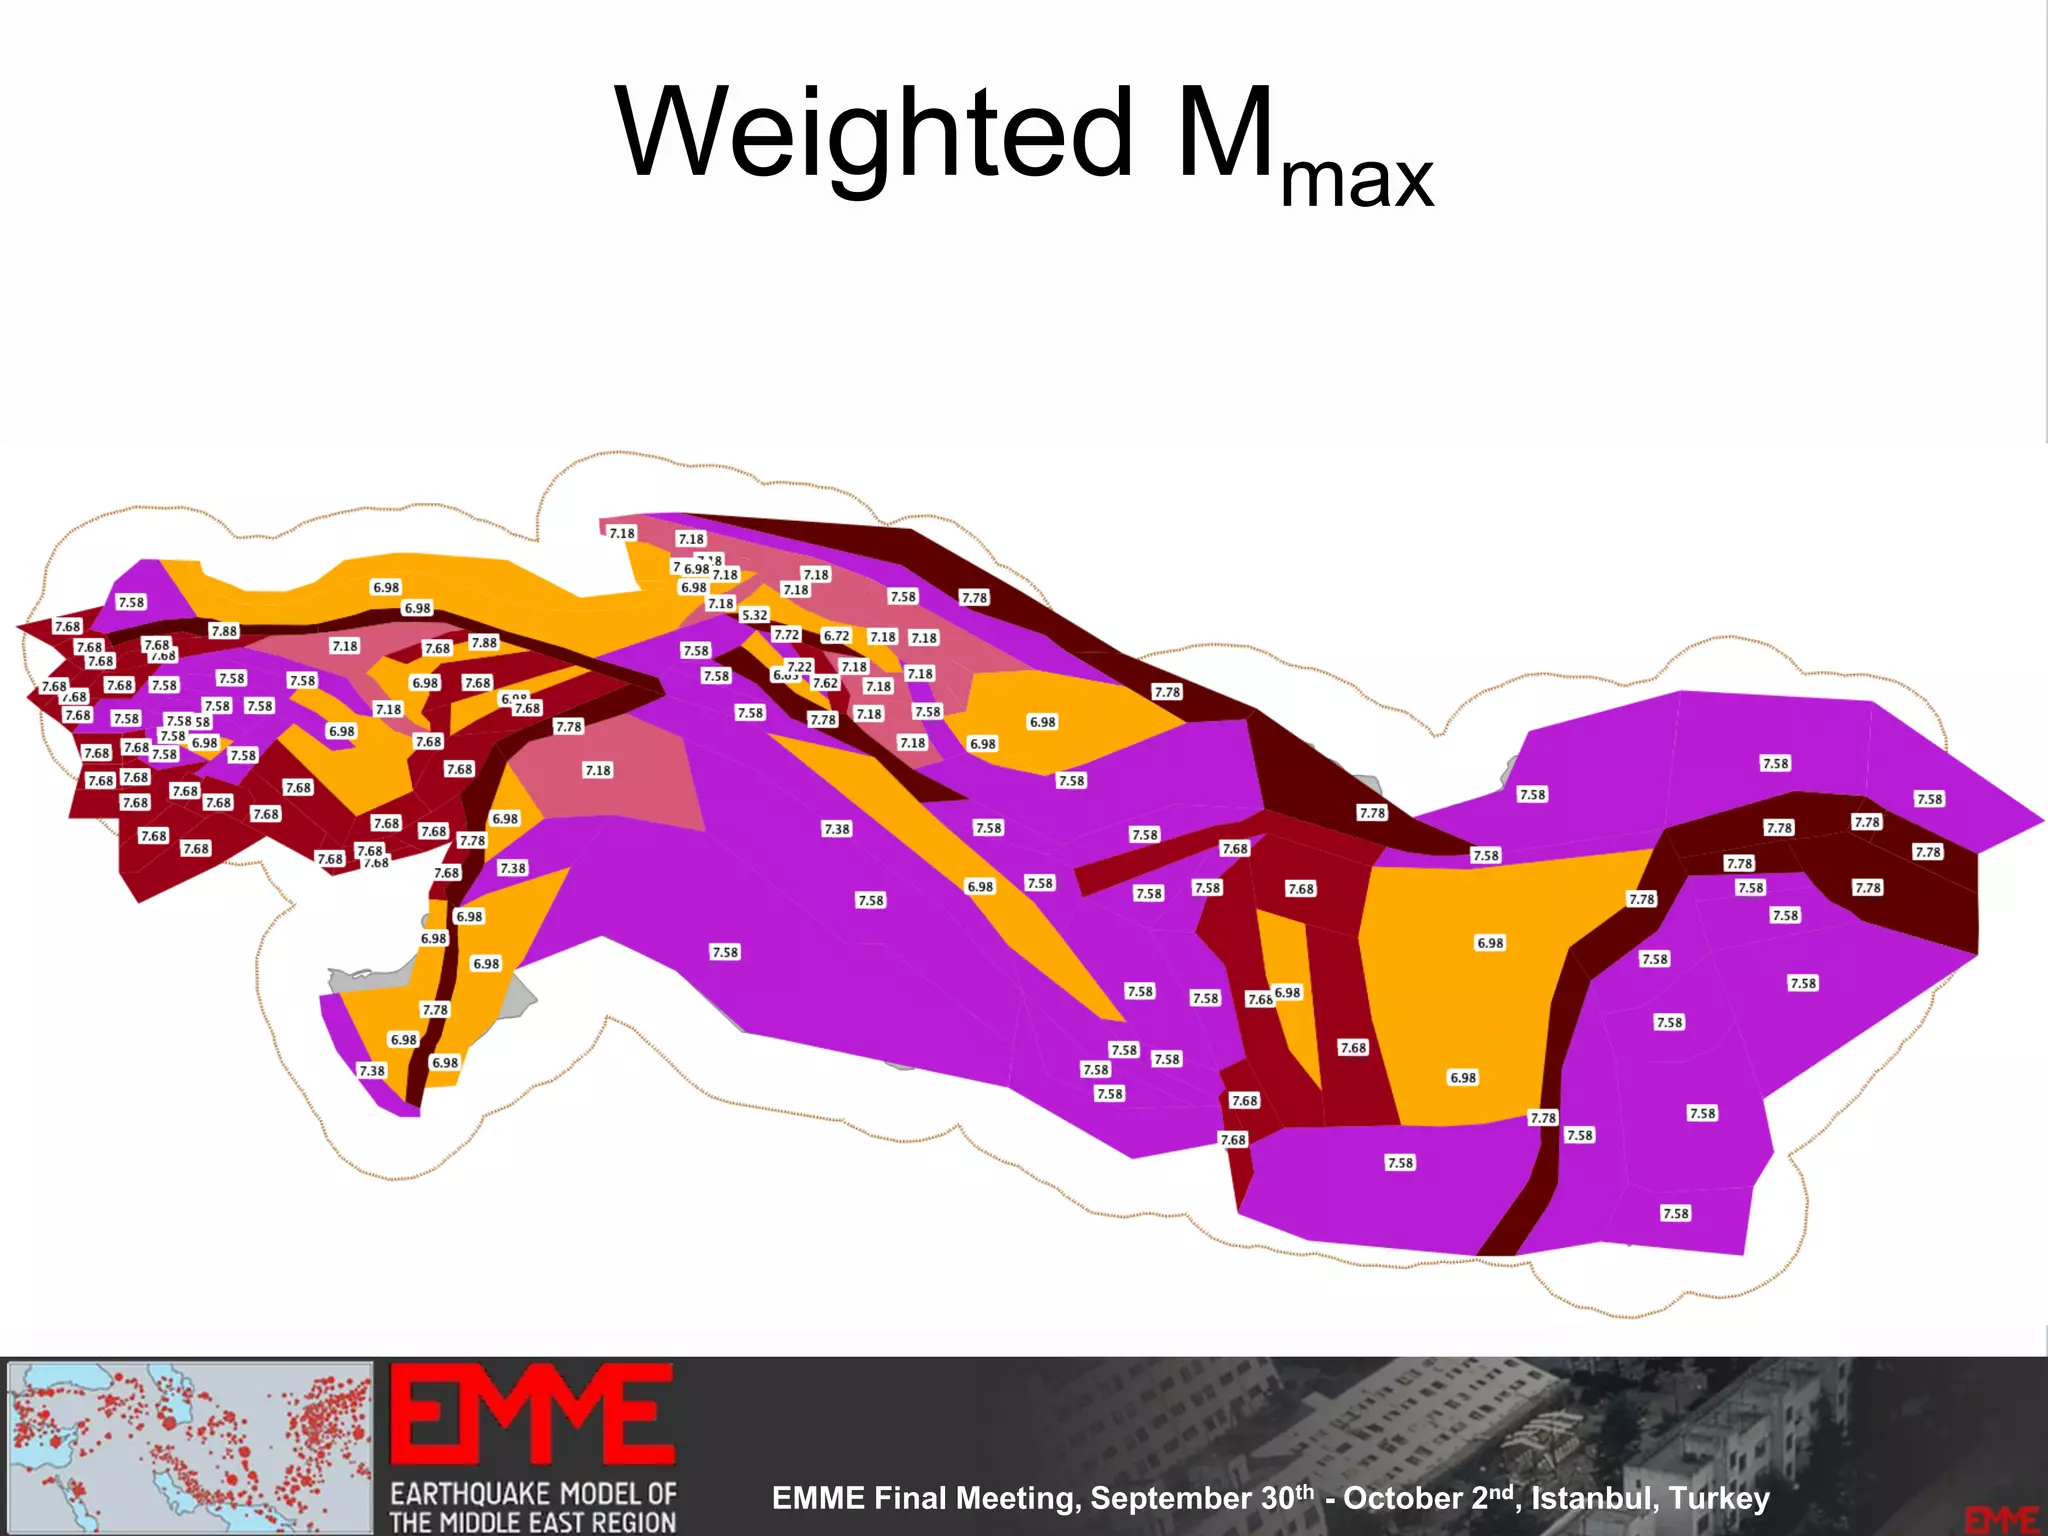
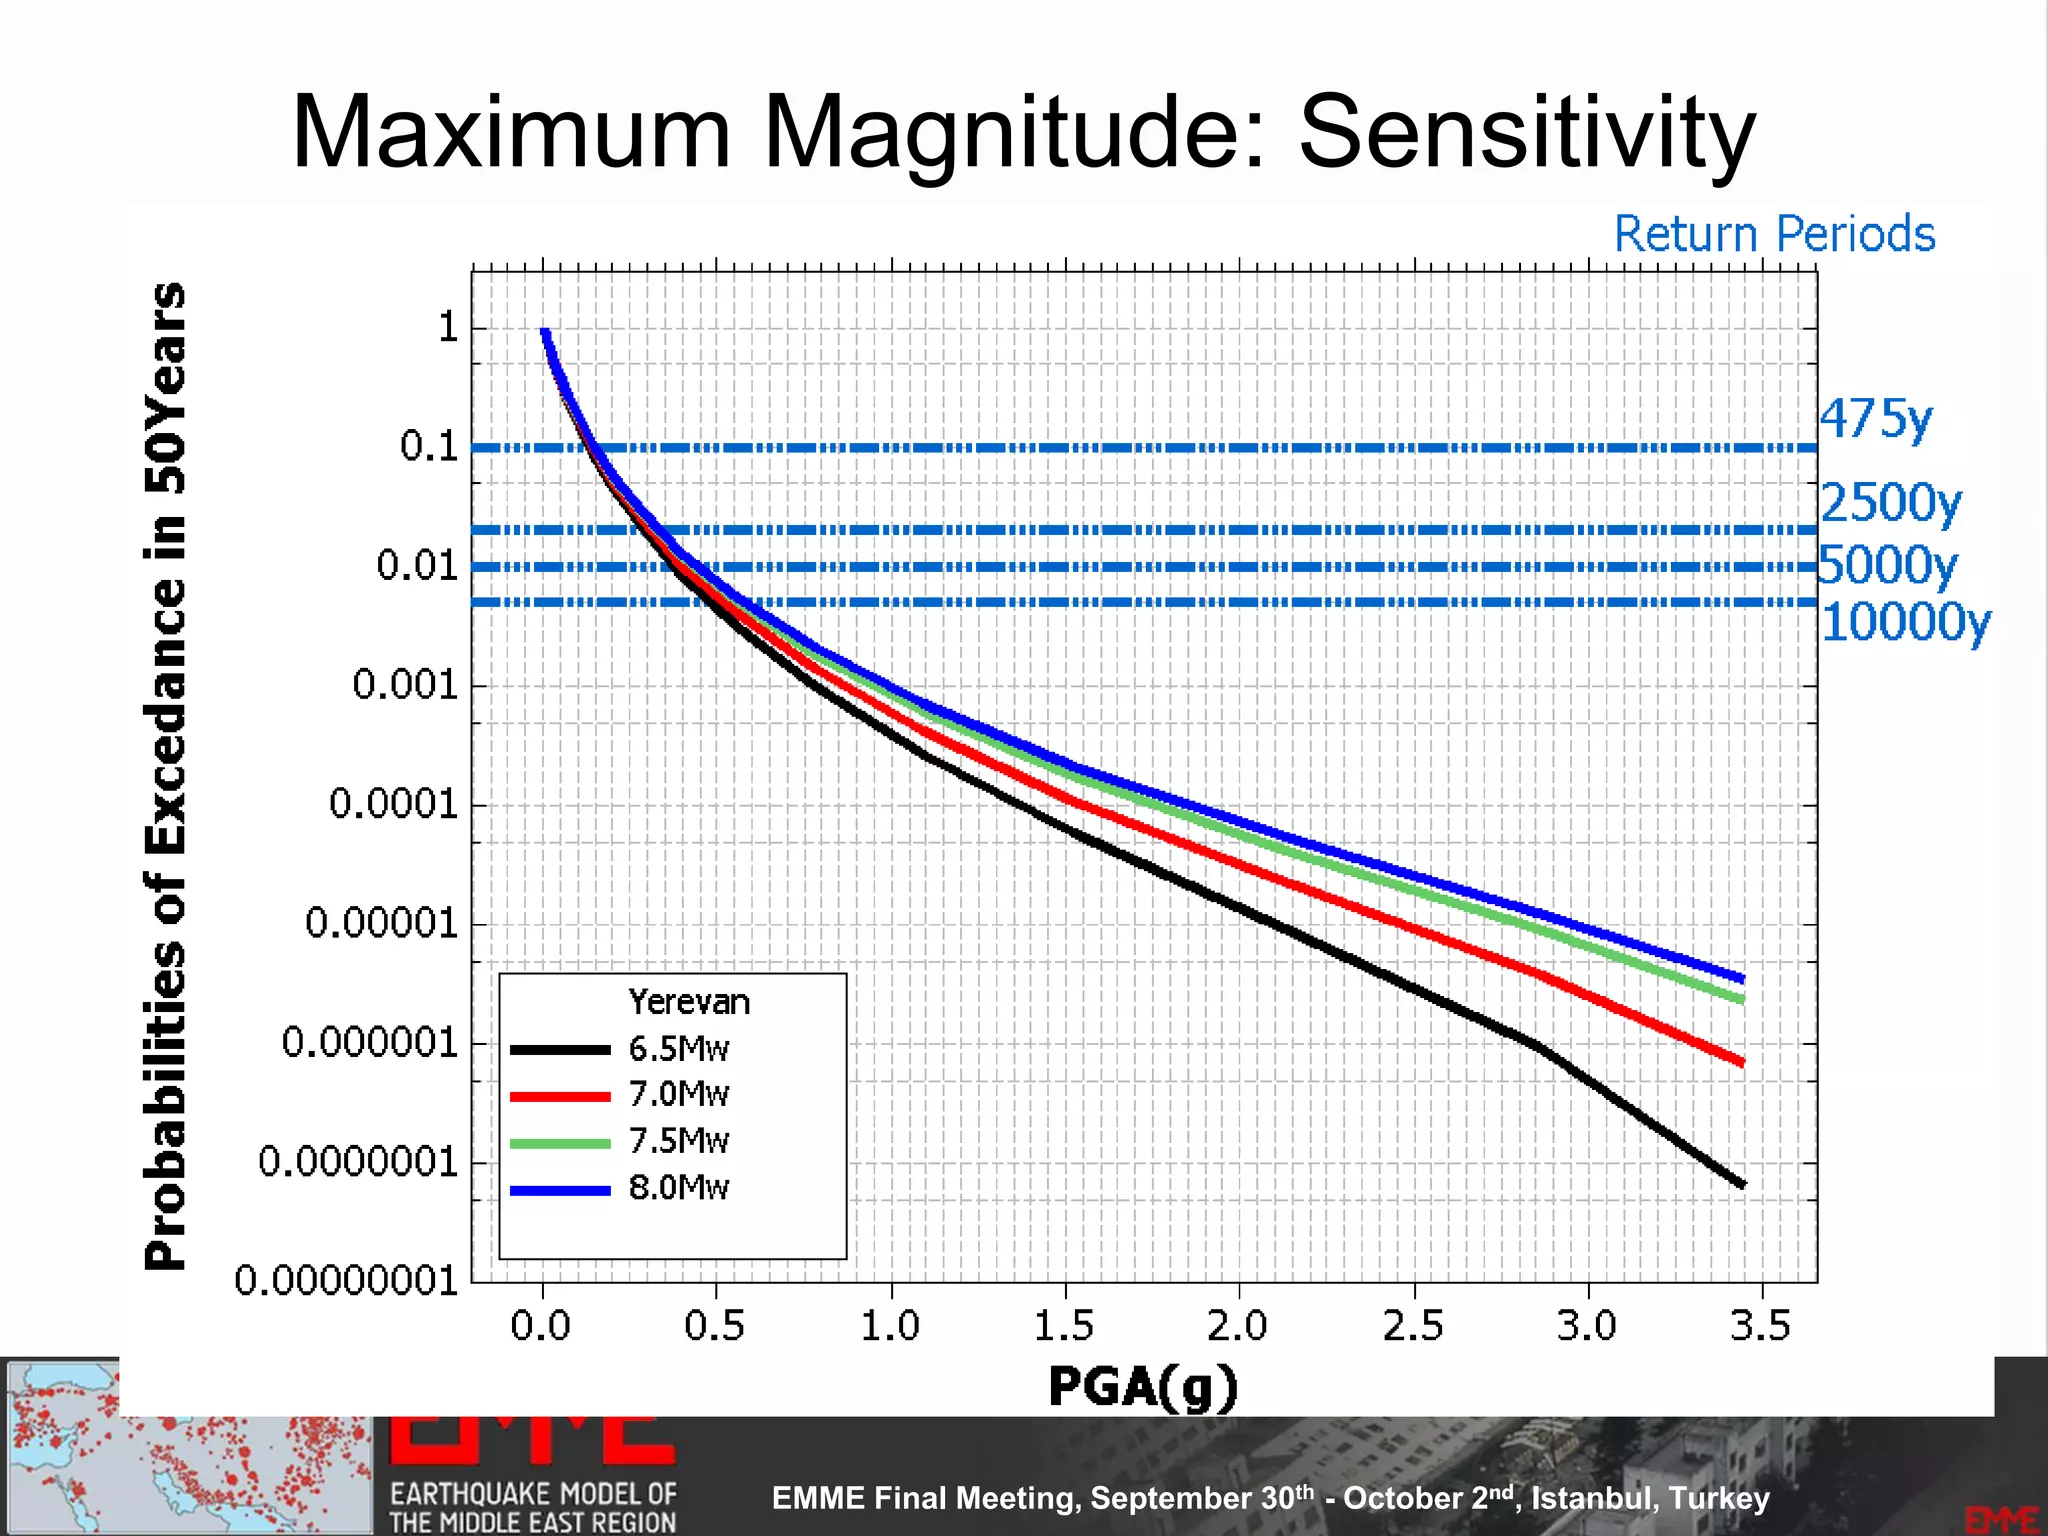
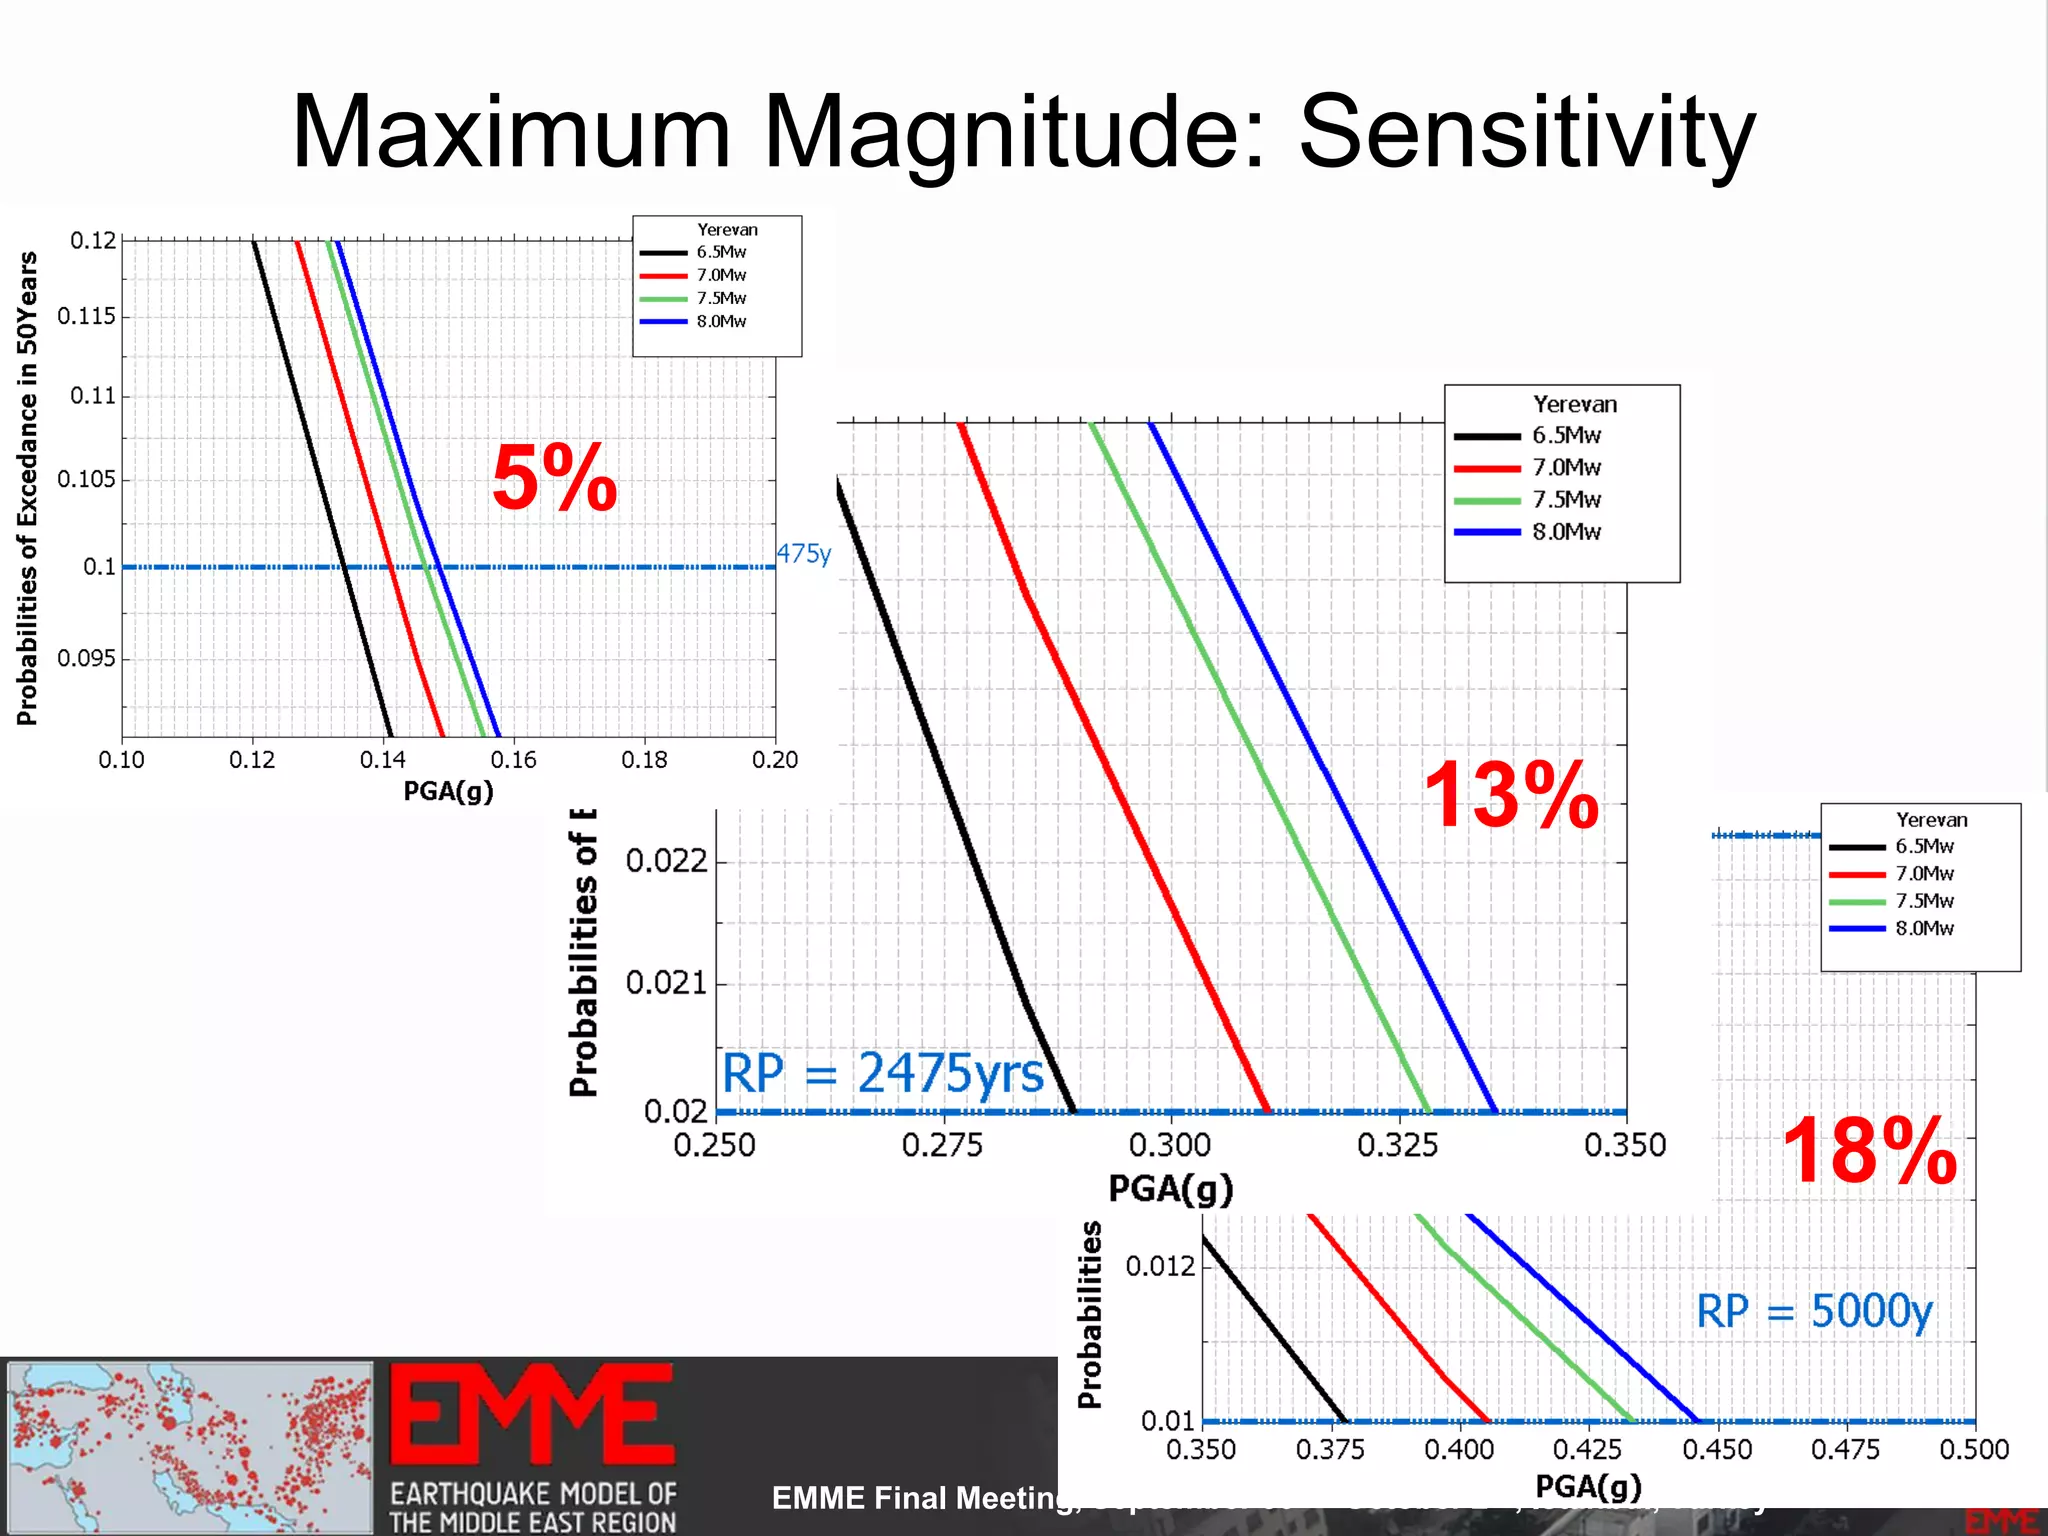
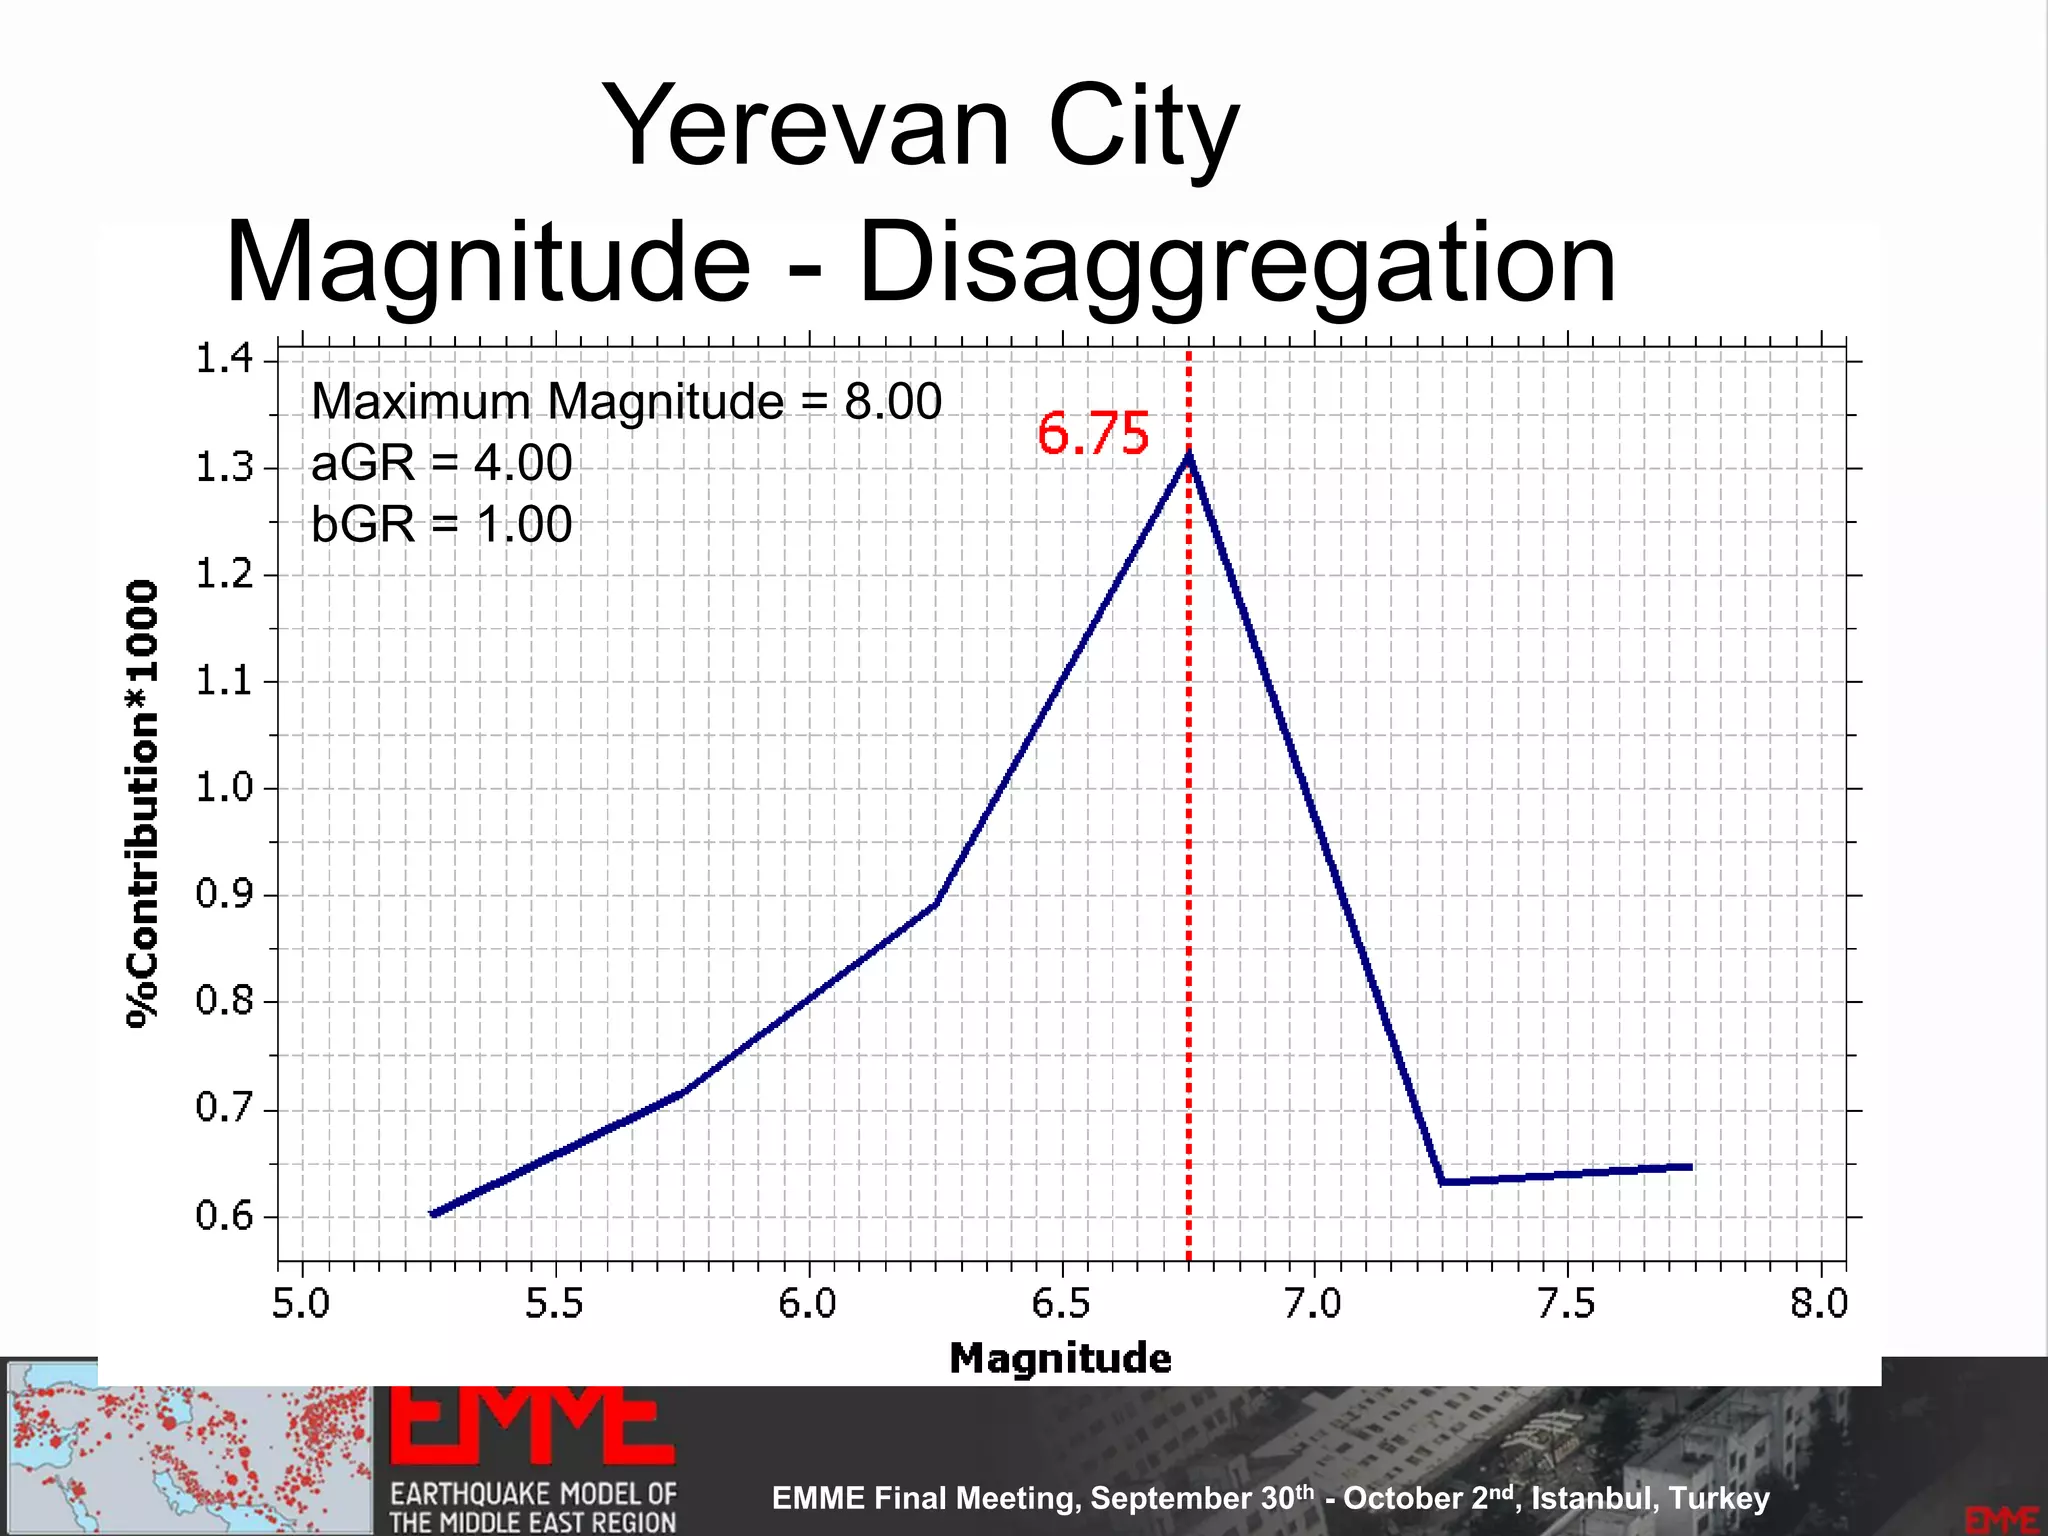
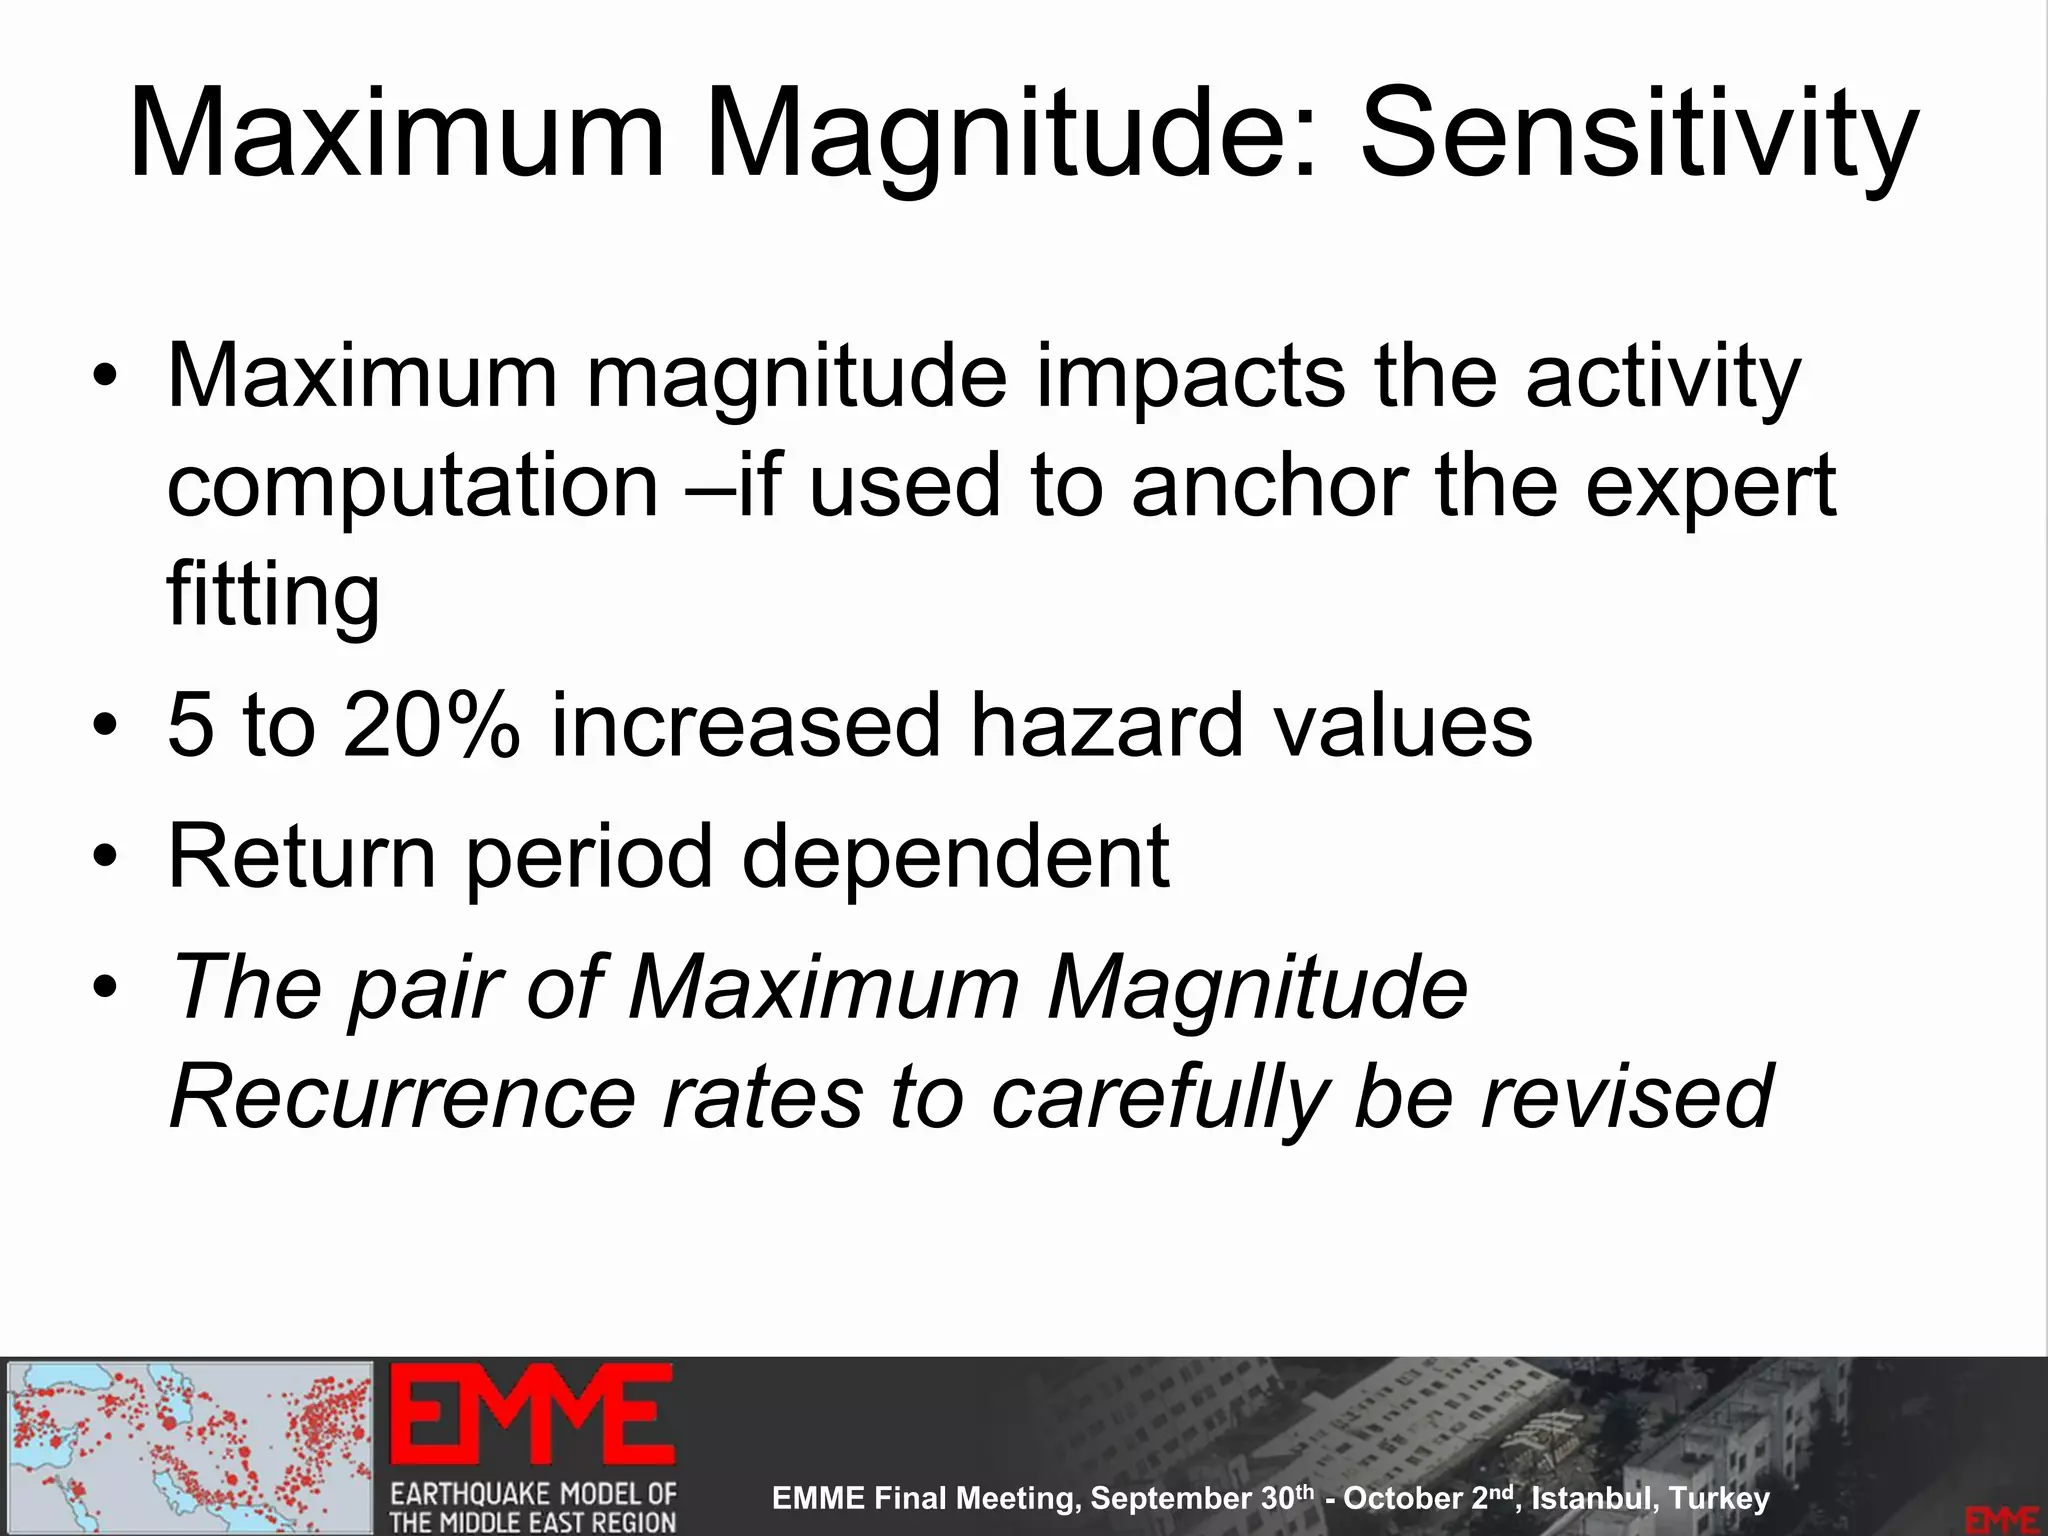
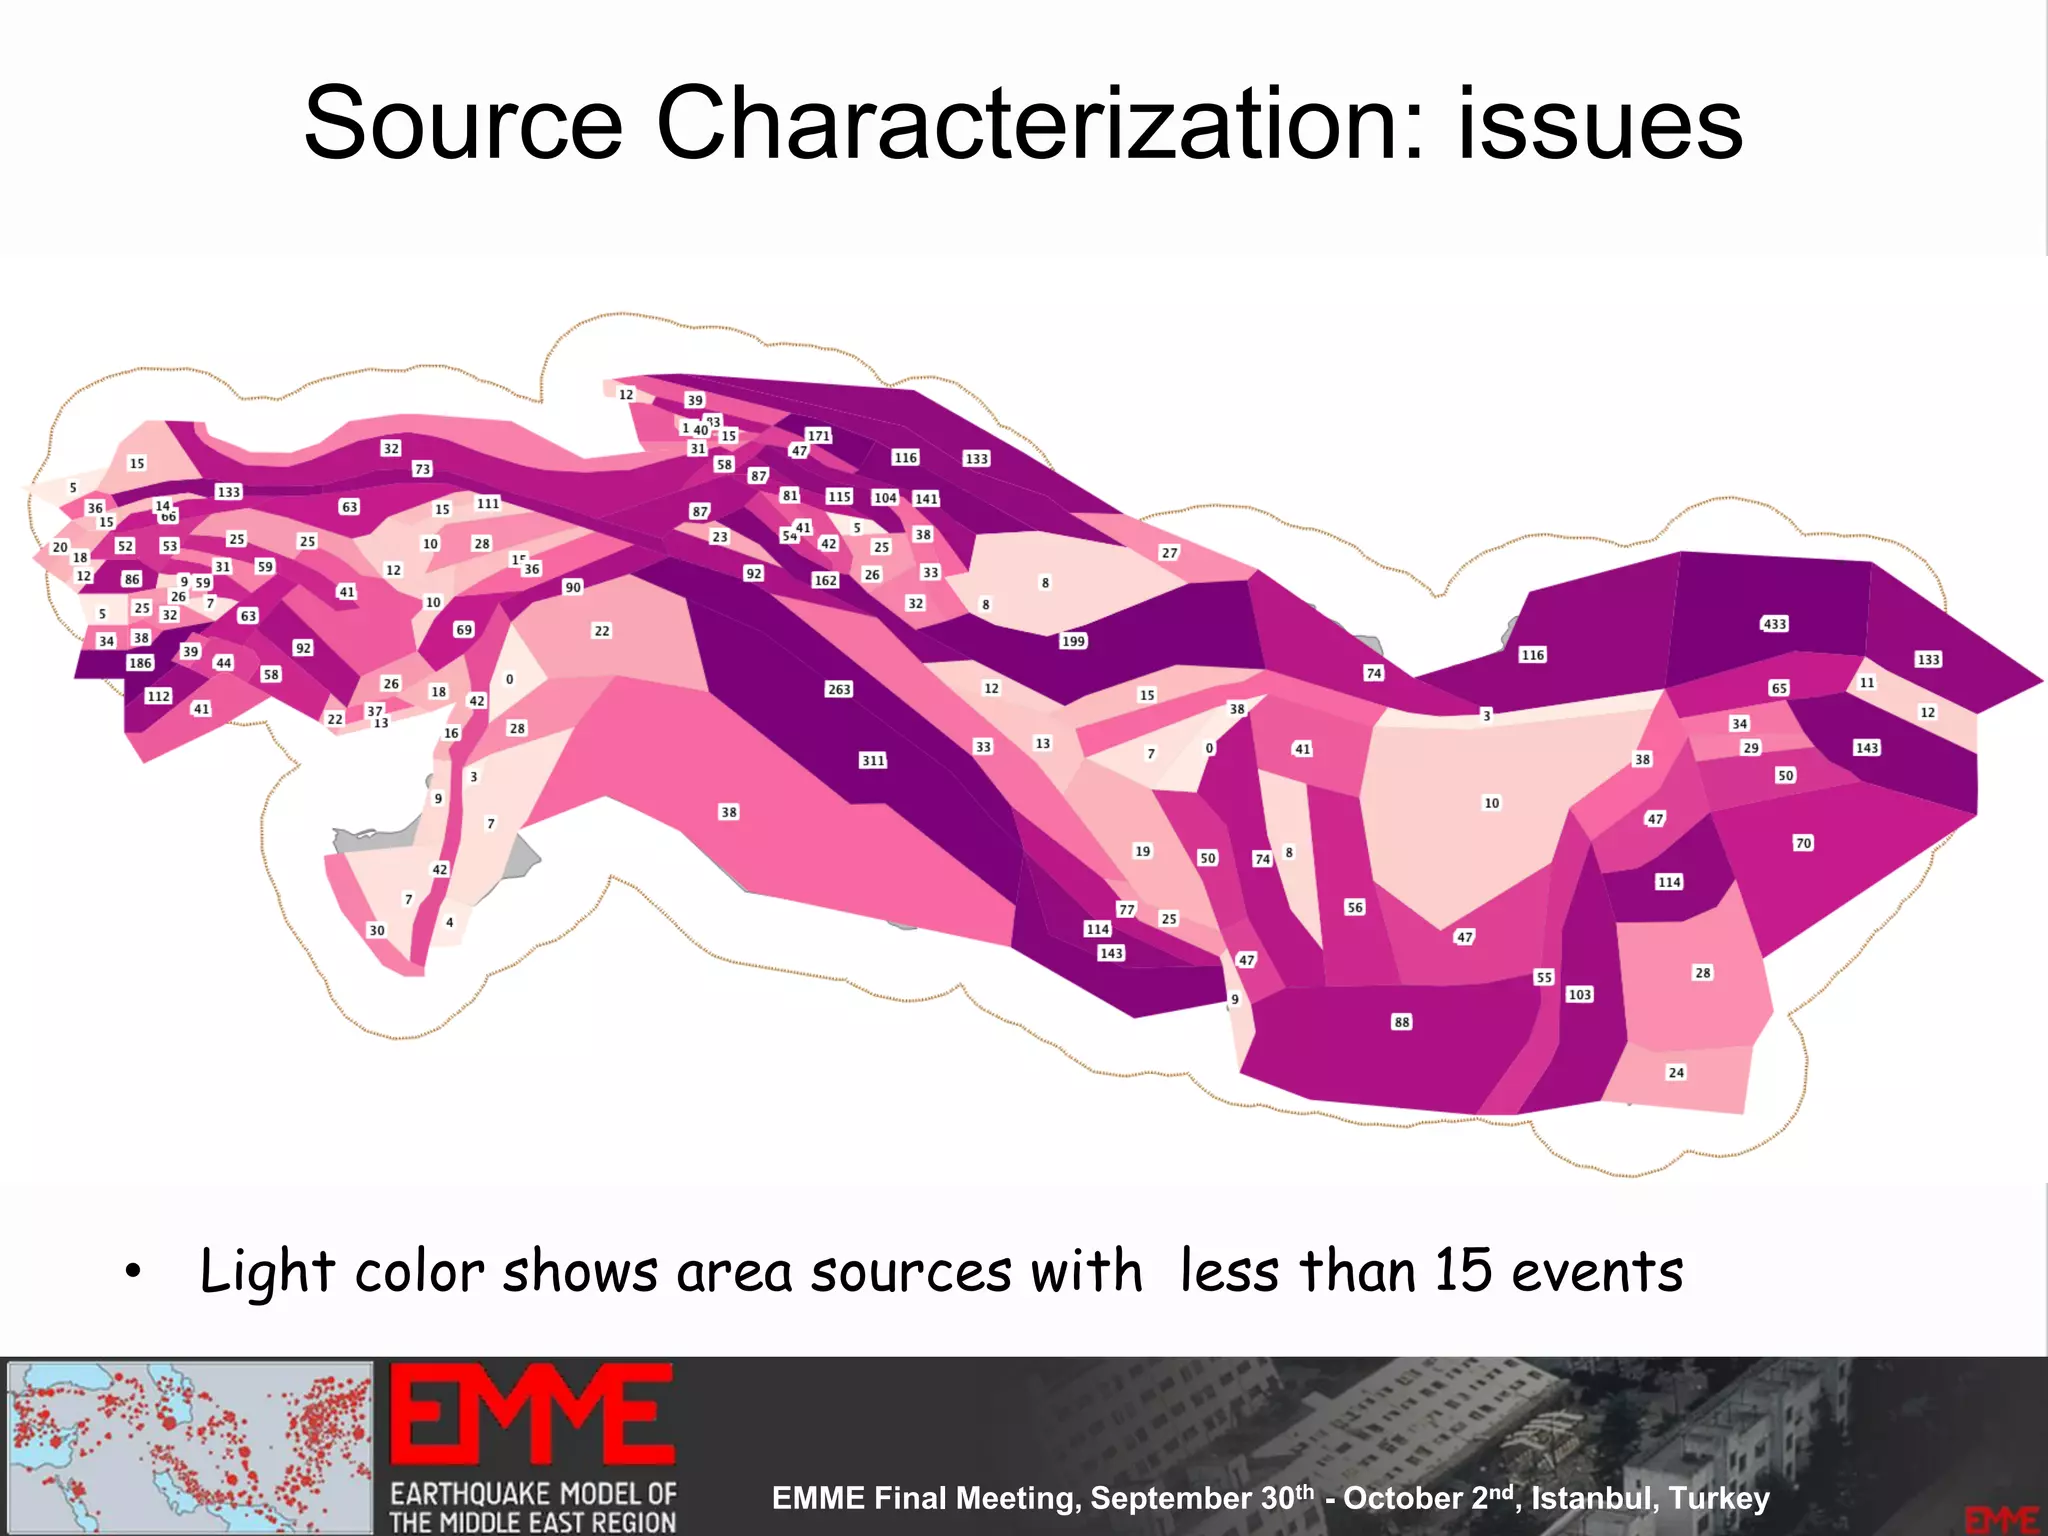
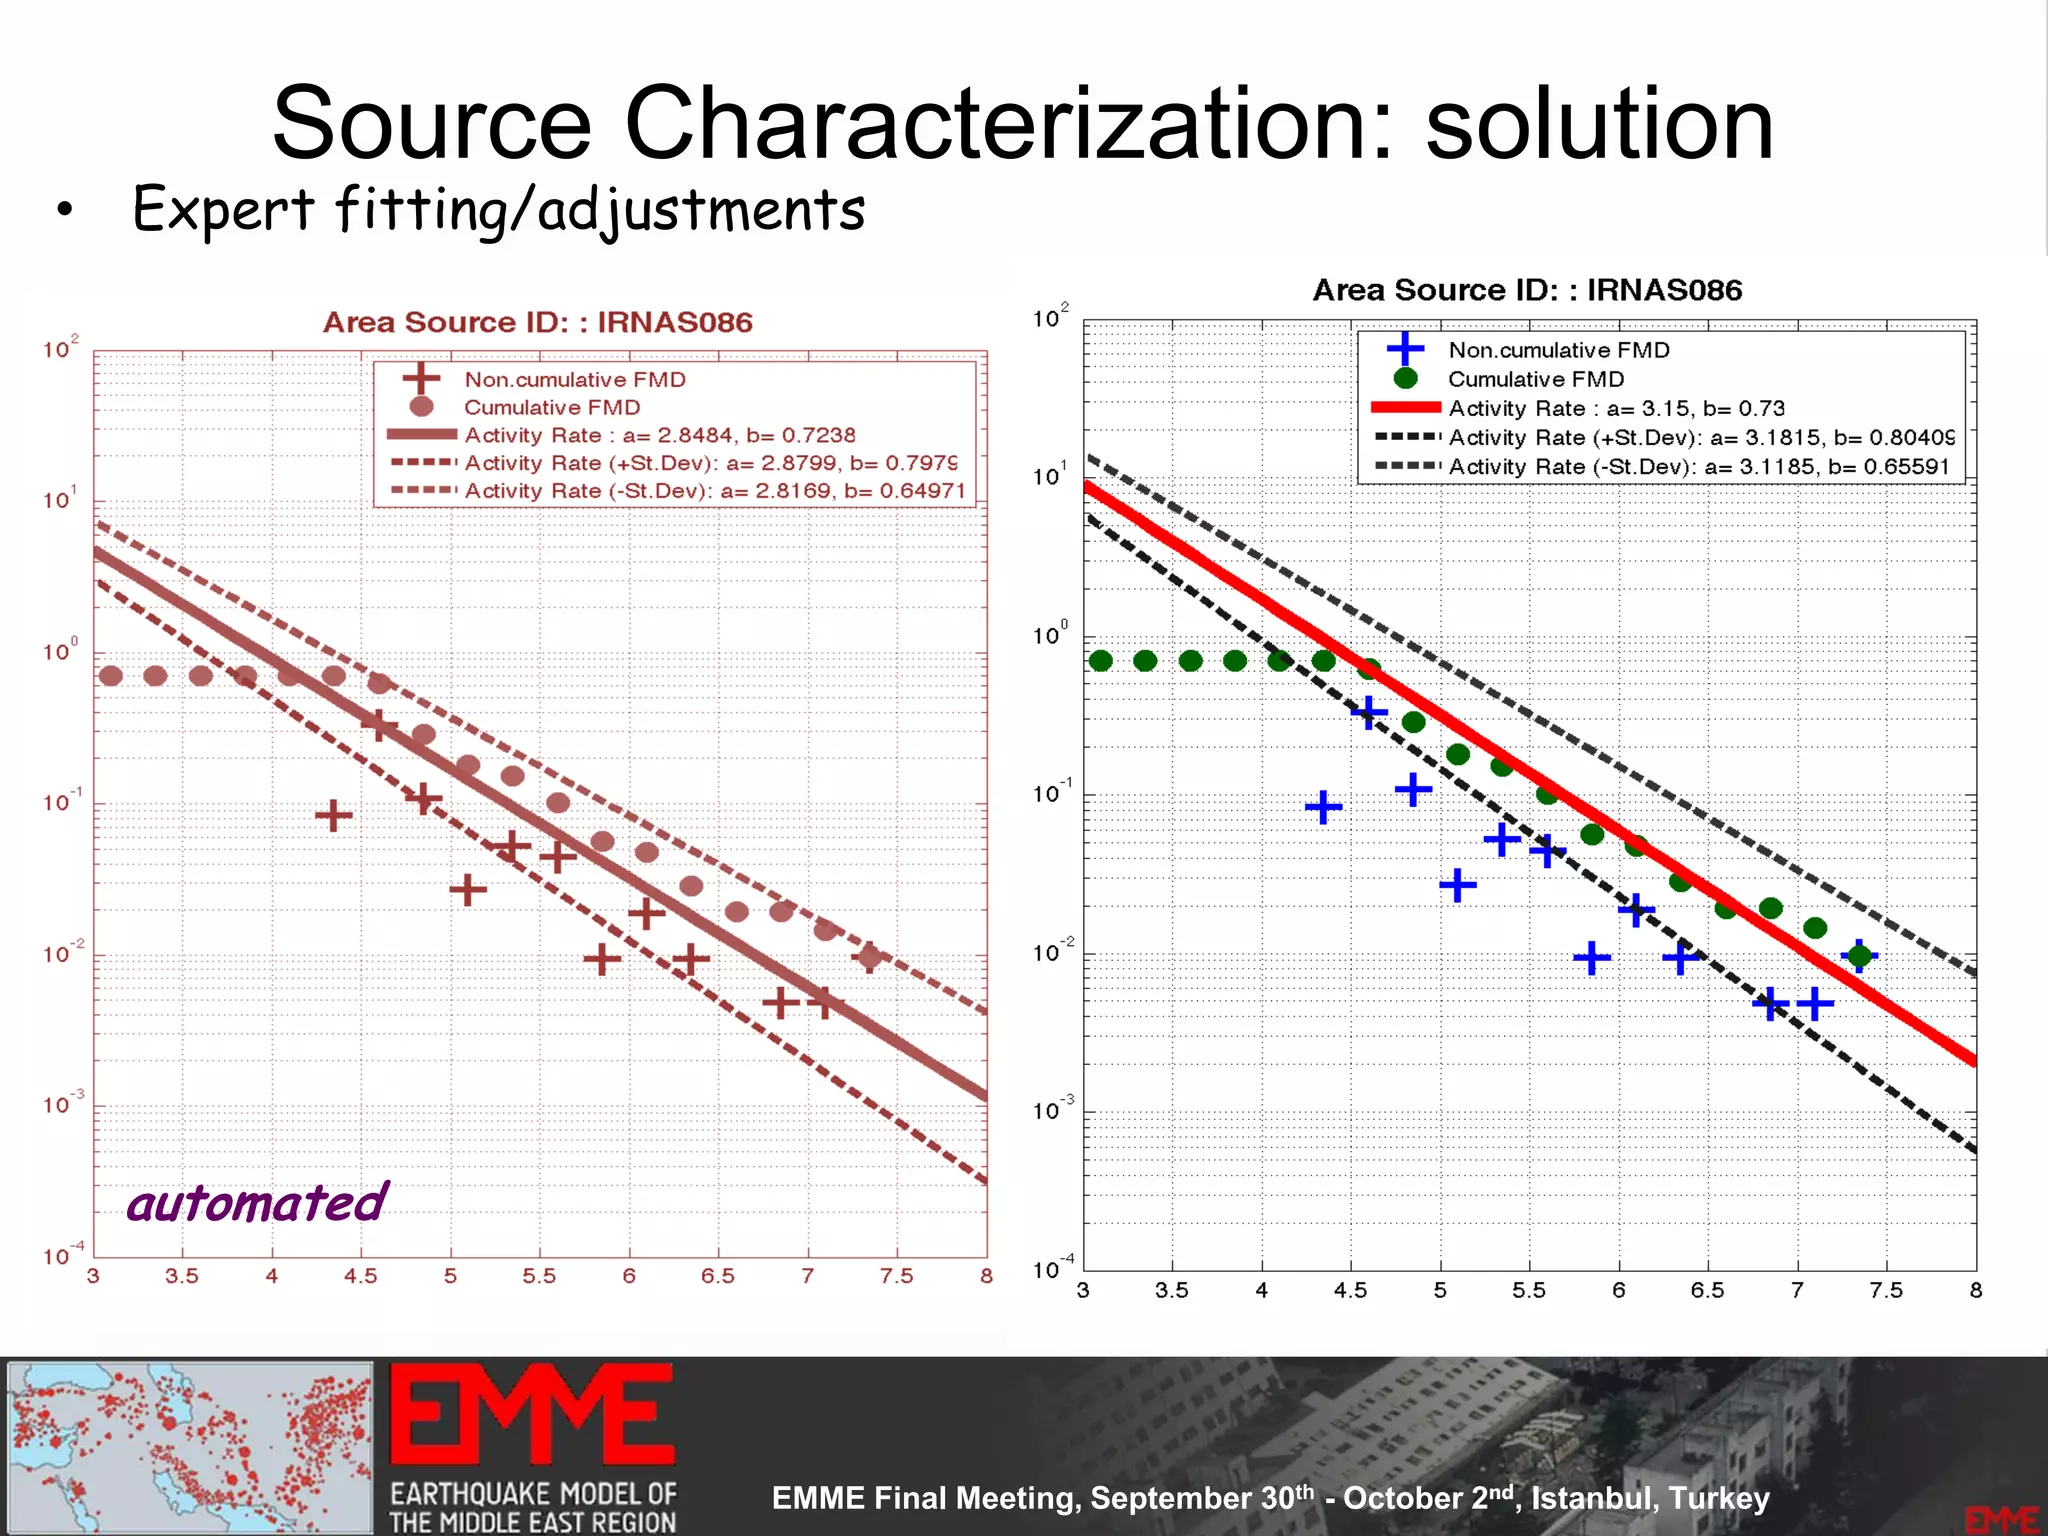
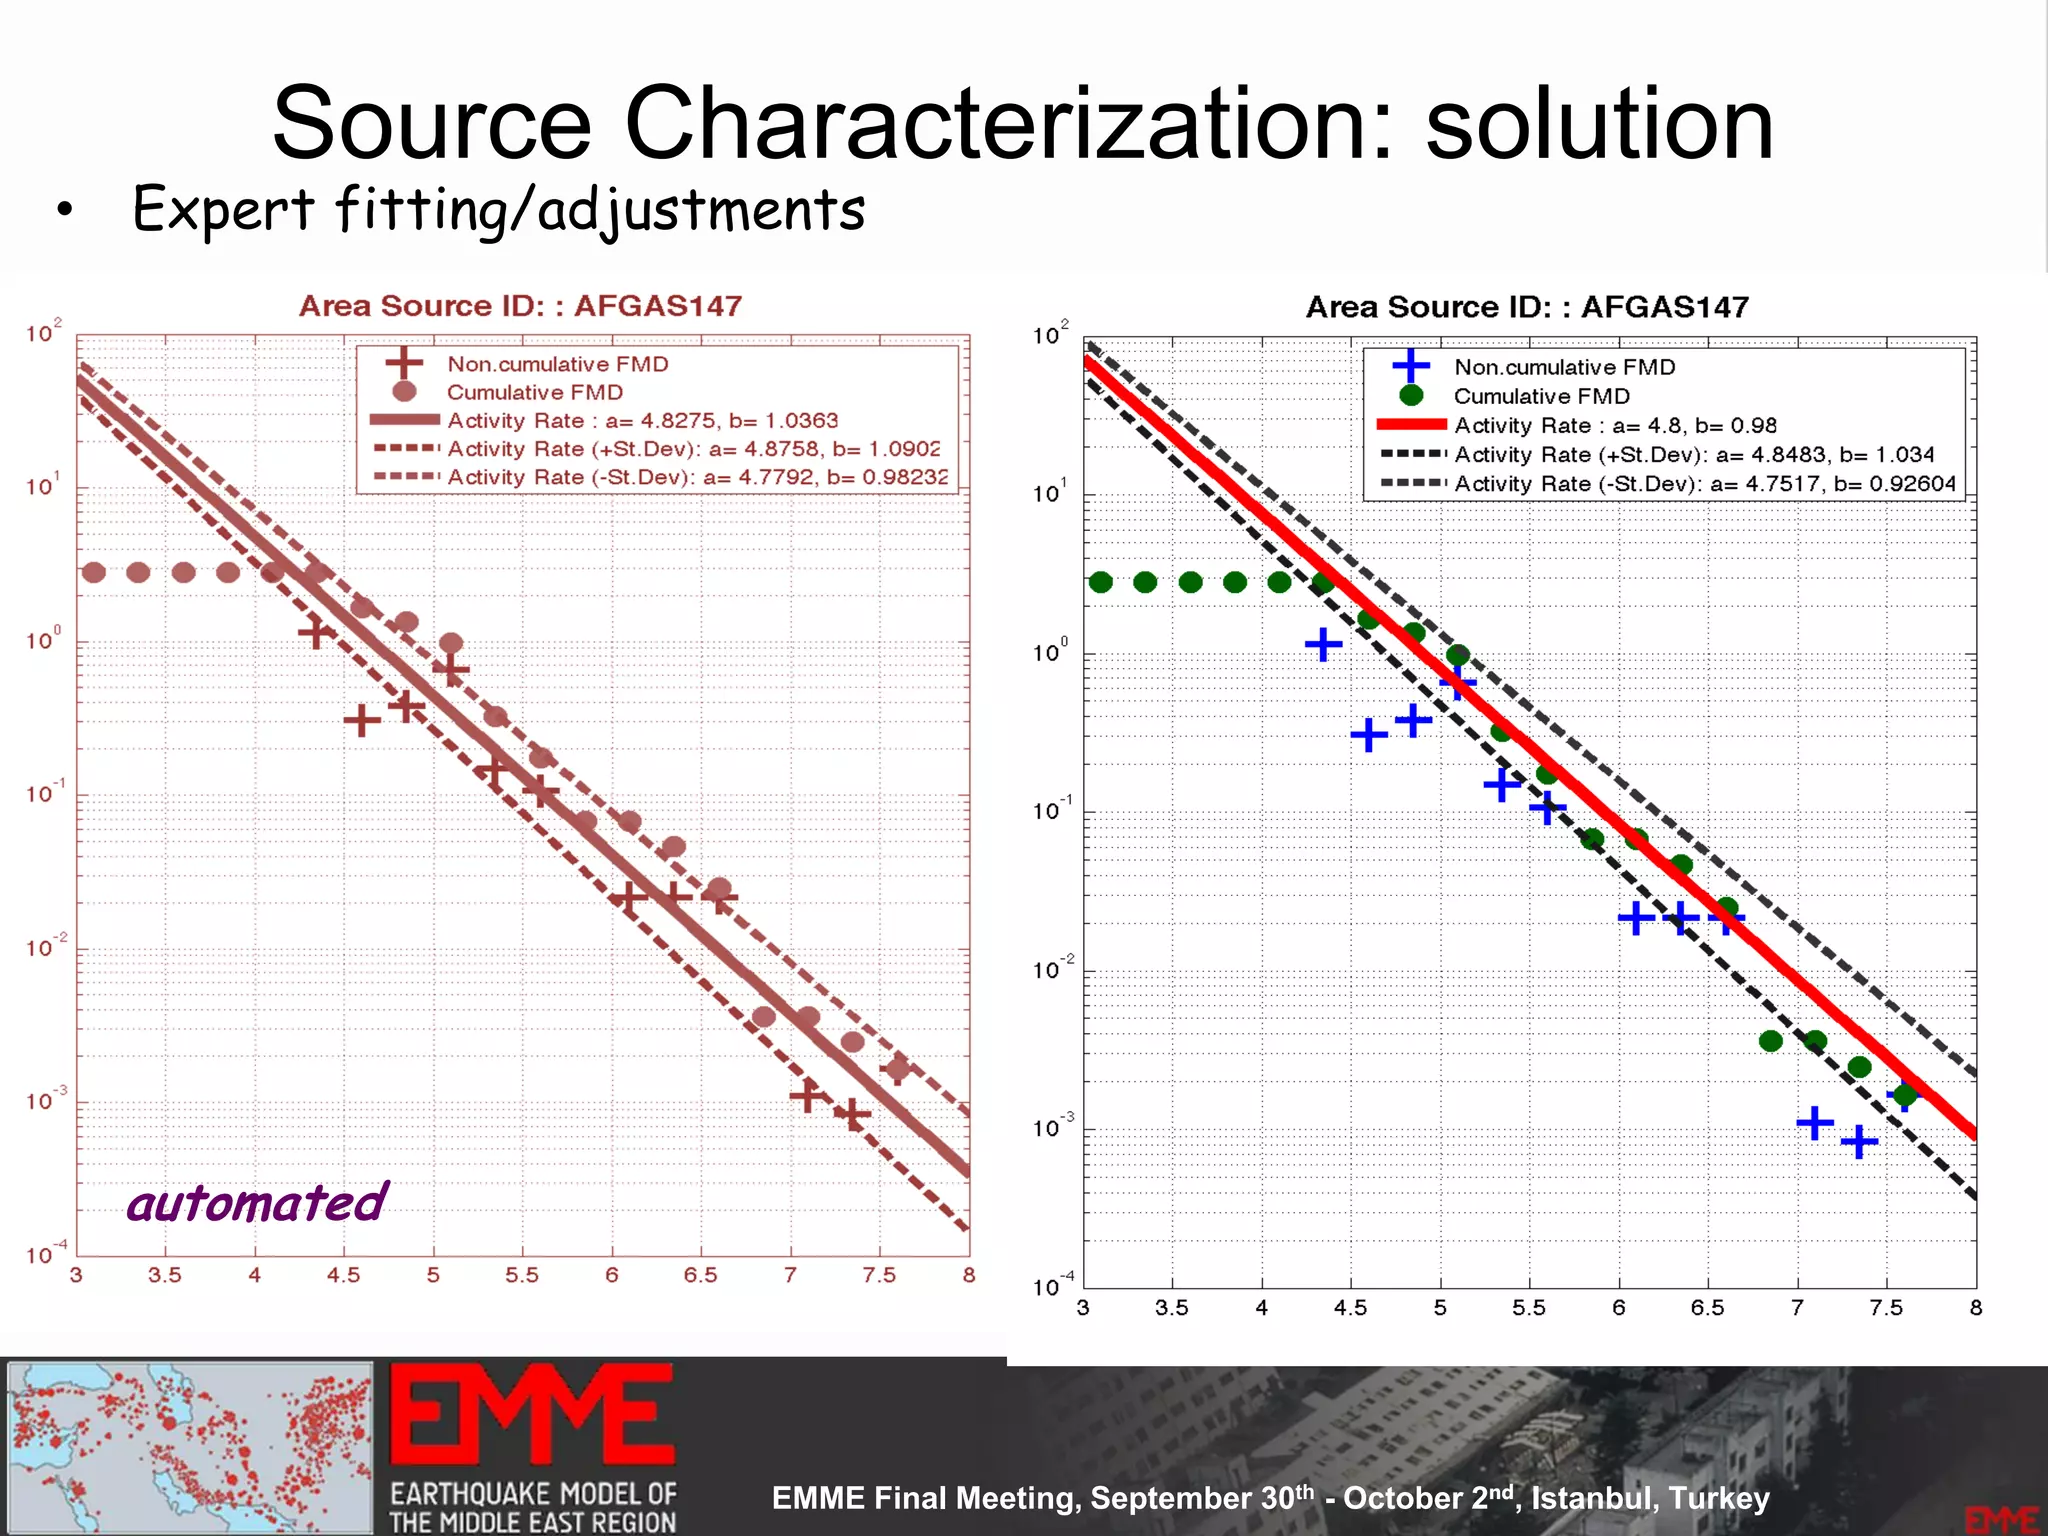
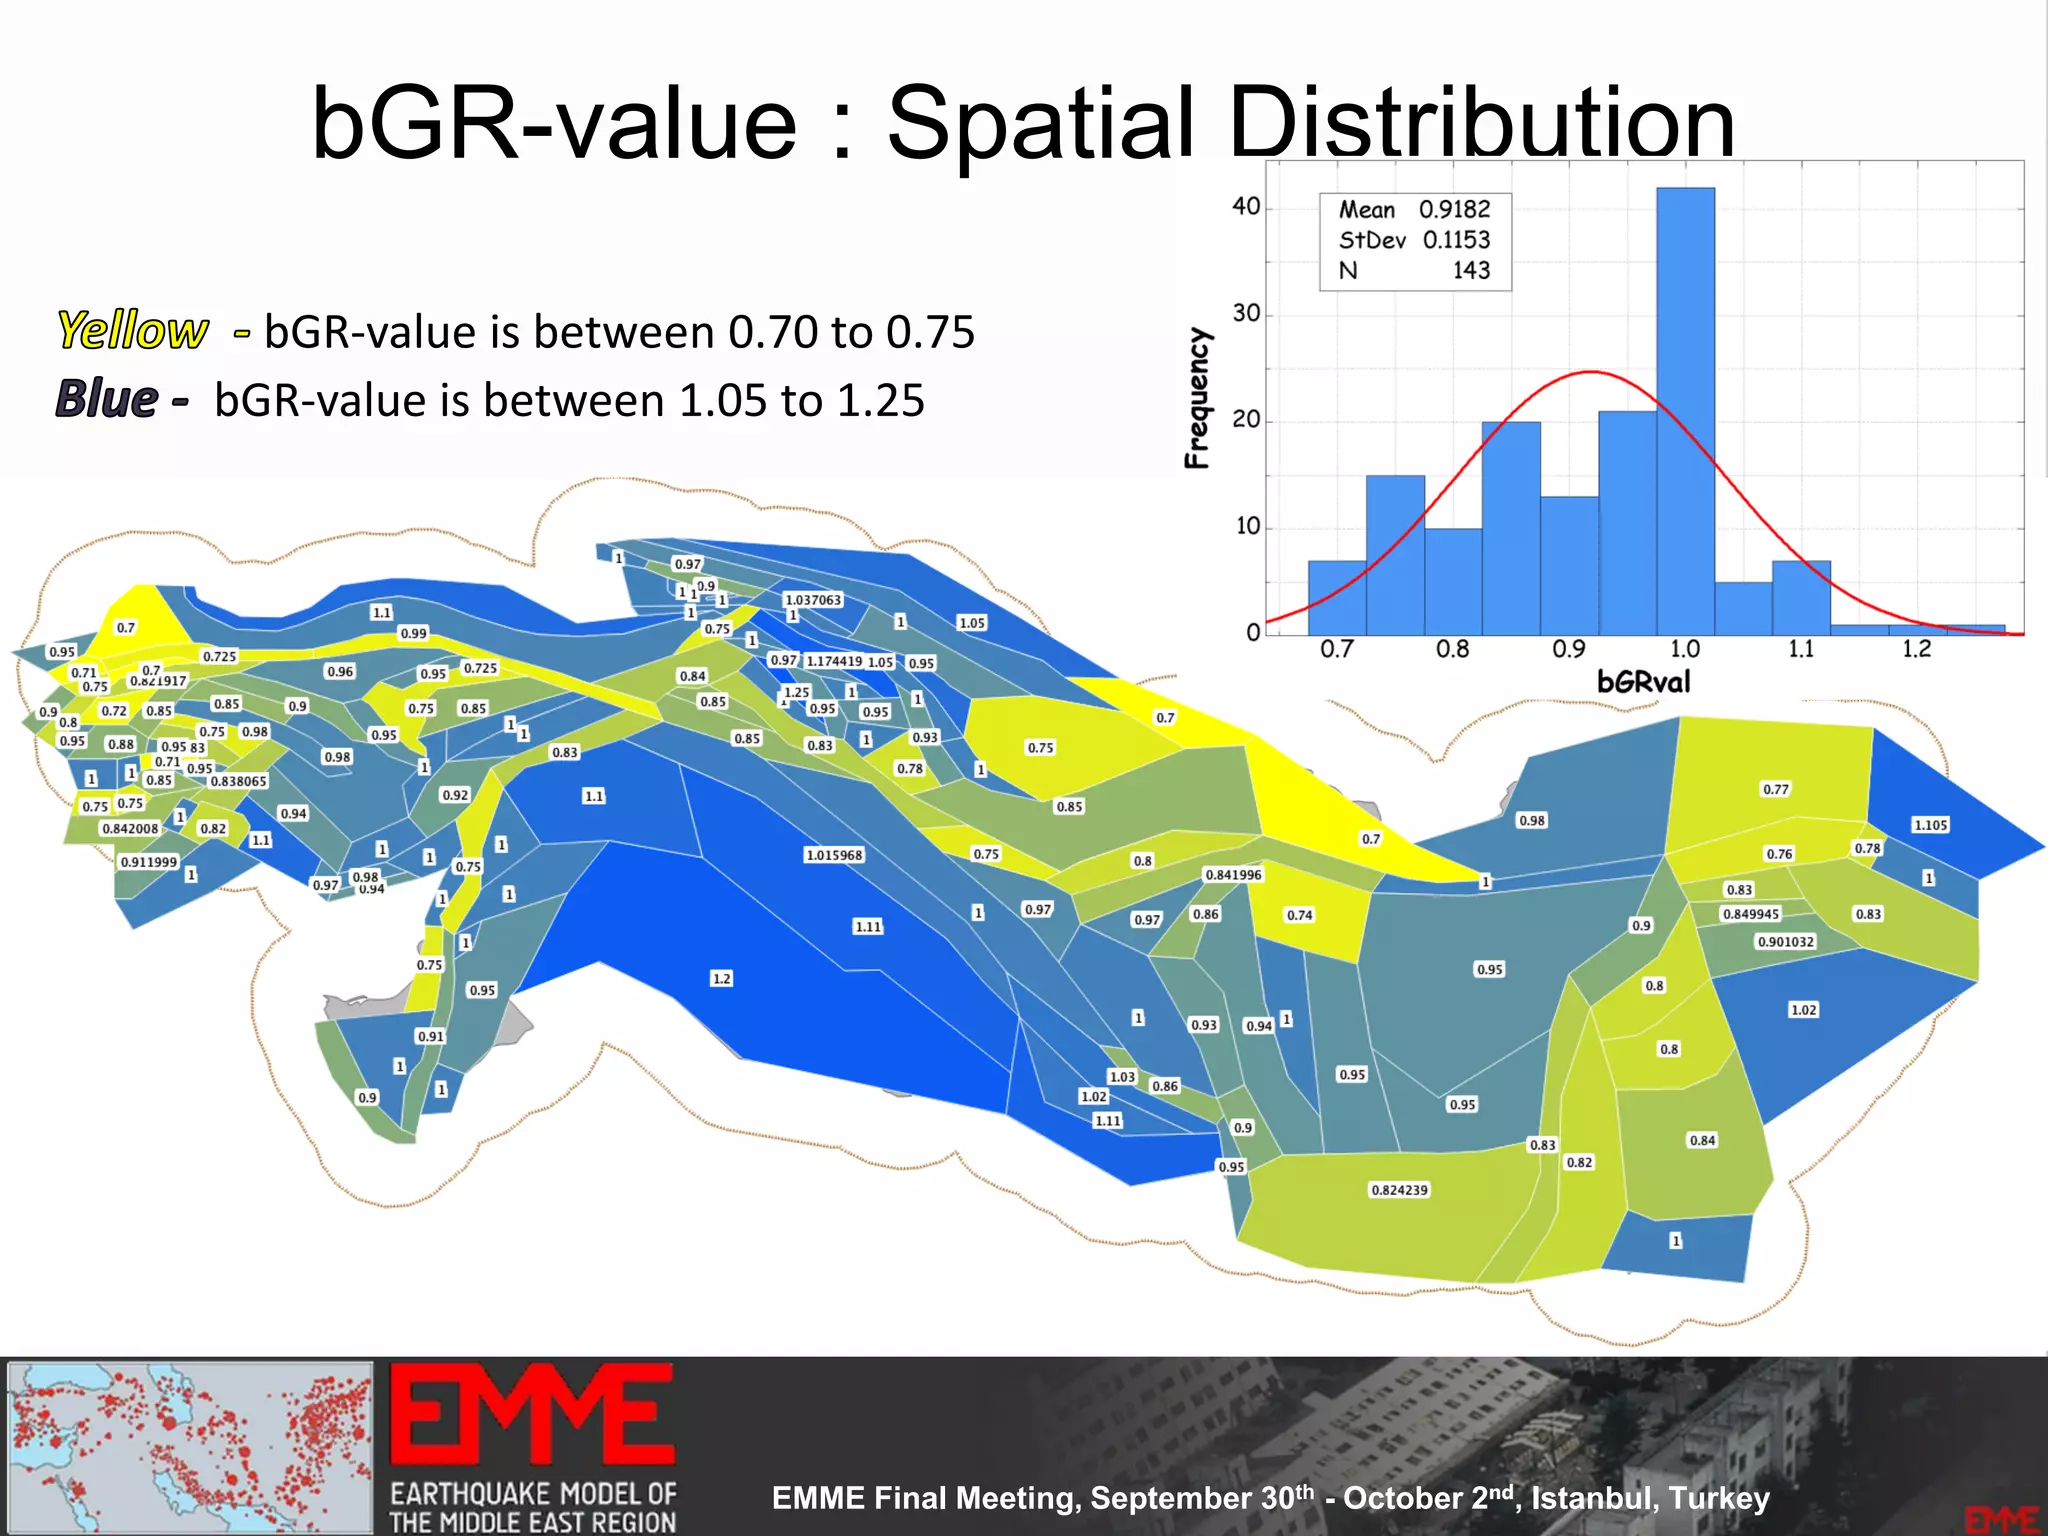
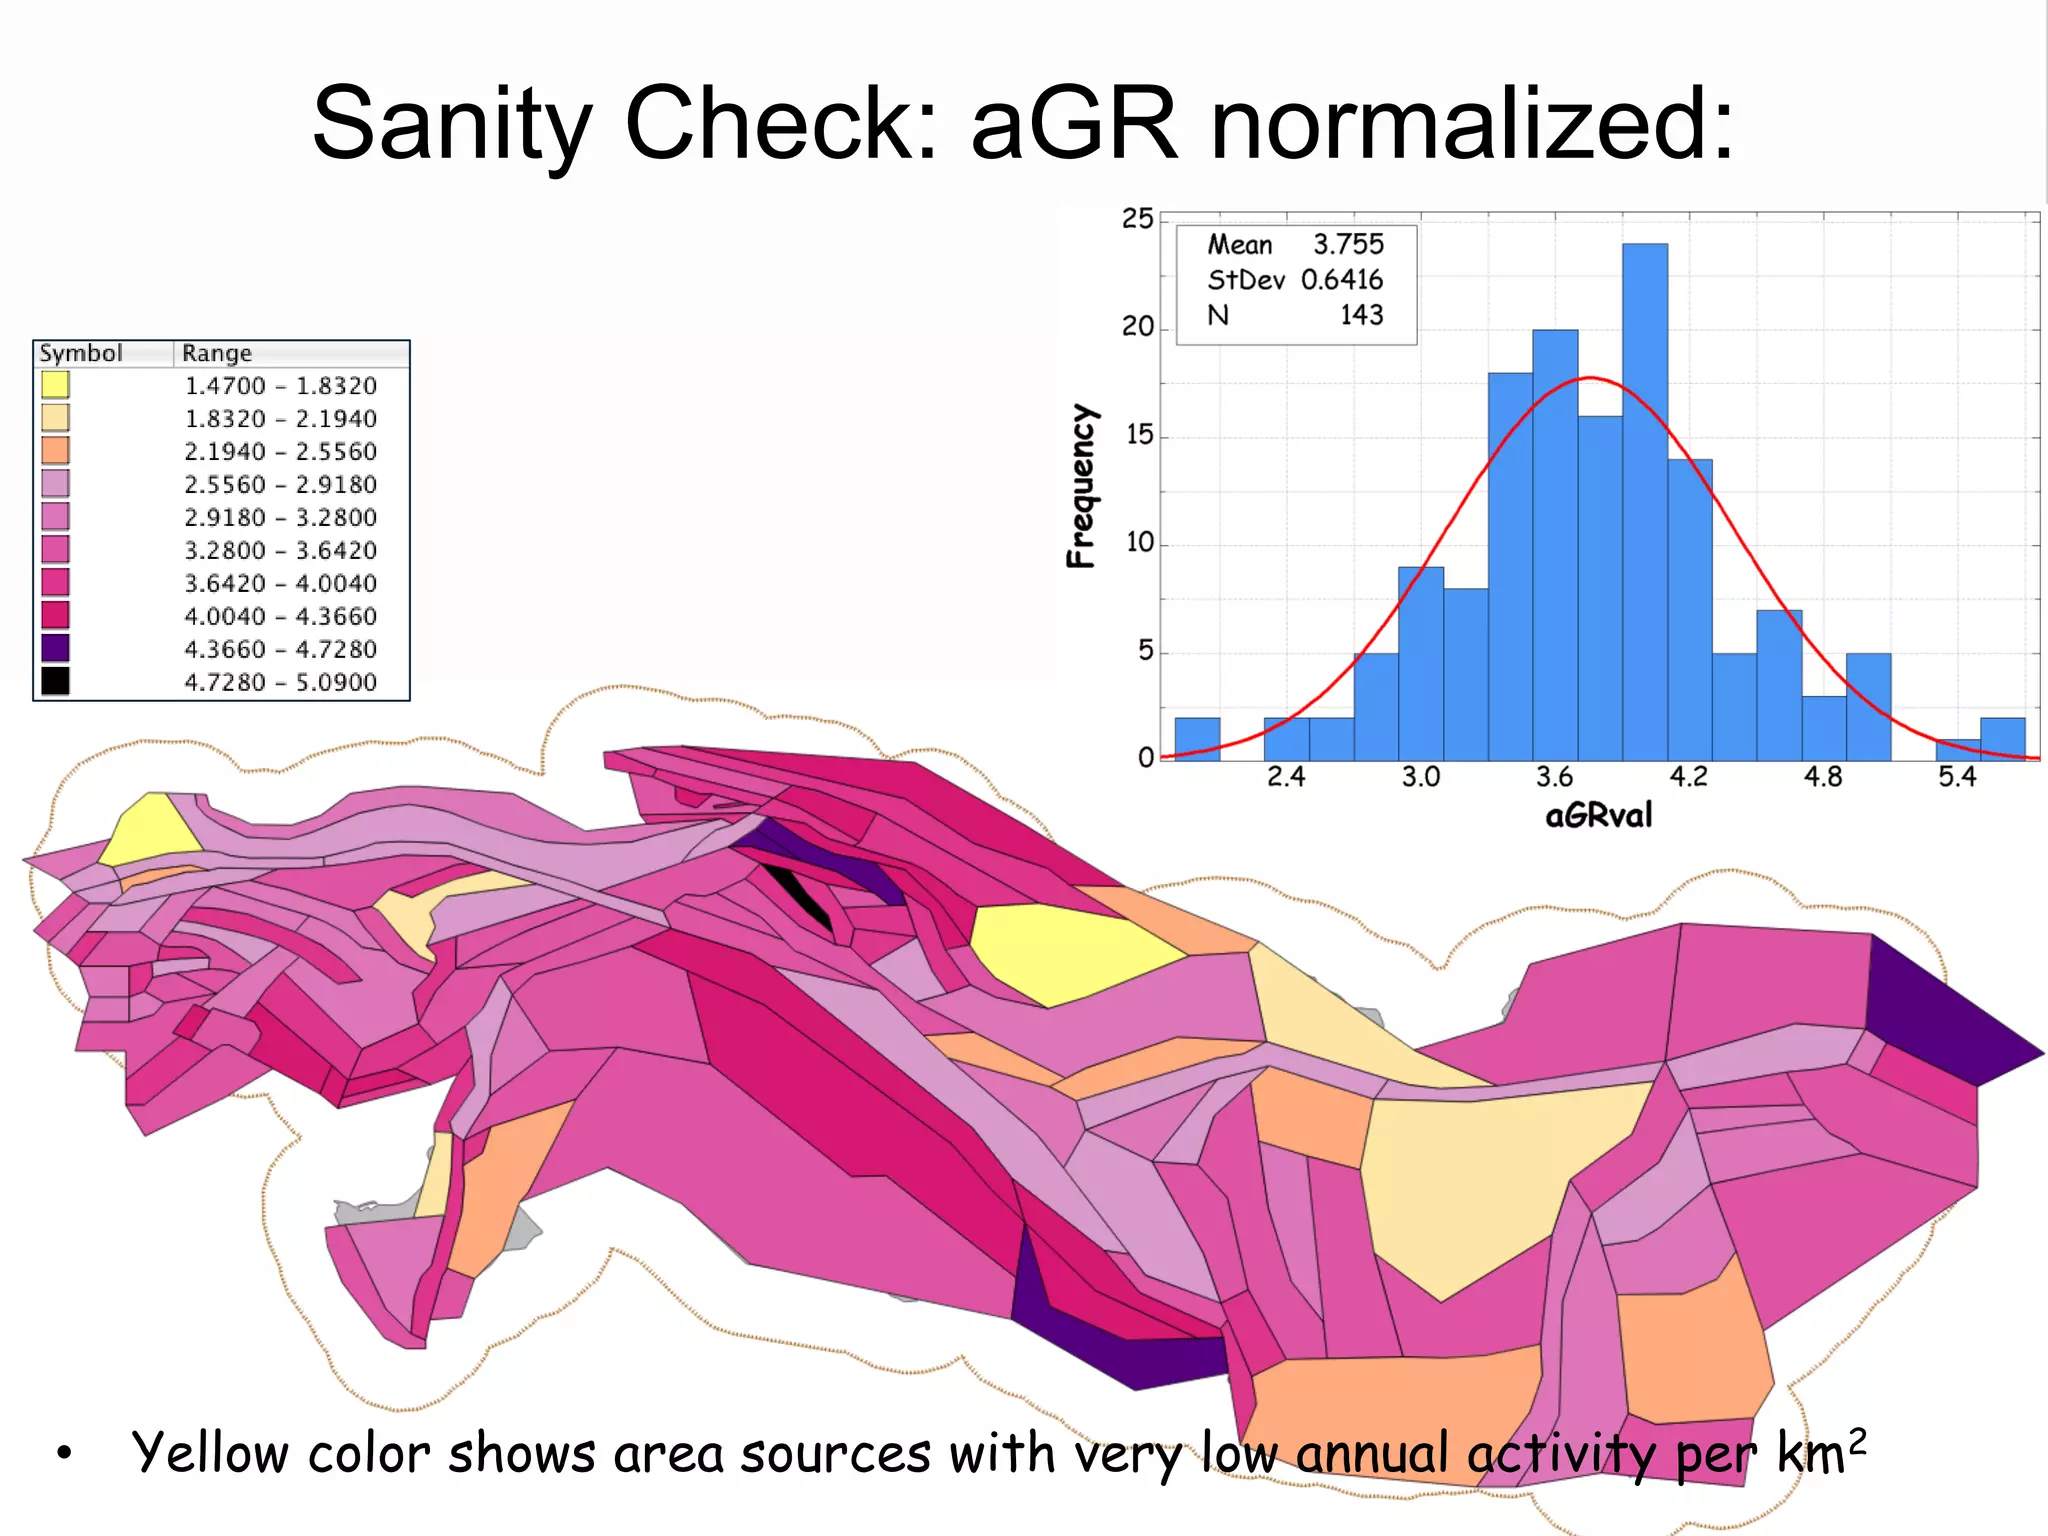
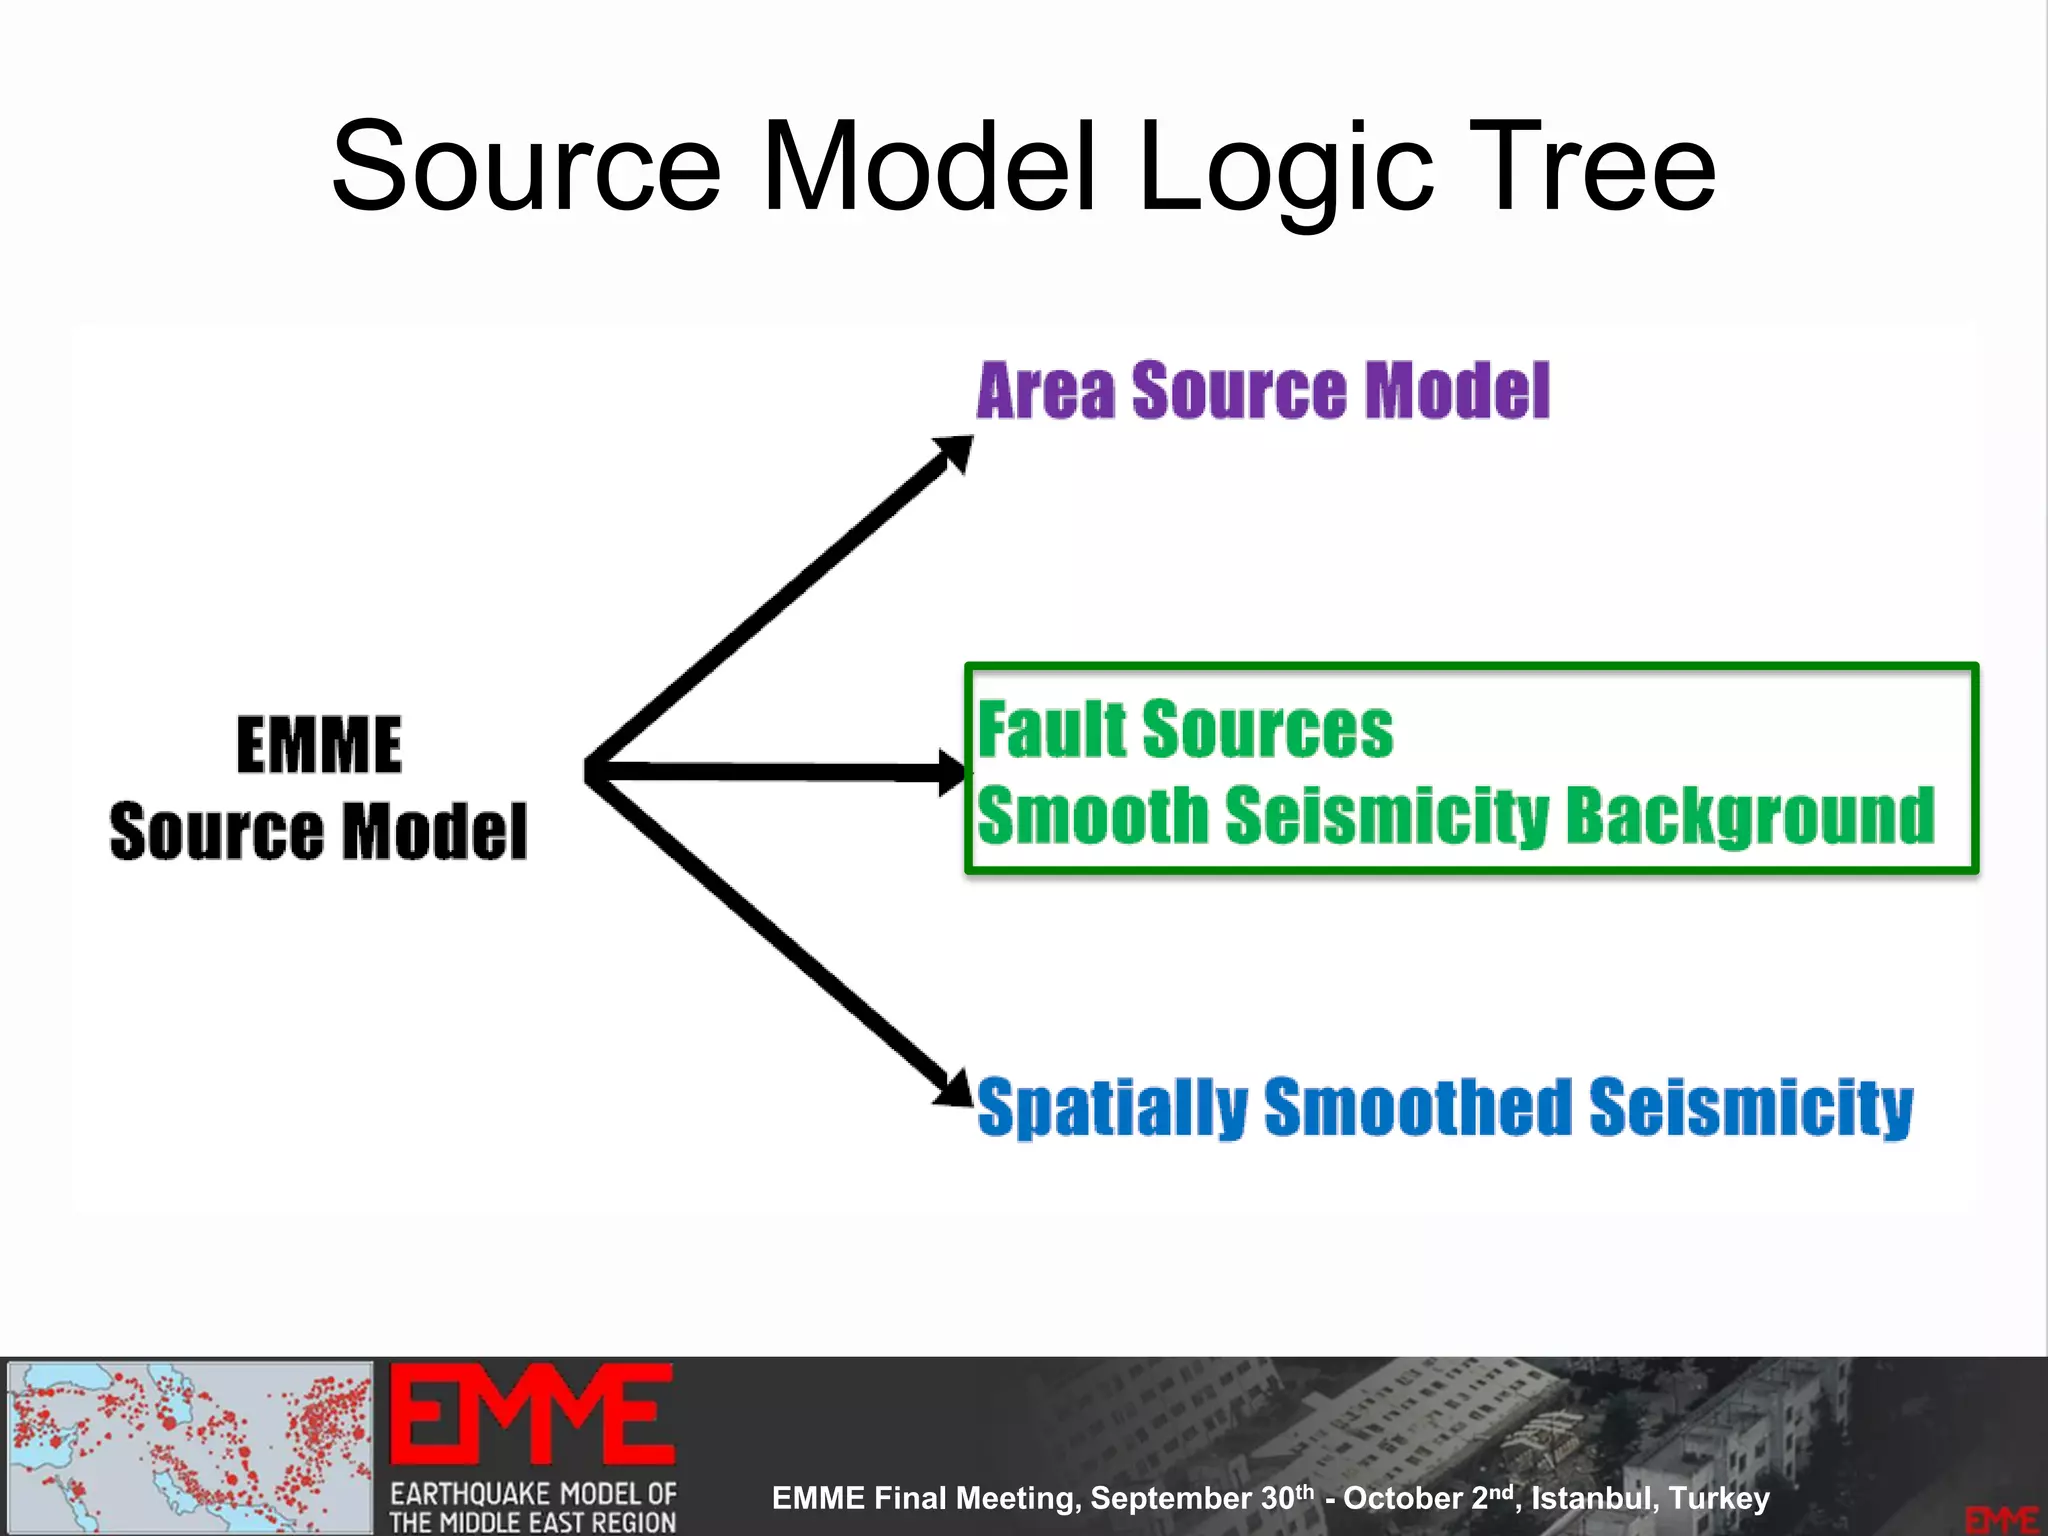
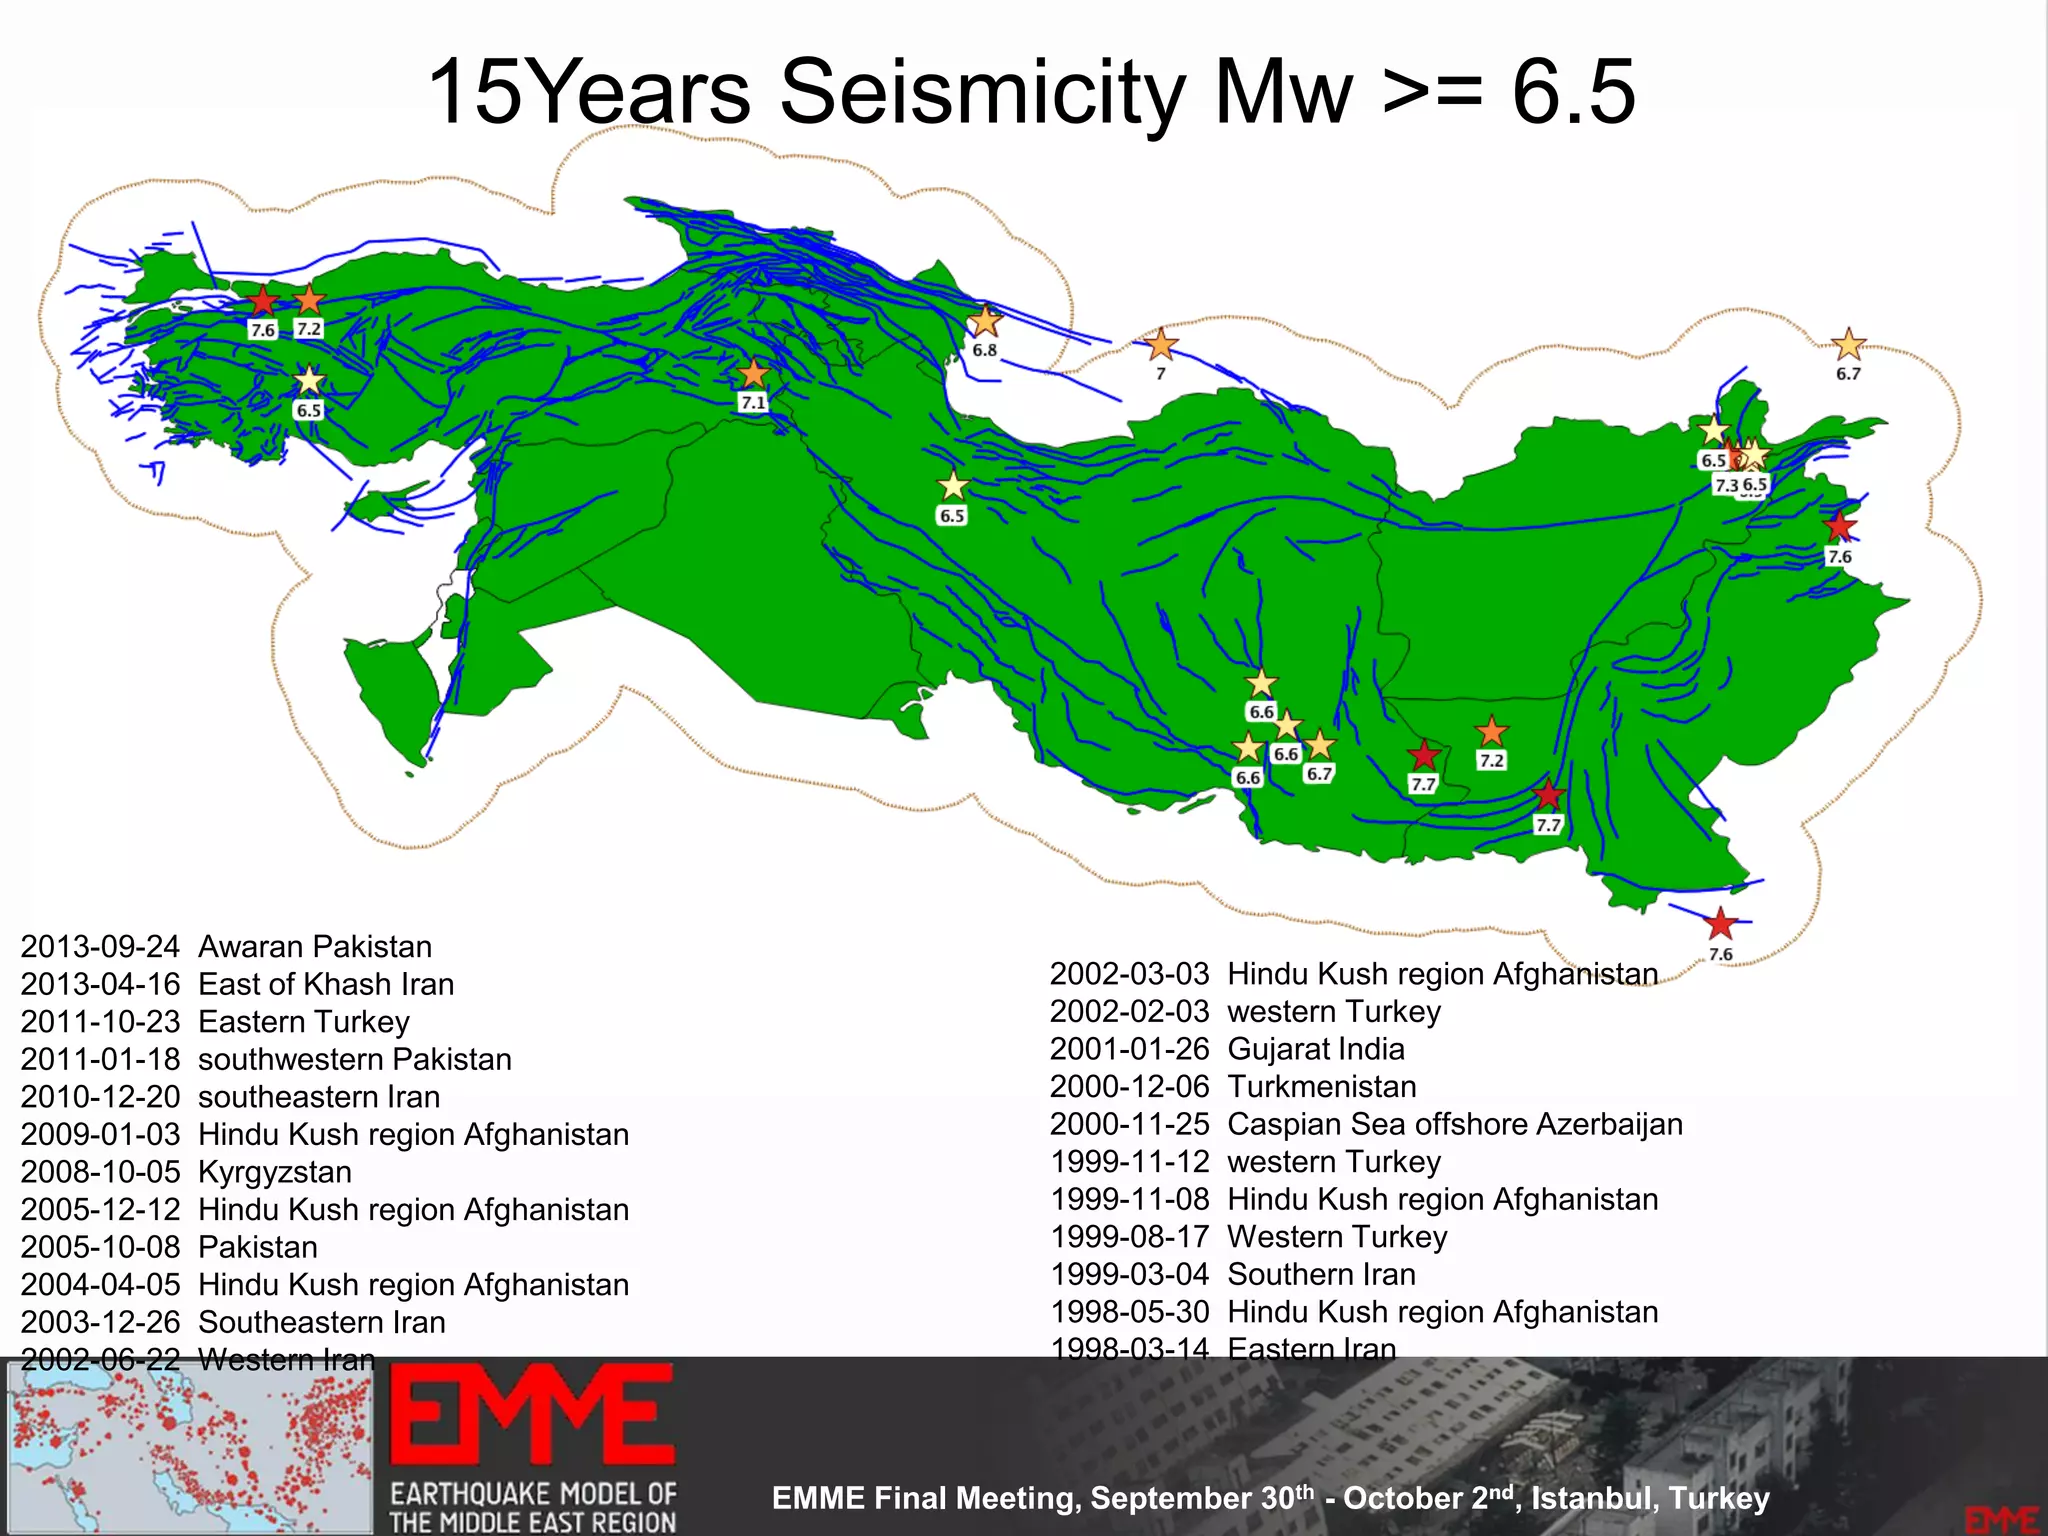
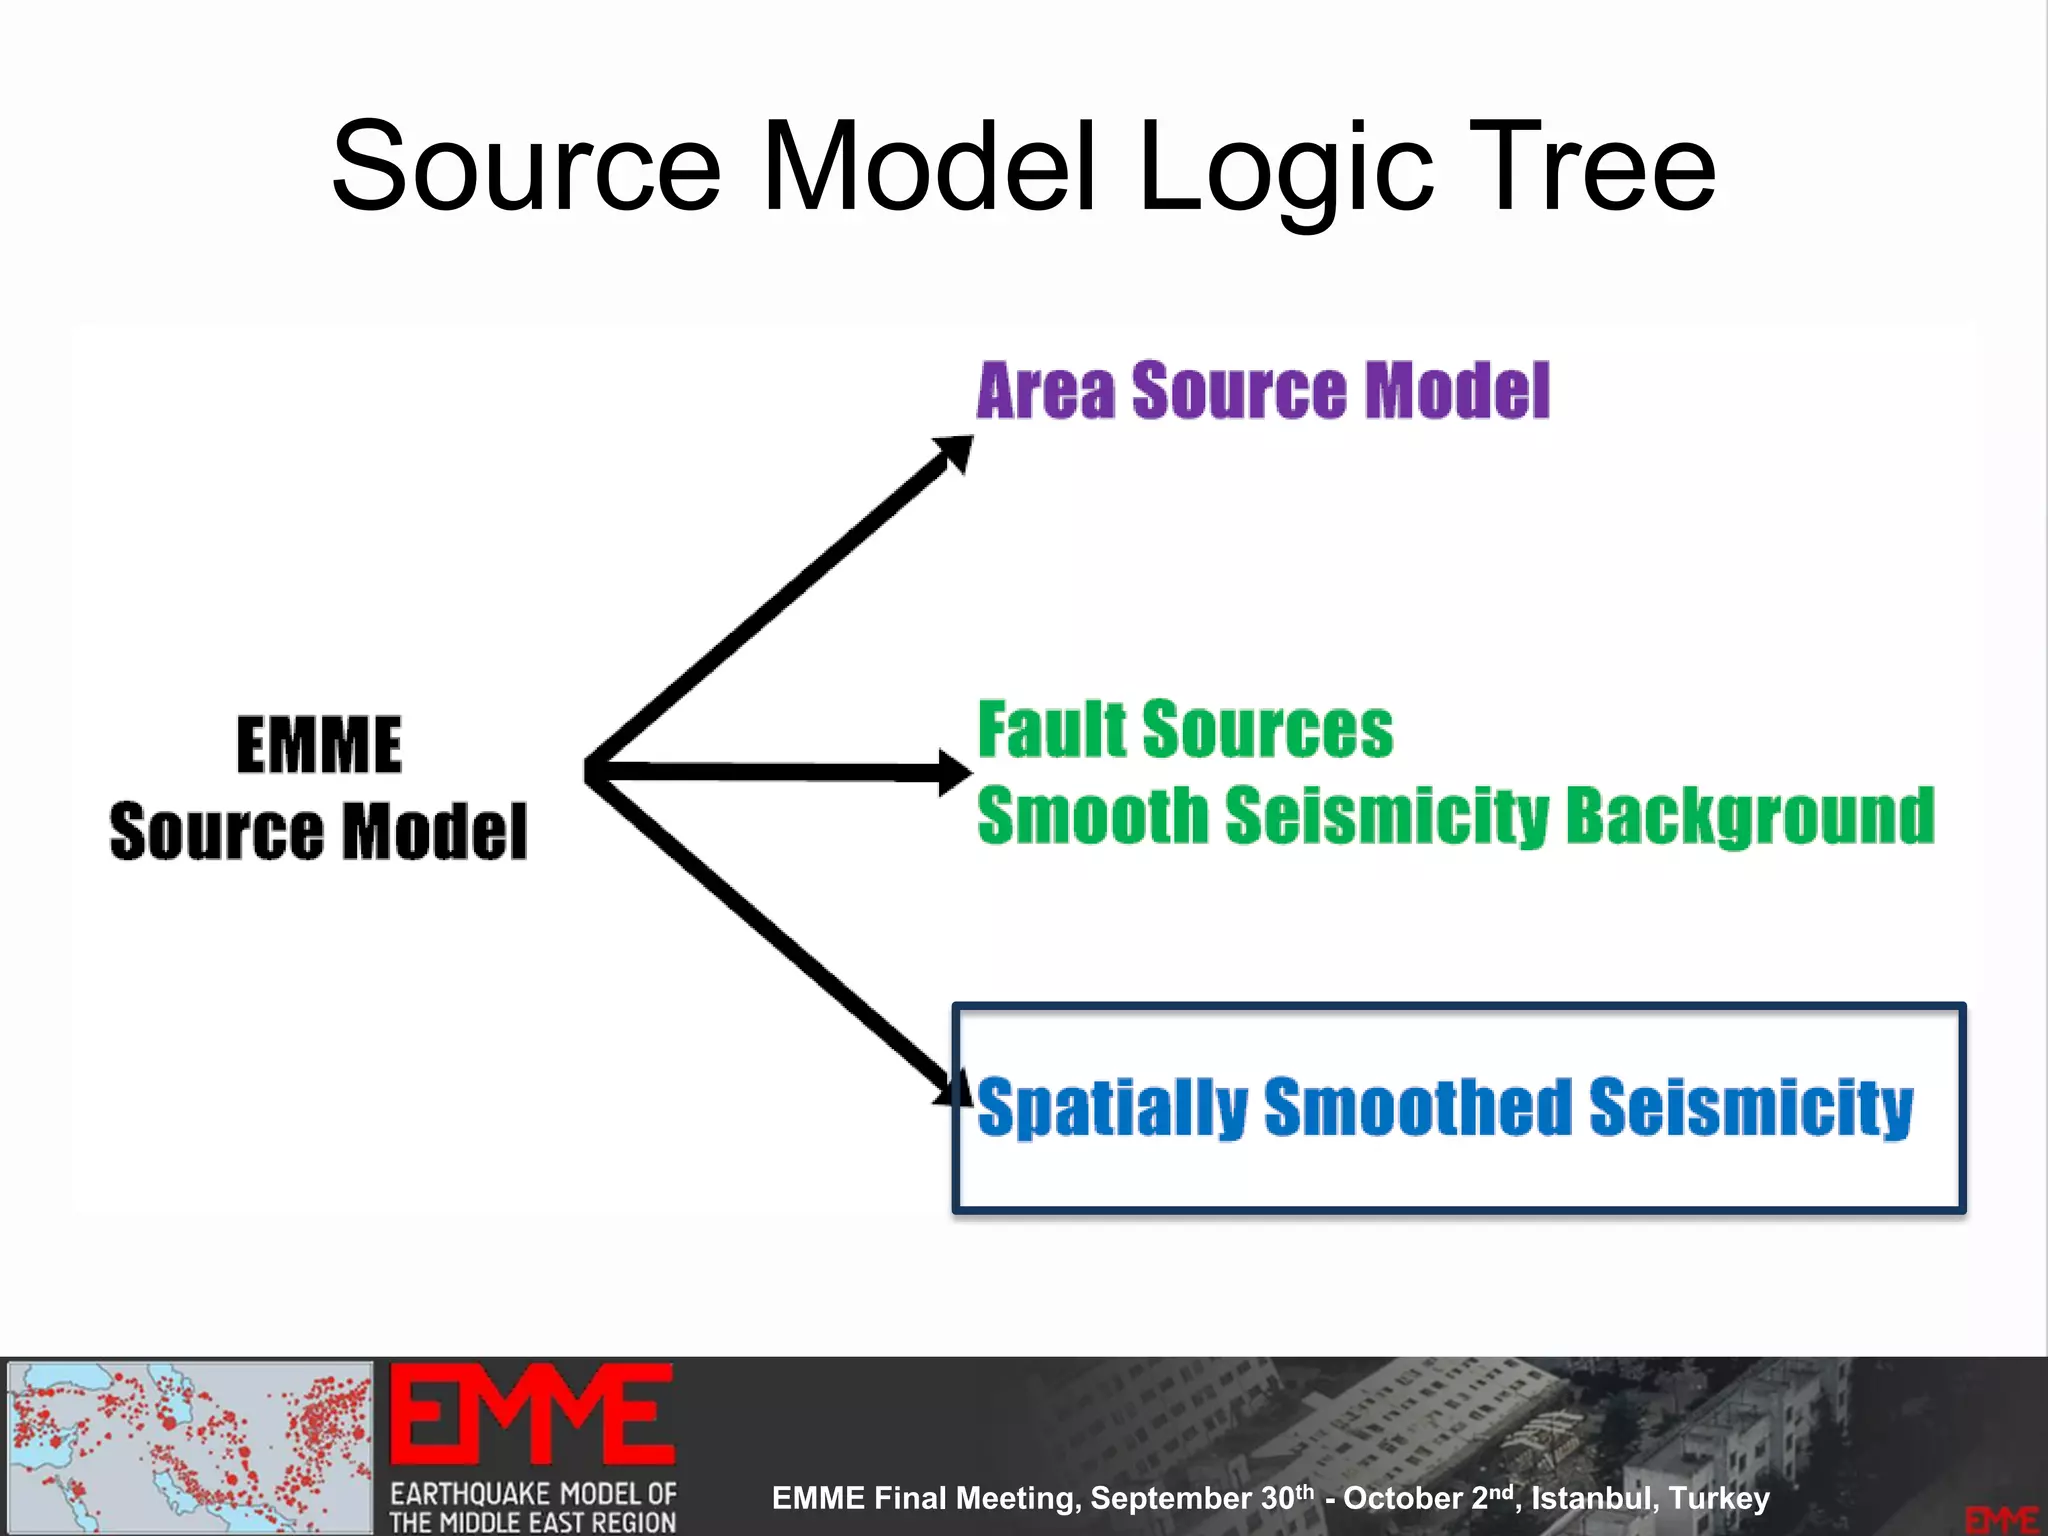
This document summarizes a seismic hazard model for the Middle East region. It includes 3 area source models, 9 fault source models, and a spatially smoothed seismicity model developed based on a declustered earthquake catalog. The models were constructed through a collaborative process involving multiple experts. The key elements summarized are: - 143 area source zones defined based on seismicity patterns and tectonic features. - Fault sources were selected based on being capable and having slip rates above 0.1 mm/year, with 3 confidence classes. - Maximum magnitudes were assigned through various methods with sensitivity analysis performed. - A logic tree incorporates the alternative source models and characterizations. - The models were developed to be stable
![The European [SHARE] Seismic Hazard Model: Genesis, Evolution and Key, Aspec...](https://cdn.slidesharecdn.com/ss_thumbnails/sharegenesisgemreveal2013-130710035507-phpapp01-thumbnail.jpg?width=640&height=640&fit=bounds)


![Coded Agents – with UiPath SDK + LangGraph [Virtual Hands-on Workshop]](https://cdn.slidesharecdn.com/ss_thumbnails/codedagentsdeck-251215155422-5497c599-thumbnail.jpg?width=640&height=640&fit=bounds)


