Here presenting you the Introduction persentation of SFD and BMD. There are some concepts in the presentation. Easy to Understand...!!
Read N Xplore..!!
Structural Integrity Analysis features a collection of selected topics on structural design, safety, reliability, redundancy, strength, material science, mechanical properties of materials, composite materials, welds, finite element analysis, stress concentration, failure mechanisms and criteria. The engineering approaches focus on understanding and concept visualization rather than theoretical reasoning. The structural engineering profession plays a key role in the assurance of safety of technical systems such as metallic structures, buildings, machines, and transport. The first chapter explains the engineering fundamentals of stress analysis.
Helmuth Innerbichler (Bürgermeister Sand in Taufers, Südtirol)Daxboeck_Mostviertel
Eine erfolgreiche Gemeinde- und Regionalentwicklung gelingt durch den Mut zur Vision und durch die Erarbeitung von umfassenden und langfristigen Konzepten. Die Gemeinde Sand in Taufers hat sich bei der Ausarbeitung ihres Entwicklungskonzeptes vor allem auf die Agenda 21-Indikatoren gestützt und konzentriert sich in der Umsetzung auf „Energieautarkie“ sowie „Förderung von Gesundheit und Lebensqualität“. Sand in Taufers ist die erste offizielle Agenda 21-Gemeinde Südtirols und Gewinnerin des Europäischen Dorferneuerungspreises 2008 der ARGE Landentwicklung und Dorferneuerung.
mobile agreements ist ein innovatives Software Unternehmen, eine kreative mobile Agentur und spezialisiert auf mobile Lösungen - Apps für Smartphones, Tablets, TV, Watches und Enterprise Apps.
Wir sind ein 18-köpfiges Team und realisieren seit 2007 sehr erfolgreich mobile Konzepte und integrierte Lösungen, welche bei namhaften Unternehmen und Agenturen im DACH Raum im Einsatz sind.
Use of mesoscale modeling to increase the reliability of wind resource assess...Jean-Claude Meteodyn
During wind farm design phase, the wind direction distribution is a crucial information for wind turbine layout optimization. However, in complex terrains, the wind rose at hub height of the wind turbines can be quite different from met mast measurement.The study shows that in complex terrains, the use of mesoscale modeling provides a complement to met mast measurement. It allows to better determine the turbine-specific wind rose and to reduce the uncertainty in wind resource assessment. The coupling of mesoscale and CFD model allows to produce high resolution wind map, by taking into account both mesoscale and microscale terrain effects.
AUTOMATIC IDENTIFICATION OF CLOUD COVER REGIONS USING SURF ijcseit
Weather forecasting has become an indispensable application to predict the state of the atmosphere for a
future time based on cloud cover identification. But it generally needs the experience of a well-trained
meteorologist. In this paper, a novel method is proposed for automatic cloud cover estimation, typical to
Indian Territory Speeded Up Robust Feature Transform(SURF) is applied on the satellite images to obtain
the affine corrected images. The extracted cloud regions from the affine corrected images based on Otsu
threshold are superimposed on the artistic grids representing latitude and longitude over India. The
segmented cloud and grid composition drive a look up table mechanism to identify the cloud cover regions.
Owing to its simplicity, the proposed method processes the test images faster and provides accurate
segmentation for cloud cover regions.
Chronological Calibration Methods for Landsat Satellite Images iosrjce
IOSR Journal of Applied Physics (IOSR-JAP) is a double blind peer reviewed International Journal that provides rapid publication (within a month) of articles in all areas of physics and its applications. The journal welcomes publications of high quality papers on theoretical developments and practical applications in applied physics. Original research papers, state-of-the-art reviews, and high quality technical notes are invited for publications.
The peer-reviewed International Journal of Engineering Inventions (IJEI) is started with a mission to encourage contribution to research in Science and Technology. Encourage and motivate researchers in challenging areas of Sciences and Technology.
Ill-posedness formulation of the emission source localization in the radio- d...Ahmed Ammar Rebai PhD
To contact the authors : tarek.salhi@gmail.com and ahmed.rebai2@gmail.com
In the field of radio detection in astroparticle physics, many studies have shown the strong dependence of the solution of the radio-transient sources localization problem (the radio-shower time of arrival on antennas) such solutions are purely numerical artifacts. Based on a detailed analysis of some already published results of radio-detection experiments like : CODALEMA 3 in France, AERA in Argentina and TREND in China, we demonstrate the ill-posed character of this problem in the sens of Hadamard. Two approaches have been used as the existence of solutions degeneration and the bad conditioning of the mathematical formulation problem. A comparison between experimental results and simulations have been made, to highlight the mathematical studies. Many properties of the non-linear least square function are discussed such as the configuration of the set of solutions and the bias.
Multi-Resolution Analysis: MRA Based Bright Band Height Estimation with Preci...Waqas Tariq
A method for reconstruction of cross section of rainfall situations with precipitation radar data based on wavelet analysis of Multi-Resolution Analysis (MRA) which allows extract a peak of the radar reflectivity is proposed in order to detect bright band height. It is found that the bright band height can be estimated by using the MRA with the basis of Daubechies wavelet family. It is also found that the boundaries in rainfall structure can be clearly extracted with MRA.
Multi-Resolution Analysis: MRA Based Bright Band Height Estimation with Preci...
AIAA Paper dlt228
1. American Institute of Aeronautics and Astronautics
1
Global Environment Characterization with Satellite
Mitigation
Dwight L. Temple1
Mississippi State University, Mississippi State, MS, 39762
In many instances, environmental effects can deleteriously influence the performance of the
Ballistic Missile Defense System (BMDS). One method to overcome this obstacle is to
characterize the terrestrial environment to support optimal selection of sensors in order to
fulfill the mission. The ground-temperature threshold of IR imagery could be adjusted to
approximate a RADAR system’s observations. In order for the implementation to be
successful, it was necessary to obtain the image edges of significant weather, convert the X-Y
data points into three-dimensional convex hulls, and project the weather events onto a model
Earth. To demonstrate effectiveness, a medium-fidelity missile propagator was created using
Lambert’s Universal algorithm to determine the required launch velocity given the
trajectory time, initial, and final positions in latitude, longitude, and altitude. Due to the
likelihood of LOS being obstructed by terrain or weather events, a desirable goal is to have a
fiscally mangeagable satellite constellation capable of making detections when ground based
EO/IR resources are unavailable. For simplicity of analysis, the IRIDIUM satellite
constellation was implemented into MATLAB using a built-in, fixed time step integrator,
ode113. In order to portray the ameliorating effects of the implementation of the satellite
constellation and deleterious effects of cloud coverage, several test scenarios were conducted.
Nomenclature
cloudBase = altitude of cloud base (meters)
dx = direction of x-component
dy = direction of y-component
dz = direction of z-component
r = sphere radius
RH = relative humidity
t = parametric variable
TD = temperature of dewpoint
tempC = current local temperature in Celsius
x0 = x component of line
xc = x location of sphere center
y0 = y component of line
yc = y location of sphere center
z0 = z component of line
zc = z location of sphere center
I. Introduction
ithin the missile defense operation, there are numerous arduous technical issues encountered,
especially in a fiscally constrained environment. For example, positioning and allocating sensors
around the Earth or in space to track and characterize threatening objects proves to be challenging
while defending homeland and allied assets. In many instances, environmental effects can deleteriously influence
the performance of the Ballistic Missile Defense System (BMDS). More specifically, precipitation and cloud cover
can cause degradation of measurements for both Electro Optical / Infrared (EO/IR) and radio frequency (RF) sensors
through the introduction of noise. One method to overcome this obstacle is to characterize the terrestrial
environment to support optimal selection of sensors in order to fulfill the mission. This characterization is not
1
Student, Aerospace Engineering, 501 Hardy Rd., Student Member.
W
2. American Institute of Aeronautics and Astronautics
2
arbitrary; therefore, assumptions must be made regarding sensor performance. (Numerous sources have shown that
the attenuation due to atmospheric effects such as intense precipitation is severe enough to hamper completely
EO/IR performance.)1
Therefore, for the purposes of this analysis, any significant weather will be considered to
attenuate the sensor performance by 100%. Based on this assumption, the sensor becomes effectively useless and
wastes the precious battle-space resource of time. In addition to environment characterization, the implementation of
a small-satellite constellation to provide continuous global coverage can ameliorate coverage gaps due to weather
events or insufficient line of sight.
II. Determining Line of Sight
Determining line of sight may seem like a trivial matter; however, there are sophisticated methods of
approaching the issue. As a result, the accurate line of sight (LOS) vector can be obtained and subsequently used in
further calculations such as triangulated intersections. For this MATLAB model, the method used for LOS was a
three-dimensional quadratic equation.2
This allows for the accurate determination of a ray intersection of one or two
spheres, depending on what is desired. In order to determine LOS between a missile trajectory and the Earth, one
sphere (the Earth) was used. Using Eq. 1 shown below, the terms can be expanded and grouped by the parametric
term, t, as shown in Eq. 2.
(𝑥0 + 𝑑 𝑥 ∗ 𝑡 − 𝑥 𝑐)2
+ (𝑦0 + 𝑑 𝑦 ∗ 𝑡 − 𝑦𝑐)
2
+ (𝑧0 + 𝑑 𝑧 ∗ 𝑡 − 𝑧 𝑐)2
= 𝑟2
(1)
[𝑑 𝑥
2
+ 𝑑 𝑦
2
+ 𝑑 𝑧
2
]𝑡2
+
[2𝑑 𝑥(𝑥0 − 𝑥 𝑐) + 2𝑑 𝑦(𝑦0 − 𝑦𝑐) + 2𝑑 𝑧(𝑧0 − 𝑧 𝑐)]𝑡
[𝑥0
2
+ 𝑥 𝑐
2
− 2𝑥0 𝑥 𝑐 + 𝑦0
2
+ 𝑦𝑐
2
− 2𝑦0 𝑦𝑐 + 𝑧0
2
+ 𝑧 𝑐
2
− 2𝑧0 𝑧 𝑐] = 𝑟2
(2)
Congruent with the quadratic formula, each of the coefficients of “t” becomes the terms, “a”, “b”, and “c”,
respectively. The pertinent result is the sign of the discriminant. For example, if the discriminant is positive, there
are two intersections of the line and sphere; likewise, if it is negative, there are no intersections on the sphere.
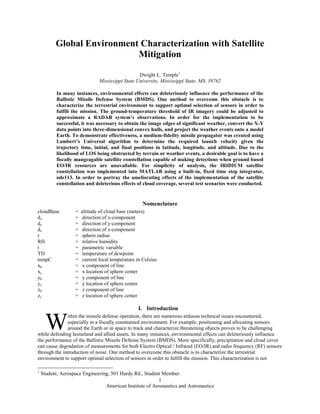
Notably, if the discriminant is zero, there is exactly one intersection at the surface. When performing numerous LOS
calculations, an effective and repeatable method of determining visibility is necessary for accuracy. An example of
the line segment and sphere intersection is shown below in Fig. 1. It varies case-by-case; however, this is an
example of one intersection with the sphere; therefore, there is no line of sight.
III. Environment Characterization
In order to characterize the environment, specific limiting
factors were defined. Foremost, all analysis were completed
using publically available information because access to global
radar data was unavailable. However, there was open-sourced
global infrared imagery available from Weather Underground.
The reasoning behind using available weather information results
from the method of weather information acquisition.
Geosynchronous satellites use a variety of sensors; one of these
sensors is an IR camera. Therefore, one can observe the imagery
from the satellite and determine where a typical ground-based IR
sensor can and cannot be used. If the geosynchronous satellite
cannot observe the ground using IR, then it was assumed an IR
sensor on Earth could not observe through the same attenuating weather. Of course, this does not solve the issue
regarding RADAR attenuation; however, there was an approximation available. The ground-temperature threshold
(GTT) of the IR imagery could be adjusted to approximate a RADAR system’s observations. GTT is the sensitivity
of the IR sensor to temperature of the foreground versus the background such as the cloud versus the ground
temperature. The result was an image that resembled a RADAR observation; consequently, this resulting image,
shown in Fig. 2, was used in further analysis.
Figure 1. Intersection of Line Segment
and Sphere
3. American Institute of Aeronautics and Astronautics
3
Figure 2. RADAR approximation using IR
To make use of this imagery for calculations and simulations, it was required to be implemented into a three-
dimensional MATLAB model. In order for the implementation to be successful, it was necessary to obtain the image
edges of significant weather, convert the X-Y data points into three-dimensional convex hulls, and project the
weather events onto a model Earth.
A). Seeking Significant Weather Edges
To begin, the acquired image was divided into smaller, more
manageable pieces. This was accomplished by specifying the
desired number of latitudinal and longitudinal slices and then
iteratively creating new images along every specified division of
pixels. Within this program, there were 48 latitudinal and 200
longitudinal slices made; therefore, there were 9,600 smaller
images to analyze. Using MATLAB, the image was converted to
binary and a convex hull was drawn around the remaining
information in each image. For clarity, a convex hull is defined to
be the convex envelope that minimally encapsulates a set of points.
For this case, the set of points were pixels remaining in the images
and were representative of significant weather. An example of the
convex hull can be seen in Fig. 3.
In addition to defining individual clouds using X and Y points,
each cloud was assigned a specific latitude and longitude for
accurate projection onto the model. This latitude and longitude was
based off the position in the original satellite image and defined to
be at the centroid of the drawn convex hull as seen in Fig. 3. Accordingly, if no convex hull was drawn in the image,
then no cloud was generated in that location.
B). Assigning Accurate Altitudes
Using the calculated latitude and longitude for each cloud, an application program interface (API) call can be
made to WeatherUnderground.com to acquire the relative humidity and temperature information for each location.
This allowed the use of Eq. 3 below to solve for the dewpoint temperature and subsequently, the altitude of the
cloud base by using Eq. 43
. Because sea level and cloud altitude varies for each location, it was a necessary
component for determining accurately the LOS between sensor and target.
𝑇𝐷 =
243.04∗log
𝑅𝐻
100
+
4283.58∗𝑡𝑒𝑚𝑝𝐶
𝑡𝑒𝑚𝑝𝐶+243.04
log
𝑅𝐻
100
+
17.625∗𝑡𝑒𝑚𝑝𝐶
𝑡𝑒𝑚𝑝𝐶+243.04
−17.625
(3)
𝑐𝑙𝑜𝑢𝑑𝐵𝑎𝑠𝑒 =
1000(𝑡𝑒𝑚𝑝𝐶−𝑇𝐷)
4.4
(4)
Figure 3. Convex Hull Drawn around
Significant Weather
4. American Institute of Aeronautics and Astronautics
4
Figure 4. Cloud Hulls Projected onto Model
Figure 5. IRIDIUM Constellation
C). Projecting onto Model
With respect to the Earth-Center Inertial (ECI)
reference frame using the current Greenwich Mean
Sidereal Time (GMST), vectors were drawn from the
origin to the respective latitude, longitude, and altitude
(LLA) for each cloud after LLA was converted to ECI.
Consequently, knowing the vector position of the cloud
and the original X-Y plane vector allowed for a
quaternion rotation between two points. The result was a
projected convex hull perpendicular to the ground
location at the designated LLA; essentially, a three-
dimensional convex hull cloud was formed. An example
is displayed in Fig. 4.
IIV. Missile Propagation
With the weather coverage correctly implemented into the model, it was necessary to demonstrate effectiveness.
This was made possible using a medium-fidelity missile propagator. To generate the propagator, Lambert’s
Universal algorithm4,5
was used to determine the required launch velocity given the trajectory time, initial, and final
positions in LLA.
Once this velocity vector was acquired, a numerical propagation approach was used. In order to approximate
satisfactorily the missile’s trajectory, all major types of accelerations were implemented. These include a 4th
degree
approximation of Earth’s gravity field, accelerations due to the Sun and Moon given their current positions, and
atmospheric resistance. While higher degree gravitational calculations were possible, for the short-duration
trajectory, it was not entirely necessary. Actually, computational time exponentially increased when using higher
order models; therefore, it was considered sufficient to represent only the four most significant spherical harmonics
of Earth. Notably, atmospheric resistance was a vital component of realistically approximating a missile’s trajectory.
Since a substantial portion of a missile’s time in flight is spent in the atmosphere, drag forces can significantly alter
the flight. While the net result of some perturbations over a short flight time was minute, for the application,
robustness was an estimable goal.
V. Small Satellite Constellation
Due to the likelihood of LOS being obstructed by terrain or weather events, a desirable goal is to have a fiscally
mangeagable satellite constellation capable of making detections when ground based EO/IR resources are
unavailable. This idea has been postulated on numerous occasions and is a current development within the missile
defense realm; however, it is an expensive undertaking. In order to create a cheaper and more viable alternative, the
use of small-satellites with on-board sensors was analyzed.
A) Constellation Selection
For simplicity of analysis, the IRIDIUM6,7
satellite constellation
was implemented into MATLAB using a built-in, fixed time step
integrator, ode113. The IRIDIUM constellation was selected
primarily due to its optimized orbital parameters for coverage of -60
to +60 degrees latitude and because of its known orbital parameters.
This is congruent with the weather data available for use in the
simulation. Accordingly, the constellation’s effective
implementation and functioning was dependent on the sensor
selection.
B) IR Sensor Selection
While it would be ideal to have an off-the-shelf, space-grade IR
camera with a wide field of view (FOV), this technology was still under-development. In fact, NASA placed a call
for proposals for this technology in May of 20148
. Operating on this assumption, the proposed technical
specifications for this component were used in the analysis. Ideally, with the proliferation of this commercially
available component, this constellation will be more viable.
5. American Institute of Aeronautics and Astronautics
5
Figure 7. No Clouds and No Orbit
C) MATLAB Implementation
Implementing 66 orbiting satellites in MATLAB proved to be tricky. Initially, it was necessary to define the
various orbital parameters of each satellite’s starting position. Subsequently, to ensure proper orbit propagation and
to represent accurately global coverage, the orbit positions were transitioned to different GMST zones. Depending
on the initial orbital position, the current GMST was dispersed so that the satellites in the program were
representative of a real scenario. From this point, the satellites needed to be propagated. Consequently, the
numerical tool, ode113, was used along with the initial state vector and perturbing forces on the bodies9,10
. As with
the missile propagation, all perturbing forces were implemented such as lunar and solar effects and atmospheric drag
if the spacecraft was below 860 kilometers. Since the trajectories for the missiles were so short in duration, and the
constellation has global coverage, the satellites were only propagated for one period. This sufficiently demonstrated
the effectiveness without running lengthy and unnecessary scenarios. Accordingly, as a check for accuracy, ground
tracks for both missile trajectories and satellite orbits were implemented and can be observed in Fig. 6. Blue circles
indicate satellite ground tracks while red diamonds indicate missile trajectories.
VI. Simulations
In order to portray the ameliorating effects of the implementation of the satellite constellation and deleterious
effects of cloud coverage, several test scenarios were conducted. The first case to be observed was the simulated
launch of seven missiles to be observed from twenty-five ground locations through no cloud coverage. For the
purposes of this analysis, the percent of degradation was used to rate the conditions. Accordingly, this test scenario
served as a baseline from which to measure. The image of this initial simulation can be observed in Fig. 7. The
trajectory time was maintained at twelve minutes for all
simulations so the altitude would not surpass that of the
satellites to be implemented.
Notably, there was no degradation due to lack of LOS or
cloud cover. However, with the addition of cloud coverage,
ground sensors experienced significant periods of attenuation.
This can be seen in Fig. 8 and the specific attenuated sites and
corresponding blackout times listed in hh:mm:ss can be seen in
Table 1.
Figure 6. Satellite and Missile Ground Tracks
6. American Institute of Aeronautics and Astronautics
6
Figure 8. Clouds and No Orbits
Figure 9. Clouds and Orbits
Table 1. Sensor Attenuation Simulation 1
Subsequently, the satellite constellation was implemented in order
to mitigate some of the negative effects of cloud coverage on the
ground sensors. The results from this simulation are depicted in
Fig. 9 and Table 2. In this scenario, the best possible situation is
presented: the satellite orbiting immediately over the missile
trajectory.
Table 2. Sensor Attenuation Simulation 2
Site Time Target % Time
Portugal 0:01:00 3 8.33
Patagonia 0:08:01 6 66.81
Algeria 0:00:00 1 0
From Table 2, it can be noted that the addition of the satellite
constellation completely mitigated the effects of cloud coverage.
Notably, this occurrence is the idealistic situation in which the
missile trajectory was observable for the duration of the missile flight
time. While results like this were not typical, one could observe another trajectory-orbit crossing and note that at
least a portion of the trajectory was observed from the orbiting satellite; indeed, the satellite proved to be beneficial
in times of weather attenuation.
While the potential usefulness of the constellation is immense, it does have specific limitations. As the altitudes
of the missiles increases, the observability from the satellites decreases substantially while the usefulness of ground
sensors increases. This is due to the low altitude nature of the constellation’s orbits.
VI. A Look Forward
As seen by this analysis of a small satellite constellation, the implementation can prove indispensable in the
future for the defense of the nation. While systems such as the Space Based Infrared System (SBIRS) can cost
upwards of $1.1 billion11
, the small satellite constellation could cost as little as $20 million. This cost is assuming a
satellite cost of $250,000, weight of one kilogram, and launch cost per kilogram of $20,000. In the scheme of space
operations, a low Earth orbit constellation is a highly frugal option for monitoring. Of course, some obstacles should
be overcome. Due to the nature of the mission, a desirable characteristic of the satellite is to house a high-resolution
and wide FOV IR camera. As previously stated, there are currently options under development, but there are none
currently available to the market. Having a high-resolution camera with a wide FOV will assist in ensuring mission
success.
In addition to the benefits of implementing a satellite constellation are the benefits of preemptively
characterizing the environment. While the allocation of sensor resources was not performed in this analysis, it could
be done to conserve time in battle-space scenarios. Altogether, the combination of a satellite constellation and
preemptive environment characterization would result in a more efficient fulfillment of the mission at hand.
Site Time Target % Time
Portugal 0:01:00 3 8.33
Patagonia 0:8:01 6 66.81
Algeria 0:03:01 1 25.14
7. American Institute of Aeronautics and Astronautics
7
References
1
Yates, H. W., Taylor, H. J., “Infrared Transmission of the Atmosphere” U.S. Naval Research Laboratory., Rept 5453,
Washington D.C., June 8, 1960.
2
Bourke, P., “Intersection of a Line and a Sphere.” (November 1992) (http://paulbourke.net/geometry/circlesphere/)
[Cited January 13, 2016].
3
Lawrence, G. M., “The Relationship between Relative Humidity and the Dewpoint Temperature in Moist Air.” Max Planck
Institude for Chemistry, Mainz, Germany, 2004. [Cited January 10, 2016].
4
Iyer, Shiva (27 Dec 2013) Solve Lambert’s Problem in Two-Body Dynamics
(http://www.mathworks.com/matlabcentral/fileexchange/44789-solve-lambert-s-problem-in-two-body-dynamics) MATLAB
Central File Exchange. [Cited September 15, 2015].
5
Vallado, D. A., Fundamentals of Astrodynamics and Applications, McGraw-Hill, New York, 1997.
[Cited September 10, 2015].
6
Iridium. “Iridium Next Constellation.” (November 14, 2012)
(http://www.esa.int/spaceinimages/Images/2012/11/Iridium_NEXT_constellation) . [Cited January 17, 2016].
7
Pratt, R. S., Raines, A. R., Fossa, E. C., Temple, A. M., “An Operational Performance Overview of the IRIDIUM Low Earth
Orbit Satellite System.” (Q2 1999) (http://kt.agh.edu.pl/~brus/satelity/Iridium-Leo.pdf). [Cited October 20, 2015].
8
NASA Goddard Space Flight Center (5 May 2014) NASA Solicitation: Visible and IR Camera Systems For Low Earth Orbit,
GEO, and Interplanetary Spaceflight. (http://www.spaceref.com/news/viewsr.html?pid=45664) [Cited December 10, 2015].
9
Cabrera, N., “MATLAB GUI Visualization of Classical Orbital Elements.” California Polytechnic State University, San Luis
Obispo, California, 2010. [Cited September 10, 2015].
10
Frees, E., “An Analysis of N-Body Trajectory Propagation.” California Polytechnic State University, San Luis Obispo,
California, 2010. [Cited September 3, 2015].
11
Gruss, M., “Lockheed Martin Examines Cost-cutting Options for SBIRS.” (December 8, 2014)
(http://spacenews.com/42887lockheed-martin-examines-cost-cutting-options-for-sbirs/) [Cited January 20, 2016].