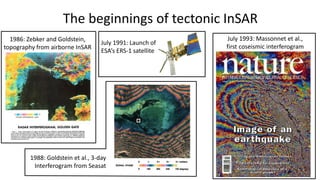
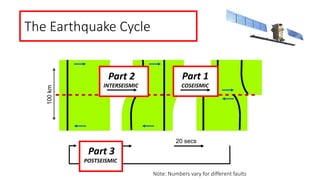
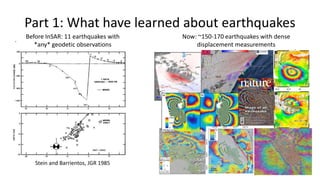
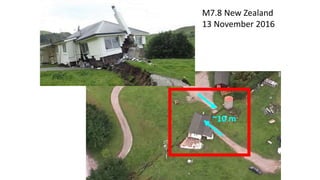
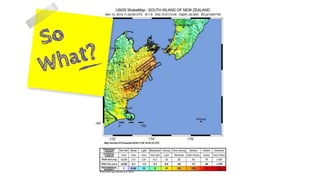
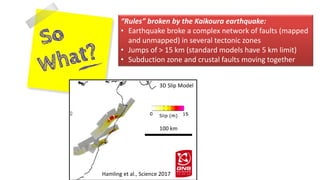
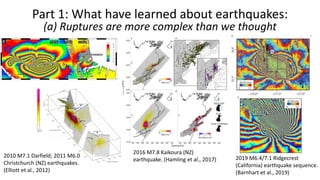
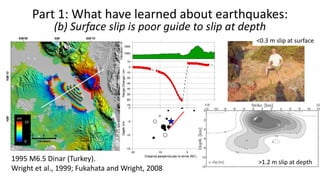
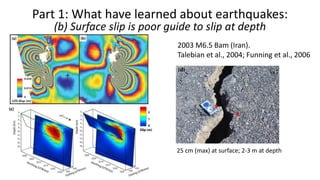
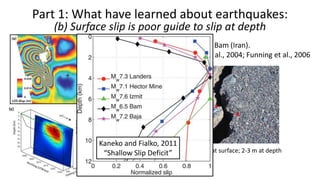
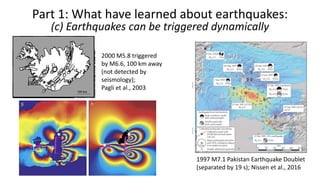
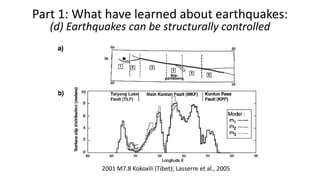
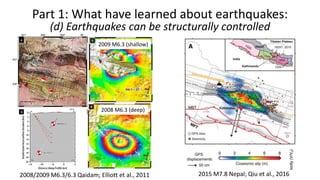
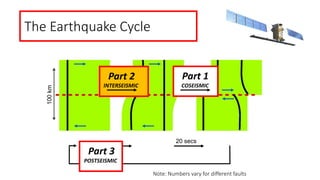
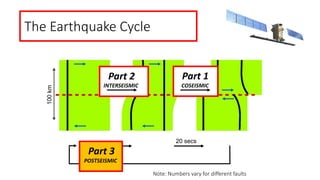
(a) Tectonic InSAR has provided insights into earthquake processes over the past 3 decades since its beginnings in the 1980s. Measurements from over 150 earthquakes have shown that ruptures can be more complex than expected and that surface slip is a poor indicator of slip at depth. Earthquakes have also been found to trigger other quakes dynamically or be structurally controlled.
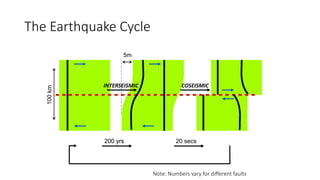
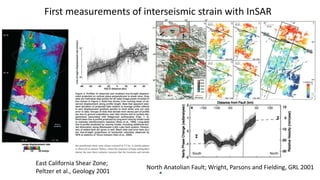
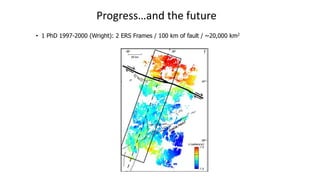
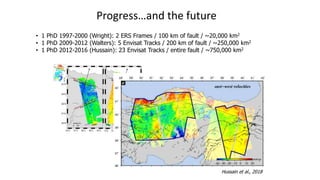
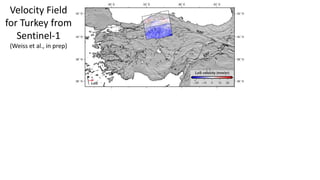
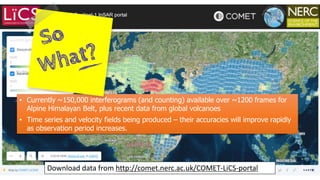
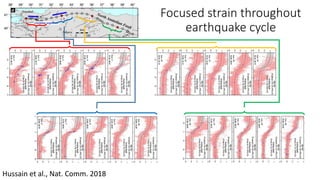
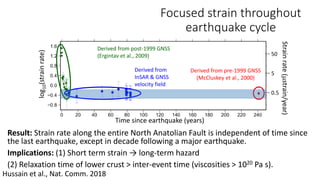
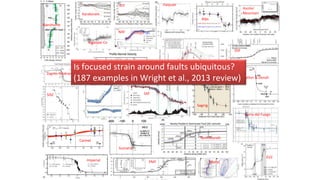
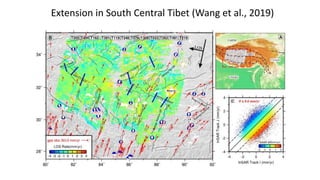
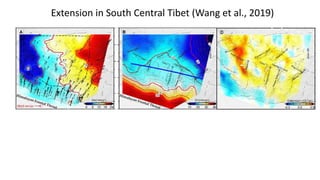
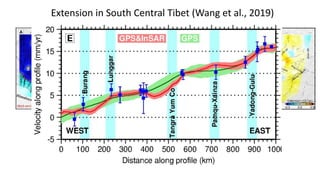
(b) Interseismic strain accumulation along faults can now be measured using large InSAR data stacks, finding focused strain that may be constant throughout the earthquake cycle. However, uncertainties remain about applicability in all regions.
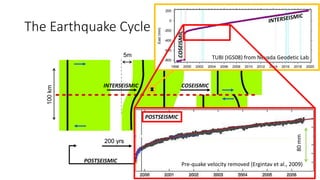
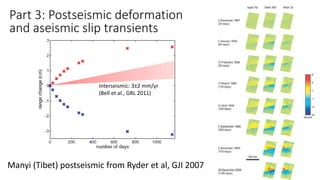
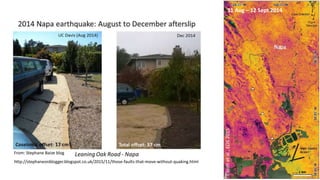
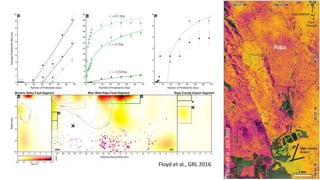
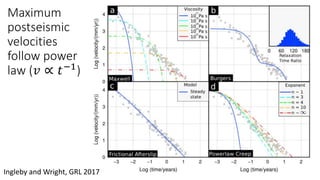
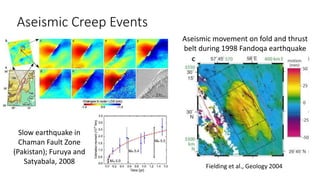
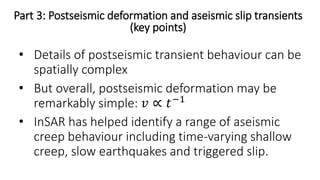
(c) Postseismic deformation and aseismic slip transients exhibit complex spatial patterns but overall decay


![Polymer [ बहुलक ] Chemistry Notes PDF - Irfanullah Mehar - JJ Sir Chemistry.pdf](https://cdn.slidesharecdn.com/ss_thumbnails/polymerchemistrynotespdf-irfanullahmehar-jjsirchemistry-260210172118-3f9b37f7-thumbnail.jpg?width=640&height=640&fit=bounds)

![ANIMAL_CELL_,_TISSUE_AND_ORGAN_CULTURE[1].pptx](https://cdn.slidesharecdn.com/ss_thumbnails/animalcelltissueandorganculture1-260204172026-4462b440-thumbnail.jpg?width=640&height=640&fit=bounds)


