SlideShare a Scribd company logo
1 of 20
Download to read offline
Reassessment of Probabilistic Seismic Hazard in the Marmara Region
by Erol Kalkan, Polat Gülkan, Nazan Yilmaz, and Mehmet Çelebi
Abstract In 1999, the eastern coastline of the Marmara region (Turkey) witnessed
increased seismic activity on the North Anatolian fault (NAF) system with two dam-
aging earthquakes (M 7.4 Kocaeli and M 7.2 Düzce) that occurred almost three
months apart. These events have reduced stress on the western segment of the NAF
where it continues under the Marmara Sea. The undersea fault segments have been
recently explored using bathymetric and reflection surveys. These recent findings
helped scientists to understand the seismotectonic environment of the Marmara basin,
which has remained a perplexing tectonic domain. On the basis of collected new data,
seismic hazard of the Marmara region is reassessed using a probabilistic approach.
Two different earthquake source models: (1) the smoothed-gridded seismicity model
and (2) fault model and alternate magnitude-frequency relations, Gutenberg–Richter
and characteristic, were used with local and imported ground-motion-prediction
equations. Regional exposure is computed and quantified on a set of hazard maps
that provide peak horizontal ground acceleration (PGA) and spectral acceleration
at 0.2 and 1.0 sec on uniform firm-rock site condition (760 m=sec average shear wave
velocity in the upper 30 m). These acceleration levels were computed for ground mo-
tions having 2% and 10% probabilities of exceedance in 50 yr, corresponding to return
periods of about 2475 and 475 yr, respectively. The maximum PGA computed (at rock
site) is 1.5g along the fault segments of the NAF zone extending into the Marmara Sea.
The new maps generally show 10% to 15% increase for PGA, 0.2 and 1.0 sec spectral
acceleration values across much of Marmara compared to previous regional hazard
maps. Hazard curves and smooth design spectra for three site conditions: rock, soil,
and soft-soil are provided for the Istanbul metropolitan area as possible tools in future
risk estimates.
Introduction
The Marmara region houses one-third of Turkey’s popu-
lation and is one of the most tectonically active regions in
Eurasia. In the last century, this region (Fig. 1) experienced
unusual seismic activity with nine strong events having M ≥
7:0 (M moment magnitude). In 1999, two destructive
earthquakes (Kocaeli and Düzce) occurred in the eastern part
of the Marmara region on the North Anatolian fault (NAF)
system. This strike-slip fault system cuts across northern
Turkey for more than 1200 km and accommodates
∼25 mm=yr right-lateral slip between the Anatolian and
Eurasian plates (Straub et al. 1997; McClusky et al. 2000).
Since 1939, the NAF system has produced nine large earth-
quakes in a consistently westward-propagating sequence
(Fig. 2); the only exception is the most recent large earth-
quake (Düzce) that occurred east of the second most-recent
earthquake (Kocaeli). This pattern of earthquake propagation
was recognized long ago (Ketin, 1969; Ambraseys, 1970;
Barka, 1992; Stein et al., 1997).
The Kocaeli earthquake (M 7.4) is the most recent event
that occurred on the south of the eastern border of the
Istanbul province, which is located in the heart of the Mar-
mara region. Today, this most-populated city in Europe is
under threat of much publicized forecasted earthquakes.
Two fault systems located south and southeast of Istanbul
(the Yalova fault segment and the northern boundary fault)
have the potential to rupture (Parsons et al., 2000; Hubert–
Ferrari et al., 2000). Based on a renewal model, the probabil-
ity of occurrence of M 7.0 and greater earthquakes in the
Marmara region that could directly influence the Istanbul
metropolitan area was computed as 44 18% in the next
30 yr (Parsons, 2004). As implied by the level of seismic
risk, critical assessment of the regional seismic hazard is
of paramount importance to facilitate and support a wide
range of earthquake engineering applications.
The current regulatory seismic zoning map of Turkey,
including the Marmara region, was developed using a Bayes-
ian estimation based on then available earthquake catalog
and ground-motion-prediction equations (GMPEs) originally
developed from western U.S. ground motion data (Gülkan
et al., 1993). This choice was dictated by the paucity of
2127
Bulletin of the Seismological Society of America, Vol. 99, No. 4, pp. 2127–2146, August 2009, doi: 10.1785/0120080285
strong-motion records in the country at the time. In the past
15 yr, a number of strong-motion records have been recorded
in Turkey, mainly from the 1999 Kocaeli M 7.4 and Duzce
M 7.2 events, and hence, prompted development of national
GMPEs (e.g., Gülkan and Kalkan, 2002; Kalkan and Gülkan,
2004; Ulusay et al., 2004). In addition, tracing of new fault
segments beneath the Marmara Sea has helped better under-
standing of the seismotectonic environment of the Marmara
basin (Le Pichon et al., 2001; Armijo et al., 2002; Le Pichon
et al., 2003; Armijo et al., 2005).
Seismic hazard of the Marmara region has been studied
previously (Atakan et al., 2002; Erdik et al., 2004). These
studies are based on broadly described fault segments under
the Marmara Sea and nonindigenous GMPEs from the 1990s.
In our study, the regional seismic hazard is reassessed by
considering detailed submarine faults and using the latest
generation of GMPEs. The next generation of attenuation
(NGA) relations (Boore and Atkinson, 2008; Campbell and
Bozorgnia, 2008; Chiou and Youngs, 2008) are used in ad-
dition to the GMPE of Kalkan and Gülkan, developed based
on data from shallow crustal tectonic environment of Turkey.
The weight assigned to the local GMPE is set equal to total
weight of the NGA relations.
In computing the probabilisticseismic hazard, weinclude
two different earthquake source models: (1) smoothed-
gridded seismicity model and (2) fault model, similar to those
used in the development of the 2008 USGS National Seismic
Hazard Maps (Petersen et al. 2008). The first model assumes
that historical large earthquakes have in general taken place
in locations where epicenters of smaller earthquakes have ac-
cumulated (Kafka and Walcott, 1998; Kafka, 2002). This
model is based on the earthquake catalog and characterizes
Figure 1. Seismicity of the Marmara region based on M ≥6:0 events (A.D. 1509–1999). The numbers of earthquakes are given in
parentheses. Faults-1* type faults were recently visualized using bathymetric images and seismic reflection surveys (Le Pichon et al.,
2001; Armijo et al., 2002; Le Pichon et al., 2003; Armijo et al., 2005) and Faults-2** type faults are previously known faults (Saroglu
et al., 1992); see Table 1 for epicenter coordinates, magnitudes, and depths of earthquakes.
Figure 2. Westward propagating sequence of earthquakes on the North Anatolian fault system since 1939.
2128 E. Kalkan, P. Gülkan, N. Yilmaz, and M. Çelebi
thehazardfromearthquakesbetweenM 4.0and6.5.Thefaults
contributeto the hazard for earthquakes larger than M 6.5. The
hazard calculation is the sum of the smoothed-gridded seis-
micity model (for M ≤6:5) and the fault model (for M ≤6:5).
Seismic hazard of Marmara is computed and projected
on a set of hazard maps. These hazard maps show the PGA
and spectral accelerations (SA) at 0.2 and 1.0 sec on uniform
firm-rock site condition (VS30 760 m=sec). In the interest
of completeness, site amplification maps are also provided to
estimate the ground motion at stiff-soil (VS30 360 m=sec)
and soft-soil (VS30 180 m=sec) sites. These acceleration
levels were computed for 2% and 10% probabilities of ex-
ceedance in 50 yr corresponding to return periods of about
2475 and 475 yr, respectively. The seismic hazard exposures
in the vicinity of Istanbul metropolitan area are also exam-
ined, and a series of hazard curves and smooth design spectra
for three site categories are provided.
Regional Tectonic Setting
For the purpose of this study, the Marmara region is de-
fined as the rectangular area bounded by latitudes 39°–43° N
and longitudes of 26°–32° E. The area is one of the most
tectonically active regions of Turkey as evidenced by the
number of large earthquakes (M ≥6:0) that have occurred
between 1509 and 1999 (Fig. 1). Many of these events were
M ≥7:0 and generated on or in proximity of the NAF system.
Moderate to large earthquakes with M ≥6:0 have also oc-
curred on fault segments situated well away from the NAF.
Figure 3 depicts the distribution of all distinct events with
M ≥4:0 that occurred in the period 1901–2004. The figure
also shows the breakdown of the number of earthquakes
within each magnitude interval.
The Marmara region has a complex and heterogeneous
fault system as shown in Figure 4. The 1200 km long NAF
fault system extends from the east of the region toward the
Bay of Izmit. In the east at the junction of the Marmara Sea,
the NAF system is controlled by right-lateral strike-slip
faults, while the plate boundary changes into a transtensional
system that has opened a deep-basin below the Marmara Sea
(Okay et al., 2000). There is no evidence of a single, con-
tinuous, purely strike-slip fault under the Marmara Sea, but
there is a complex segmented fault system with large normal
components. This fault system has been identified from seis-
mic reflection surveys (Smith et al., 1995; Parke et al.,
1999). In the past a series of strong earthquakes has ruptured
the NAF zone in this region. Kocaeli and Düzce were the lat-
est events in a westward-propagating earthquake sequence
that began with the M 7.9 Erzincan earthquake in 1939
on this fault system. This progression has since generated
nine M ≥7 earthquakes. When the 1912 event that occurred
in the west of the Marmara Sea is taken into account, a seis-
mic gap that has not ruptured for more than 200 yr is iden-
tified (Fig. 2). This crosses close to the northern shoreline of
the Marmara Sea (Barka, 1992; Stein et al., 1997). This seis-
mic gap is around 150–160 km long and possesses the po-
tential to generate an M ≥7 earthquake (Hubert-Ferrari et al.
2000). Coulomb stress calculations indicate that shear stress
increased in the aftermath of the 1999 Kocaeli earthquake on
the fault segments below the sea, which may indicate their
likely impact on the rupture potential (Parsons et al., 2000).
The measured slip vectors in the Anatolian plate with
respect to the stable Eurasian plate exhibit a generally antic-
lockwise rotation and an increase in total displacement to-
ward the west caused by the increasing westward pull of
the Hellenic subduction system located southwest of Turkey
Figure 3. Seismicity of the Marmara region during the 103 years between 1901 and 2004. The numbers of earthquakes are given in
parentheses.
Reassessment of Probabilistic Seismic Hazard in the Marmara Region 2129
(McClusky et al., 2000). This dynamic structure pushes
the Marmara region in a northerly path. The NAF system
within the Marmara region can account for 22 3 mm=yr
right-lateral slip (Straub et al., 1997; McClusky et al., 2000).
On the basis of Le Pichon et al. (2001), we assigned
23 mm=yr slip-rate to major faults below the Marmara Sea;
for the rest of the fault segments, the slip-rate distribution
from Global Positioning System (GPS) measurements given
in Straub et al. (1997) were used. The slip-rate distributions
assigned to fault segments agree with tectonic (Barka and
Kadinsky–Cade, 1988; McClusky et al., 2000; Yaltirak,
2002; Seeber et al., 2004; Aksoy et al., 2006; Motagh et al.,
2007) and kinematic simulation-based (Pulido et al., 2004)
studies.
General Methodology
Based on our current state of knowledge about the seis-
micity and tectonic environment of the Marmara basin,
regional probabilistic seismic hazard analysis (PSHA) is per-
formed using two different classes of earthquake source
models: (1) a smoothed-gridded seismicity model and (2) a
fault model. The firstmodel is based on the earthquake catalog
and characterizes the hazard from earthquakes between M 4.0
and 6.5. The faults contribute to the hazard for earthquakes
larger than M 6.5. As a recurrence forecasting process, the
Poisson equation (time independent) is used to estimate the
probability of exceedance over finite time interval.
Earthquake Catalog
The earthquake catalog includes events from historical
and instrumental seismicity. The magnitude, epicenter coor-
dinates, and depth of all events with M ≥6:0 are listed in
Table 1 (M ≥7:0 events are in bold type). These events were
compiled from different sources (see Data and Resources
section) that use different intensity scales: (1) Earthquake
Research Department, General Directorate of Disaster Affair
of Turkey; (2) Kandilli Observatory, Boğaziçi University;
(3) International Seismological Centre of UK; and (4) the
U.S. Geological Survey. Magnitude scales of all events were
converted to moment magnitude (M) through a set of empiri-
cal equations derived based on Turkish earthquakes (Yenier
et al., 2008). These equations are listed in descending order
of priority of the scales selected to convert to M.
M 0:571Ms 2:484; 3:0 ≤ Ms <5:5 (1a)
M 0:817Ms 1:176; 5:5 ≤ Ms ≤7:7 (1b)
M 0:953ML 0:422; 3:9 ≤ ML ≤6:8 (1c)
M 0:764Md 1:379; 3:7 ≤ Md ≤6:0 (1d)
M 1:104mb 0:194; 3:5 ≤ mb ≤6:3 (1e)
In compiling the catalog of events, fore- and aftershocks
were removed using the declustering methodology (Gardner
and Knopoff, 1974); this simple algorithm requires no tuning
parameters, thus the results are easily reproducible. In addi-
tion, events before 1901 were excluded due to catalog incom-
pleteness. For the 103 yr time period between 1901 and
Figure 4. Active faults in the Marmara region (NAF).
2130 E. Kalkan, P. Gülkan, N. Yilmaz, and M. Çelebi
2004, the catalog completeness was tested by plotting the
cumulative number of events against time (Al-Tarazi and
Sandvol, 2007); Figure 5 depicts the distribution of all dis-
tinct events between M 4.0–5.0 and M 5.0–6.0. When events
with magnitudes 5.0 and 6.0 are considered, these plots are
approximately linear for the 103 yr period. Similar analyses
were made for the magnitude intervals 4–5, 5–6, and 6 . We
computed completeness levels of M 4.0 or greater since 1964
and M 5.0 or greater since 1901.
Earthquake Recurrence
For the computation of smoothed-gridded seismicity, a
catalog having discrete independent earthquakes was asso-
ciated with the Gutenberg–Richter (GR) earthquake recur-
rence relation:
log N a bM; (2)
where N is the annual number of earthquakes of magnitude
equal to or greater than M, 10a
is the mean yearly number of
earthquakes of magnitude greater than or equal to zero, and b
describes the relative likelihood of large and small earth-
quakes. As the number of larger magnitude earthquakes de-
creases compared to those of smaller magnitudes, the b-value
increases.
For the Marmara region, the 100 yr long data set is more
complete for small events than is the 2000 yr long data set
and yields b 0:60; whereas the 2000 yr long data set re-
sults in a lower b-value and consequently assigns higher
Table 1
Marmara Region Earthquakes with M ≥6:0 (A.D. 1509–1999)
Number Year Month Day Latitude Longitude Depth (km) M*
Approximate Rupture
Length (km)†
Source‡
1 1509 9 10 40.90 28.70 - 6.7 24 1
2 1556 5 10 40.60 28.00 - 6.7 24 1
3 1625 5 18 40.30 26.00 - 6.6 21 1
4 1659 2 17 40.50 26.40 - 6.7 24 1
5 1672 2 14 39.50 26.00 6.6 19 1
6 1719 5 25 40.70 29.80 - 6.8 29 1
7 1737 3 6 40.00 27.00 - 6.6 19 1
8 1766 5 22 40.80 29.00 - 6.6 21 1
9 1766 8 5 40.60 27.00 - 6.8 29 1
10 1855 2 28 40.10 28.60 - 6.6 21 1
11 1894 7 10 40.70 29.60 - 6.8 26 1
12 1905 4 15 40.20 29.00 6.6 19 4
13 1912 8 10 40.60 27.20 16 7.4 100 4
14 1919 11 18 39.20 27.40 - 7.0 44 2
15 1928 5 3 39.64 29.14 10 6.1 7 4
16 1935 1 4 40.40 27.49 30 6.7 24 4
17 1939 9 22 39.07 29.94 10 7.1 54 4
18 1939 10 19 39.07 26.94 10 6.6 19 4
19 1942 6 16 40.80 27.8 20 6 6 4
20 1943 6 20 40.85 30.51 10 6.6 19 4
21 1944 6 25 39.05 29.26 - 6.1 7 2
22 1944 10 6 39.48 26.56 40 7.0 44 4
23 1953 3 18 39.99 27.36 10 6.6 19 1
24 1956 2 20 39.89 30.49 40 6.4 13 4
25 1957 5 26 40.67 31.00 10 6.7 24 1
26 1961 11 28 40.00 26.30 - 6.0 6 4
27 1964 10 6 40.30 28.23 34 6.9 36 2
28 1966 8 21 40.33 27.40 12 6.0 6 4
29 1967 7 22 40.70 30.70 - 6.7 24 1
30 1970 3 28 39.21 29.51 18 7.1 54 2
31 1971 5 25 39.03 29.74 24 6.1 7 3
32 1975 3 27 40.42 26.14 5 6.7 24 3
33 1976 8 25 39.30 28.80 33 6.0 6 4
34 1976 9 6 39.06 29.00 11 6.6 19 4
35 1999 8 17 40.76 29.97 18 7.4 100 5
36 1999 11 12 40.74 31.21 25 7.2 66 5
*
Moment magnitude values are converted from MS (as given by Aki, 1983) using equation (1c). M ≥7:0
events are in bold type.
†
Based on Wells and Coppersmith (1994) empirical formulations.
‡
(1) Ambraseys (2006), (2) Papazachos and Papazachou (1997), (3) U.S. Council of National Seismic
System (CNSS) Catalog, (4) Kandilli Observatory and Earthquake Research Institute, and (5) Gulkan
and Kalkan (2002).
Reassessment of Probabilistic Seismic Hazard in the Marmara Region 2131
mean rate of transcendence for larger events (Ambraseys,
2002). A b 0:69 for the same region considering the
100 yr long earthquake catalog with M ≥5:5 events is re-
ported by Crowley and Bommer (2006). For the entire
Marmara region, the b-value was estimated as 0.72 using
maximum likelihood method (Weichert, 1980) based on
the 103 yr catalog; this method accounts for variable
completeness. No uncertainty associated with the b-value
was considered since the single b-value calculated herein
is in good agreement with the values reported in previous
studies. Thereafter, a values were computed for each cell
and spatially smoothed over a grid of 0:05° × 0:05° in lati-
tude and longitude using two-dimensional Gaussian filters
with a decay of 50 km. Such a fine grid resulted in hazard
computations at about 9600 grid sites.
Source Models
Smoothed-Gridded Seismicity Model. The contribution of
background events to hazard is calculated using the
smoothed-gridded seismicity model (Frankel, 1995; Kafka,
2002). This model addresses the aleatoric uncertainty in the
location of future earthquakes, thus allowing spatially sta-
tionary seismicity while eliminating the subjectivity in delin-
eation of areal sources. This seismicity model requires a
declustered earthquake catalog for computation of Poisso-
nian earthquake recurrence rates. In this model, events that
100
200
300
400
500
600
700
1910 1919 1928 1937 1946 1955 1964 1973 1982 1991 2000
CumulativeNumber
M 4.0 - 5.0
0
20
40
60
80
1901 1910 1919 1928 1937 1946 1955 1964 1973 1982 1991 2000
Years
CumulativeNumber
M 5.0 - 6.0
Figure 5. Incompleteness test for earthquakes that occurred in the Marmara region for M 4–5 (upper) and M 5–6 (lower) considering a
103 yr time interval (between 1901 and 2004).
2132 E. Kalkan, P. Gülkan, N. Yilmaz, and M. Çelebi
are not assigned to specific faults are assumed to be potential
seismogenic sources and are spatially gridded to cells. First,
we count the number of earthquakes ni with magnitude
greater than Mref in each cell i of a grid with spacing of
0.05° in latitude and 0.05° in longitude. This count repre-
sents the maximum likelihood estimate of 10a
for that cell
(Weichert, 1980; Bender, 1983) for earthquakes above
Mref. The values of ni are converted from cumulative values
(number of events above Mref) to incremental values (num-
ber of events from Mref to Mref ΔM) using the Herrmann
formula (Herrmann, 1977). The grid of ni values is then
smoothed spatially by multiplying by a Gaussian function
with correlation distance c. For each cell i, the smoothed va-
lue ~ni is obtained from (Frankel, 1995)
~ni
P
j
nje Δ2
ij=c2
P
j
e Δ2
ij=c2 : (3)
In this equation, ~ni is normalized to preserve the total number
of events, and Δij is the distance between the ith and jth
cells. The sum is taken over cells j within a distance of
3c of cell i. The annual probability of exceeding specified
ground motions is calculated for a grid of sites using ~ni from
equation (3). For each site, the values of ~ni are binned by
their distance from that site, so that Nk denotes the total of
~ni values for cells within a certain distance increment of the
site. Now the annual rate λ u > u0 of exceeding ground
motion u0 at a specific site is determined from a sum over
distance and magnitude (Frankel, 1995)
λ u > u0
X
k
X
l
10 log NK=T b Ml Mref
× P u > u0jDk; Ml ;
(4)
where k is the index for the distance bin, and l is the index for
the magnitude bin; T is the time in years of the earthquake
catalog used to determine Nk. The first factor in the summa-
tion is the annual rate of earthquakes in the distance bin k and
magnitude bin l. P u > u0jDk; Ml is the probability that u
at the site will exceed u0, for an earthquake at distance Dk
with magnitude Ml (Dk is fixed for each bin). This probabil-
ity is dependent on the attenuation relation and the standard
deviation (variability) of the ground motion for any specific
distance and magnitude. For this model, values are computed
from the magnitude 4.0 and larger earthquakes since 1901.
Segmented Fault Source Model. This model is based on the
assumption that large earthquakes occurring in small areas
are likely to belong to the same seismogenic fault or a ho-
mogenous system of faults. This implies that the seismicity is
concentrated on fault planes. In order to utilize the contribu-
tion of the fault sources to regional seismic hazard, four
aspects of each source are examined. These are: (a) style-
of-faulting, (b) location and orientation, (c) slip rate, and
(d) maximum magnitude earthquake expected (Petersen
et al., 2000). All faults that were included in the evaluation
are judged with confidence as active faults with reported slip
rates greater than or equal to 10 mm=yr; other active faults
having slip rates less than 10 mm=yr were not included. For
the faults below the Marmara Sea, we used fault segmenta-
tion data from Le Pichon et al. (2003) and Armijo et al.
(2005). The remainder of the faults was taken from the active
fault map of Turkey (Saroglu et al. 1992) with the caveat that
this map is in the process of being updated. As shown in
Figure 6, the region’s complex fault system is modeled with
48 fault segments and each is assumed to rupture indepen-
dently. The properties of each fault segment are tabulated in
Table 2.
For nonvertical faults, dip angle is an important param-
eter to determine the average fault depth and the projected
Figure 6. Fault segmentation model for the Marmara region (see Table 2 for fault names and their activity rates).
Reassessment of Probabilistic Seismic Hazard in the Marmara Region 2133
distance on the grid to be used in the GMPEs. Because down-
dip width and depth data for each fault are not available to
accurately determine the actual subsurface source geometry,
some of the planar sources were approximated as linear
sources (i.e., 90° dip is assumed for strike-slip faults). Also,
10 km depth is assigned to those faults where reliable depth
information is not available. Also listed in Table 2 are
the approximate slip-rates broadly described from GPS
measurements because only three fault segments: Izmit,
Düzce and Ganos, were studied in detail by paleoseismolo-
gical methods to be able to assess the long-term slip-rates.
Most of the faults that are labeled active are mainly mapped
on the basis of the morphological studies and with simple
spatial correlations with recent known earthquakes. These
issues will remain as constraints on the results presented until
more reliable data on the subsurface geometry and slip rates
for faults become available.
In interpreting our fault segmentation model in Figure 6,
which primarily relies on seismotectonic studies along with
recurrence and locations of historical events, it should be em-
phasized that geometry and recurrence are not totally inde-
pendent of each other. If a fault is modeled with several small
segments instead of fewer large segments, the maximum
magnitude will be lower, and a given slip-rate will require
many more small earthquakes to accommodate a cumulative
seismic moment.
Forthe segmented fault source model, available historical
and instrumented data are not sufficient to determine whether
the GR model or characteristic earthquake (CE) model or hy-
brid model (Youngs and Coppersmith, 1985) is more appro-
priate. Therefore, two different models (GR and CE) were
placed within the logic treewith equal weights. In the CE mod-
el, each of the fault segments considered is assumed to be ca-
pableofrupturingindependentlyandproducingthemaximum
magnitudeearthquake (Mmax)basedonfaultlengthandpoten-
tial rupture depth (Aki, 1983; Schwartz and Coppersmith,
1984). It should be noted that Mmax denotes the maximum
characteristic magnitude. Mmax for each fault segment is com-
puted through empirical relations (Wells and Coppersmith,
1994) and cross-checked with the neighborhood historical
events. To account for the uncertainties in Mmax values,
Mmax is allowed to float along each fault segment in three lim-
its as Mmax σ, Mmax, Mmax σ, and σ is the dispersion in
statistical modeling of Mmax and taken as 0.3 on the basis of
Wells and Coppersmith (1994).
For the faults, we used the following seismic moment
formula to find the activity rate of the characteristic event,
i.e., number of earthquake per year or reciprocal of its recur-
rence interval from
M0 μAD; (5)
where M0 is the seismic moment of the characteristic earth-
quake. The rigidity or shear modulus of the crust is repre-
sented by μ and is taken as 3:0 × 1011 dyne=cm2. A is the
area of the rupture plane (in cm2
), and D is the slip on the
plane (in cm). Time derivative of equation (5) results in a
moment rate as a function of slip-rate
M0
0 μAS; (6)
Table 2
Characteristic Attributes of Fault Segmentation Model
Fault
Segment
Length
(km)
Characteristic
Event (M)
Slip-Rate
(mm=yr)
Activity Rate
(Earthquake/yr)
Fault
Segment
Length
(km)
Characteristic
Event (M)
Slip-Rate
(mm=yr)
Activity Rate
(Earthquake/yr)
F1 45 7.0 20 0.0073 F25 31 6.8 20 0.0095
F2 48 7.0 20 0.0070 F26 44 7.0 20 0.0074
F3 82 7.3 20 0.0049 F27 42 7.0 20 0.0077
F4 31 6.8 20 0.0094 F28 51 7.1 23 0.0077
F5 36 6.9 20 0.0085 F29 62 7.2 23 0.0068
F6 22 6.7 20 0.0119 F30 51 7.1 23 0.0077
F7 28 6.8 20 0.0101 F31 20 6.6 23 0.0148
F8 63 7.2 20 0.0058 F32 16 6.5 20 0.0150
F9 58 7.1 20 0.0062 F33 57 7.1 20 0.0062
F10 40 7.0 20 0.0079 F34 20 6.6 20 0.0128
F11 28 6.8 20 0.0101 F35 41 7.0 20 0.0077
F12 46 7.0 20 0.0072 F36 36 6.9 20 0.0085
F13 21 6.6 20 0.0121 F37 112 7.5 23 0.0045
F14 29 6.8 20 0.0099 F38 36 6.9 18 0.0076
F15 21 6.7 20 0.0121 F39 15 6.5 18 0.0140
F16 66 7.2 20 0.0056 F40 37 6.9 18 0.0075
F17 21 6.6 20 0.0122 F41 30 6.8 18 0.0088
F18 21 6.6 20 0.0124 F42 10 6.3 18 0.0185
F19 90 7.3 20 0.0046 F43 20 6.6 15 0.0096
F20 26 6.7 20 0.0107 F44 22 6.7 15 0.0089
F21 19 6.6 20 0.0133 F45 15 6.5 15 0.0116
F22 23 6.7 20 0.0114 F46 20 6.6 15 0.0096
F23 49 7.1 10 0.0034 F47 30 6.8 20 0.0097
F24 33 6.9 10 0.0045 F48 46 7.0 20 0.0072
2134 E. Kalkan, P. Gülkan, N. Yilmaz, and M. Çelebi
where M0
0 is the moment rate, and S is the slip rate. The seis-
mic moment can be obtained through moment magnitude,
M, from the relation given by Hanks and Kanamori (1979)
M 2=3 log M0 10:7 (7)
By rewriting equation (7), we obtain seismic moment as
log10 M0 1:5M 16:05 (8)
and the activity rate of earthquakes above a minimum mag-
nitude, Mmin, from
N Mmin
μAS
mean M0=earthquake
(9)
On the basis of these formulas, the activity rate for each fault
segment was computed and is listed in Table 2.
The GR model requires computation of a value for each
fault segment, therefore, buffer zones with radius of 10–15 km
were introduced around each fault segment, and events within
each zone were counted. If one event was counted for one
buffer zone, it was not included in any other zones although
it might fall within their radius.
Ground-Motion-Prediction Equations
In the post-1999 period, many ground motion records
were recorded in Turkey. These new data were combined
with the existing national ground motion library to develop
a GMPE to be used for regional hazard assessments (Gülkan
and Kalkan, 2002). The GMPE of Gülkan and Kalkan has the
same functional form as the GMPE of Boore et al. (1997) but
with different coefficients; this model was updated later by
considering a larger data set (Kalkan and Gülkan, 2004). In
the study presented herein, three NGA relations (Boore and
Atkinson, 2008; Campbell and Bozorgnia, 2008; Chiou and
Youngs, 2008) are used in addition to the GMPE of Kalkan
and Gülkan (2004) to compute the ground motions at dis-
tances less than 200 km. The NGA equations have been
derived for shallow crustal earthquakes from a data set
that includes some Turkish strong-motion records. These
equations are found to be applicable for Europe and the
Middle East (Stafford et al., 2008). Figure 7 compares the
attenuation curves based on four different GMPEs computed
for PGA, spectral acceleration (SA) at 0.2 sec, and SA at
1.0 sec. These curves correspond to an M 7.0 event on a
strike-slip fault, and site condition is firm-rock (VS30
760 m=sec). Note that in Kalkan and Gülkan’s GMPE the
larger of the two horizontal components for each record
was processed in the regression, whereas all the NGA equa-
tions use the geometric mean of the two horizontal compo-
nents, which is consistently smaller. For consistency, PGA,
SA at 0.2 sec, and 1.0 sec predictions from KG04 were first
adjusted by 0.9, 0.9, and 0.85, respectively, and then plotted
in Figure 7. These factors, relating maximum horizontal
component to the geometric mean of the two horizontal com-
ponents, were taken from Campbell and Bozorgnia (2008).
As shown, the three NGA relations produce similar results.
For PGA and SA at 0.2 sec, Kalkan and Gülkan’s GMPE
yields slightly lower acceleration values within 5 km of fault
rupture, whereas its predictions are comparable in the inter-
mediate distances (between 5 to 25 km). For SA at 1.0 sec,
Kalkan and Gülkan’s GMPE estimates larger acceleration
values at distances larger than 5 km as compared to the pre-
dictions of the NGA relations.
0.01
0.1
1
10
1 10 100
PeakGroundAcceleration(g)
Kalkan and Gulkan (2004)
Campbell and Bozorgnia (2008)
Chiou and Youngs (2008)
Boore and Atkinson (2008)
0.01
0.1
1
10
1 10 100
Closest Fault Distance (km)
SpectralAccelerationat0.2sec(g)
0.01
0.1
1
10
1 10 100
SpectralAccelerationat1.0sec(g)
Figure 7. Comparison of ground motion predictions from Kalkan and Gülkan (2004) GMPE to three NGA relations (Boore and
Atkinson, 2008; Campbell and Bozorgnia, 2008; Chiou and Youngs, 2008). Plots are for PGA (left panel), SA at 0.2 sec (middle panel),
and SA at 1.0 sec (right panel). Ground-motion prediction is based on an M 7.0 scenario event on a strike-slip fault (with depth of 2.0 km) and
at a uniform firm-rock site (VS30 760 m=sec).
Reassessment of Probabilistic Seismic Hazard in the Marmara Region 2135
Logic Tree
The logic tree constructed for hazard computations is
shown in Figure 8. For smoothed seismicity model, the tree
has 12 branches. For the fault source model, the three has 24
branches. The weight assigned to the local GMPE is set equal
to total weight of the three NGA relations. All relative
weights are subjective and based on what we consider to
be defensible judgment.
Seismic Hazard Results
The seismic hazard is computed for PGA and SA ordinates
at 0.2 sec and 1.0 sec for the uniform firm-rock site condition
(VS30 760 m=sec). The 0.2 and 1.0 sec spectral periods are
selected because they are frequently used to construct a
smooth design spectrum; an appropriate procedure to obtain
a smooth design spectrum from a uniform hazard spectrum is
given in the Federal Emergency Management Association
(FEMA) 356 guidelines (ASCE, 2000). Seismic hazard for
the Marmara region was computed for two ground motion
levels having 2% and 10% probabilities of exceedance in
50 yr and corresponding to return periods of about 2475
(annual probability of exceedance 0:000404) and 475 yr
(annual probability of exceedance 0:0021), respectively.
Figures 9–11 render the mean seismic hazard computed for
PGA, SA at 0.2 sec, and SA at 1.0 sec for 2% and 10% prob-
ability levels. The distribution of PGA and SA ordinates,
shown by the color gradient, indicates a broader scattering
of higher acceleration values toward the south and east of the
Marmara region. For the 2475 yr return period, the maximum
PGA (Fig. 9) at a uniform firm-rock site is computed as 1.5 g;
PGA diminishes to 0.8 g when the return period is set to 475 yr.
Figure 8. Logic tree established for seismic hazard analysis; values in brackets indicate the assigned weight to each cell; Mmax stands for
maximum magnitude.
2136 E. Kalkan, P. Gülkan, N. Yilmaz, and M. Çelebi
Such high values of PGA are observed in the vicinity of fault
segments along the branch of the NAF zone extending into the
Marmara Sea. This zone of large ground motions also corre-
sponds to areas where large numbers of 4 events have oc-
curred since 1901. At the same locations, the maximum SA
at 0.2 sec (Fig. 10) is computed as 2.8 g and 1.8 g at the return
period of 2475 and 475 yr, respectively. The maximum SA at
1.0 sec (Fig. 11) is computed as 1.5 g for a 2475 yr return per-
iod and 0.8 g for a 475 yr return period.
The hazard maps presented in Figures 9–11 are for a uni-
form firm-rock site condition (VS30 760 m=sec). To obtain
motions for average stiff-soil site (VS30 360 m=sec) and
soft-soil site (VS30 180 m=sec), the mapped values should
be modified. It is not possible to provide a constant modifica-
tion factor to transfer the hazard values computed for VS30
760 m=sec to those at VS30 360 m=sec or 180 m=sec be-
cause the three NGA relations utilized have nonlinear site
correction term; that is, site amplification decreases with
Figure 9. Seismic hazard map of the Marmara region for PGA for uniform firm-rock site condition considering 2% (top panel) and 10%
(bottom panel) probability of exceedance in 50 yr.
Reassessment of Probabilistic Seismic Hazard in the Marmara Region 2137
increasing ground motion intensity as surface materials
reach their limit strength and start behaving nonlinearly.
The difference between a linear and nonlinear site correction
term affects the stronger ground motions. In order to predict
the ground motion at soil and soft-soil sites, we computed the
amplification factors (by taking the ratio of hazard results for a
particular VS30 to those for VS30 760 m=sec) at every grid
point and projected them on a series of site amplification maps
in Figures 12 and 13. These maps are generated for PGA and
SA at 0.2 sec, and SA at 1.0 sec considering ground-motion
level at 2% and 10% probability of exceedance in 50 yr. For
both ground motion levels, site amplification factors for
VS30 180 m=sec are almost unity at the locations where
the high PGA values are computed. For VS30 180 m=sec,
Kalkan and Gülkan’s GMPE yields a constant amplification
factor of 1.3 independent of the PGA level. At the PGA level
of 0.3 g and higher, NGA relations yield site amplification
factors less than unity; therefore, combination of four GMPE
Figure 10. Seismic hazard map of the Marmara region for spectral acceleration at 0.2 sec for uniform firm-rock site condition con-
sidering 2% (top panel) and 10% (bottom panel) probability of exceedance in 50 yr.
2138 E. Kalkan, P. Gülkan, N. Yilmaz, and M. Çelebi
within the logic tree results in no site amplification around the
major fault lines. The same applies for SA at 0.2 sec. However,
for SA at 1.0 sec, NGA relations yield amplification factors
greater than unity, thus, soft-soil sites around the major fault
lines are expected to experience a minimum 1.6 times higher
ground motion as compared to the uniform firm-rock sites
considering 2% probability of exceedance in 50 yr. In general,
nonlinearity phenomenaresult inashiftoftheenergy tolonger
response periods. Comparisons between Figures 12 and 13
show that site amplification factors computed for 10% prob-
ability of exceedance level are higher than those for 2%
probability of exceedance level because nonlinearity is more
pronounced for higher PGA and spectral accelerationvalues at
2% probability of exceedance level. Note that about 20%
deamplification is predicted by NGA formulas at higher fre-
quencies such as 0.2 sec for soft-soil compared to rock when
ground motions are high.
Seismic Hazard of the Istanbul Metropolitan Area
The northern segments of the Marmara Sea faults are
about 10–15 km from the southern coastline of Istanbul
Figure 11. Seismic hazard map of the Marmara region for spectral acceleration at 1.0 sec for uniform firm-rock site condition con-
sidering 2% (top panel) and 10% (bottom panel) probability of exceedance in 50 yr.
Reassessment of Probabilistic Seismic Hazard in the Marmara Region 2139
Figure 12. Site amplification map of the Marmara region for PGA, SA (0.2 sec), and SA (1.0 sec) considering 2% probability of ex-
ceedance. Ratio of ground-motion estimate between VS30 180 m=sec and VS30 760 m=sec (left panels). Ratio of ground-motion es-
timate between VS30 360 m=sec and VS30 760 m=sec (right panels).
2140 E. Kalkan, P. Gülkan, N. Yilmaz, and M. Çelebi
Figure 13. Site amplification map of the Marmara region for PGA, SA (0.2 sec), and SA (1.0 sec) considering 10% probability of
exceedance. Ratio of ground motion estimate between VS30 180 m=sec and VS30 760 m=sec (left panels). Ratio of ground motion
estimate between VS30 360 m=sec and VS30 760 m=sec (right panels).
Reassessment of Probabilistic Seismic Hazard in the Marmara Region 2141
proper (Fig. 4), while two-thirds of the city remains within
20–30 km radius of fault segments F29 and F30 (Fig. 6).
These fault segments when ruptured independently have
the potential to generate an event with magnitude greater
than 7 (see Table 2 for their characteristic magnitudes).
Intense PGA level is expected particularly in southern parts
of Istanbul where the Istanbul Strait opens to the Marmara
Sea. The level of shaking gradually diminishes toward the
north. The predicted PGA ranges between 0.3 and 0.4 g
for 475 yr return period in southern parts of Istanbul; esti-
mated PGA increases to as much as 0.45 g on the shoreline
west of Istanbul. The 2475 yr return period pushes this
envelope from 0.5 to 0.7 g level. The results of the previous
study by Gülkan et al. (1993), constituting the fundament of
the regulatory seismic zoning map of Turkey, reveal PGA dis-
tribution about 0.4 g around Istanbul metropolitan area for
475 yr return period, in good agreement with our predictions.
For the Istanbul metropolitan area seismic hazard curves are
plotted in Figure 14 for PGA, SA at 0.2 sec, and SA at 1.0 sec
by considering a uniform firm-rock, soil, and soft-soil sites.
The two horizontal reference lines drawn indicate 2% and
10% probability levels.
For the Istanbul c area, site-dependent design spectra
are computed next by using the PSHA-based uniform hazard
spectra following the FEMA-356 procedure. The smooth
design spectrum for each of three site categories are produced
for 10% probability of exceedance in 50 yr; the resultant
smooth spectra are shown in Figure 15. The design spectra
based on the regulatory Turkish Seismic Code (TSC; Ministry
of Public Works and Settlement, 2007) are also plotted on the
same figure for comparison. In this figure, Z4, Z3, and Z2
denote the TSC-2007 site classifications; they roughly corre-
spond to VS30 180, 360, and 760 m=sec, respectively.
TSC-2007 design spectra well envelope the smooth design
spectra and remain on the conservative side. It should be noted
that TSC-2007 does not consider distance to fault as a param-
eter in constructing the design spectrum and assumes that the
design spectrum based on a specific site category is invariant
within a seismic zone; Turkey is divided into five seismic
zones, and the southern part of Istanbul is located in zone 1
designated as the most active seismic zone. The PSHA results
presented here and the previous study by Kalkan and Gülkan
(2004) suggest that Turkish code-based spectrum should
havedistancedependencesimilartotheInternationalBuilding
Code (International Conference of Building Officials [ICBO],
2006) to achieve realistic design spectral values consistent
with regional hazard conditions. For distances close to faults,
design spectrum may be constructed as the lower spectral
values computed from a deterministic-based approach (where
a characteristic event dominates the hazard) and probability-
based approach; for farther distances the probabilistic-based
approach may govern the design spectrum. A suite of deter-
ministic-based design spectra have been already developed
for Turkey (Kalkan and Gülkan, 2004).
Conclusions
This paper presents a reassessment of the seismic hazard
in the Marmara region on the basis of recent findings on sea
bottom surveys and enhanced ground motion library from
recent national events. All potential sources of seismic activity
that might contribute to ground motions were identified and
characterized by examining geologic, tectonic, historic, and
instrumental evidence. The methodology applied here is
similar to that used in the development of the most recent
U.S. seismic hazard maps. Two models of seismic sources
were combined and employed with different GMPEs for the
Figure 14. Seismic hazard curves for the Istanbul metropolitan area computed for PGA, SA at 0.2 sec, and SA at 1.0 sec for uniform firm
rock (VS30 760 m=sec), soil (VS30 360 m=sec), and soft-soil (VS30 180 m=sec) sites. Horizontal dashed lines identify 2% and 10%
probability of a given acceleration level being exceeded.
2142 E. Kalkan, P. Gülkan, N. Yilmaz, and M. Çelebi
Figure 15. Comparison of PSHA-based smooth design spectrum (10% probability of exceedance in 50 yr) constructed on uniform
hazard spectrum with Turkish Seismic Code (2007) design spectrum for rock, soil, and soft-soil site conditions (TSC site classes are
Z2, Z3, Z4, respectively). Damping ratio is 5%.
Reassessment of Probabilistic Seismic Hazard in the Marmara Region 2143
assessment of hazard quantified in terms of peak ground ac-
celeration andspectral accelerations at0.2 and1.0 secwith 2%
and 10% probability of exceedance in 50 yr. Confidence of
time-dependent models is inevitably hampered by short-term
completeness of the earthquake catalog, and as a result tem-
poral occurrence of earthquakes was assumed to be Poisso-
nian; because of that our model represents an upper bound
compared to time-dependent models. Hazard maps were com-
puted for generic rock site conditions; for soil and soft-soil
sites, a set of amplification maps is provided.
The reliability of the hazard analyses conducted here
depends primarily on precision with which uncertainty in
magnitude, epicenter, recurrence, fault segmentation, and
their cross effects can be identified and characterized. For
instance, the maximum magnitude at each fault segment
was estimated from the fault length and approximate slip
rates. In order to account for the associated uncertainties,
maximum magnitude is allowed to float along each fault
segment. This treatment results in enhanced hazard level
especially for long return periods (e.g., 2475 yr), while its
influence remains marginal for short return periods (e.g.,
475 yr). The uncertainty in recurrence is also a factor because
of the many big events in the 1999–present period. We have
ignored the faults with less than 10 mm=yr average slip. In
addition, we did not model faults as unsegmented as another
branch in the logic tree. Considering them in PSHA may
increase the hazard in the region.
Results in this study show that for the 475 yr return
period, PGA may reach to as much as a 0.4 g level in the south-
ern areas of Istanbul and the Yalova region and 0.5 g level
around the shoreline to the west of the metropolitan area at
a closest distance of about 10 km to the active Marmara
Sea faults. PGA increases to the 0.8 g level at much closer
distances near the fault segments. In the Istanbul downtown
area, the average PGA is expected to measure at 0.4 g for
10% probability of exceedance in the next 50 yr. Our analyses
for the Istanbul metropolitan area lack very fine grid-spacing,
and the results presented herein are intended to give a general
perspective on the anticipated level of shaking.
The principal differences of the study described here and
the previous studies focused on the Marmara region (e.g.,
Atakan et al., 2002; Erdik et al., 2004) are that the GMPE
developed from indigenous sources has been given prepon-
derance in the weighting. The characteristics attributed to the
seismogenic sources and use of NGA relations are also major
improvements. The new maps (Figs. 9–11) generally show
10% to 15% increase for PGA, 0.2 sec, and 1.0 sec spectral
acceleration across much of Marmara compared to previous
regional hazard maps.
The seismic hazard maps provided here are intended to
shed some light on future assessments of risk to structures in
the defined Marmara region and, we hope, serve as a remind-
er to improve design and construction practices to minimize
losses of life and property.
Data and Resources
Digital data of hazard curves for the entire Marmara
region including the Istanbul metropolitan area and hazard
maps presented herein can beviewed in color and downloaded
fromwww.erolkalkan.com/Marmara_Research(lastaccessed
June 2009). Seismic hazard maps are also integrated with the
3D-Earth model at www.erolkalkan.com/MIM (last accessed
June 2009) to provide an interactive interface. Events that use
different intensity scales compiled from different sources are
the Earthquake Research Department, General Directorate of
Disaster Affairs of Turkey (http://angora.deprem.gov.tr/
ivmekataloglaren.htm, last accessed June 2009); Kandilli
Observatory, Boğaziçi University (http://www.koeri.boun
.edu.tr/sismo/Mudim/katalog.asp, last accessed June 2009);
International Seismological Centre (http://www.isc.ac.uk/
doc/products/catalogue.html, last accessed June 2009); and
the U.S. Geological Survey (http://neic.usgs.gov/neis/epic/,
last accessed June 2009).
Acknowledgments
We wish to thank Tom Parsons for providing us the coordinates of fault
segments under the Marmara Sea and Steve Harmsen for his generous sup-
port on the latest version of the USGS seismic hazard code and also for
reviewing this article. Special thanks are extended to Luke J. Blair who
plotted the maps in a GIS environment, Thomas Holzer, Vladimir Graizer,
and Tianqin Cao for their insightful reviews. Comments and suggestions by
Julian J. Bommer, Fleur O. Strasser, and an anonymous reviewer were help-
ful in improving the technical quality of the paper.
References
Aki, K. (1983). Seismological evidence in support of the existence of char-
acteristic earthquakes, Earthquake Notes 54, 60–61.
Aksoy, M. E., M. Meghraoui, M. Ferry, Z. Çakir, S. Akyüz, V. Karabacak,
and E. Altunel (2006). Fault characteristics, segmentation and paleo-
seismology along the 9 August 1912 Ganos earthquake-rupture (North
Anatolian Fault, Turkey), Geophys. Res. Abstr. 8, 10002.
Al-Tarazi, E., and E. Sandvol (2007). Alternative Models of Seismic Hazard
Evaluation along the Jordan—Dead Sea Transform, Earthq. Spectra
32, no. 1, 1–19.
Ambraseys, N. N. (1970). Some characteristic features of the Anatolian fault
zone, Tectonophysics 9, 143–165.
Ambraseys, N. N. (2002). The seismic activity of the Marmara region over
the last 2000 years, Bull. Seismol. Soc. Am. 92, no. 1, 1–18.
Ambraseys, N. N. (2006). Comparison of frequency of occurrence of earth-
quakes with slip rates from long-term seismicity data: The cases of
Gulf of Corinth, Marmara Sea and Dead Sea Fault Zone, Geophys.
J. Int. 165, 516–526.
American Society of Civil Engineers (ASCE) (2000). Prestandard and Com-
mentary for the Seismic Rehabilitation of Buildings, prepared for the
SAC Joint Venture, Federal Emergency Management Agency, FEMA-
356, Washington D.C.
Armijo, R., B. Meyer, S. Navarro, G. King, and A. Barka (2002). Asym-
metric slip partitioning in the Marmara Sea pull-apart: A clue to
propagation processes of the North Anatolian fault? Terranova 14,
80–86.
Armijo, R., N. Pondard, B. Meyer, G. Üçarcus, B. Mercier de Lépinay,
J. Malavieille, S. Dominguez, M.-A. Gustcher, S. Schmidt, C. Beck,
N. Çağatay, Z. Cakir, C. Imren, K. Eris, B. Natalin, S. Özalaybey,
L. Tolun, I. Lefèvre, L. Seeber, L. Gasperini, C. Rangin, Ö. Emre,
and K. Sarikavak (2005). Submarine fault scarps in the Sea of Mar-
2144 E. Kalkan, P. Gülkan, N. Yilmaz, and M. Çelebi
mara pull-apart (North Anatolian Fault): Implications for seismic ha-
zard in Istanbul, Geochem. Geophys. Geosyst. 6, no. 6, 1–29.
Atakan, K., A. Ojeda, M. Meghraoui, A. A. Barka, M. Erdik, and A. Bodare
(2002). Seismic hazard in Istanbul following the 17 August 1999 Izmit
and 12 November 1999 Düzce earthquakes, Bull. Seismol. Soc. Am.
92, no. 1, 466–482.
Barka, A. (1992). The North Anatolian fault zone, Annales Tectonicae 6,
164–195.
Barka, A., and K. Kadinsky-Cade (1988). Strike-slip fault geometry in
Turkey and its influence on earthquake activity, Tectonics 7, no. 3,
663–684.
Bender, B. (1983). Maximum likelihood estimation of b values for magni-
tude grouped data, Bull. Seismol. Soc. Am. 73, 831–851.
Boore, D. M., and G. Atkinson (2008). Ground motion prediction equations
for the average horizontal component of PGA, PGV, and 5%-damped
PSA at spectral periods between 0.01 s and 10.0 s, Earthq. Spectra 24,
no. 1, 99–138.
Boore, D. M., W. B. Joyner, and T. E. Fumal (1997). Equations for estimat-
ing horizontal response spectra and peak acceleration from western
North American earthquakes: A summary of recent work, Seism.
Res. Lett. 68, no. 1, 128–153.
Campbell, K., and Y. Bozorgnia (2008). NGA ground motion model for the
geometric mean horizontal component of PGA, PGV, PGD and 5%
damped linear elastic response spectra for periods ranging from
0.01 s to 10 s, Earthquake Spectra 24, no. 1, 139–171.
Chiou, B., and R. Youngs (2008). An NGA model for the average horizontal
component of peak ground motion and response spectra, Earthq. Spec-
tra 24, no. 1, 173–215.
Crowley, H., and J. J. Bommer (2006). Modeling seismic hazard in earth-
quake loss models with spatially distributed exposure, Bull. Eq. Eng. 4,
249–273.
Erdik, M., M. Demircioğlu, K. Şeşetyan, E. Durukal, and B. Siyahi (2004).
Earthquake hazard in Marmara region, Turkey, Soil Dyn. Earthq. Eng.
24, 605–631.
Frankel, A. (1995). Mapping seismic hazard in the Central and Eastern
United States, Seism. Res. Lett. 66, no. 4, 8–21.
Gardner, J. K., and L. Knopoff (1974). Is the sequence of earthquakes in
southern California, with aftershocks removed, Poissonian? Bull. Seis-
mol. Soc. Am. 64, 1363–1367.
Gülkan, P., and E. Kalkan (2002). Attenuation modeling of recent earth-
quakes in Turkey, J. Seism. 6, no. 3, 397–409.
Gülkan, P., A. Koçyiğit, M. S. Yücemen, V. Doyuran, and N. Başöz (1993).
A seismic zones map of Turkey derived from recent data, Middle East
Technical University, Earthquake Engineering Research Center
Report No. 93-01, (in Turkish).
Hanks, T. C., and H. Kanamori (1979). A moment magnitude scale, J.
Geophys. Res. 84, 2348–2350.
Herrmann, R. B. (1977). Recurrence Relations, Earthquake Notes 88,
47–49.
Hubert-Ferrari, A., A. A. Barka, E. Jacquess, S. S. Nalbant, B. Meyer, R.
Armijo, P. Tapponier, and G. C. P. King (2000). Seismic hazard in the
Marmara Sea following the Izmit earthquake, Nature 404, 269–272.
International Conference of Building Officials (ICBO) (2006). International
Building Code, Whittier, CA.
Kafka, A. L. (2002). Statistical analysis of the hypothesis that seismicity
delineates areas where future large earthquakes are likely to occur
in the central and eastern United States, Seism. Res. Lett. 73, no. 6,
992–1003.
Kafka, A. L., and J. R. Walcott (1998). How well does the spatial distri-
bution of smaller earthquakes forecast the locations of larger earth-
quakes in the northwestern United States? Seism. Res. Lett. 69,
428–440.
Kalkan, E., and P. Gülkan (2004). Site-dependent spectra derived
from ground motion records in Turkey, Earthq. Spectra 20, no. 4,
1111–1138.
Ketin, I. (1969). Uber die nordanatolische Horizontalverschiebung, Bull.
Min. Res. Explor. Inst. Turkey 72, 1–28.
Le Pichon, X., A. M. C. Sengor, E. Demirbag, C. Rangin, C. Imren,
R. Armijo, N. Gorur, N. Cagatay, B. Mercier de Lepinay, B. Meyer,
R. Saatcilar, and B. Tok (2001). The active main Marmara fault, Earth
Planet. Sci. Lett. 192, 595–616.
Le Pichon, X., N. Chamot-Rooke, C. Rangin, and A. M. C. Sengor (2003).
The North Anatolian Fault in the Marmara Sea 2003, J. Geophys. Res.
B Solid Earth Planets 108, 2170–2179.
McClusky, S.27 coauthors (2000). Global Positioning System constraints
on plate kinematics and dynamics in the eastern Mediterranean and
Caucasus, J. Geophys. Res. 105, 5695–5719.
Ministry of Public Works and Settlement (2007). Turkish Seismic Code,
Specification for Structures to be Built in Disaster Areas, Ankara,
Turkey.
Motagh, M., J. Hoffmann, B. Kampes, M. Baes, and J. Zschau (2007). Strain
accumulation across the Gazikoy—Saros segment of the North
Anatolian Fault inferred from Persistent Scatterer Interferometry
and GPS measurements, Earth Planet Sci. Lett. 255, no. 30, 432–444.
Okay, A. I., A. K. Ozcan, C. Imren, A. B. Guney, E. Demirbag, and I. Kuscu
(2000). Active faults and evolving strike-slip basins in the Marmara
Sea, northwest Turkey: A multichannel seismic reflection study,
Tectonophysics 321, 189–218.
Papazachos, B. C., and C. Papazachou (1997). The Earthquakes of Greece,
ZITI Ed., Thessaloniki 304 p.
Parke, J. R., T. A. Minshull, and G. Anderson (1999). Active faults in the
Marmara Sea, western Turkey, imaged by seismic reflection profiles,
Terra Nova 11, 223–227.
Parsons, T. (2004). Recalculated probability of M ≥ 7 earthquakes
beneath the Marmara Sea, Turkey, J. Geophys. Res. 109, B05304,
1–21.
Parsons, T., S. Toda, R. S. Stein, A. Barka, and J. H. Dieterich (2000).
Heightenined odds of large earthquake near Istanbul: An interac-
tion-based probability calculation, Science 288, 661–665.
Petersen, Mark D., Arthur D. Frankel, Stephen C. Harmsen, Charles S.
Mueller, Kathleen M. Haller, Russell L. Wheeler, Robert L. Wesson,
Yuehua Zeng, Oliver S. Boyd, David M. Perkins, Nicolas Luco,
H. Field Edward, Chris J. Wills, and S. Rukstales Kenneth (2008).
Documentation for the 2008 Update of the United States National
Seismic Hazard Maps, U.S. Geol. Surv. Open-File Rept. 2008-
1128, 61 p.
Petersen, M. D., T. R. Toppozada, T. Cao, C. H. Cramer, M. S. Reichle, and
W. A. Bryant (2000). Active fault near-source zones within and bor-
dering the State of California for the 1997 Uniform Building Code,
Earthq. Spectra 16, no. 1, 69–83.
Pulido, N., A. Ojeda, K. Atakan, and T. Kubo (2004). Strong ground motion
estimation in the Marmara Sea region (Turkey) based on scenario
earthquake, Tectonophysics 39, 357–374.
Saroglu, F., O. Emre, and I. Kuscu (1992). Active fault map of Turkey, Ma-
den Tetkik ve Arama (in Turkish).
Schwartz, D. P., and K. J. Coppersmith (1984). Fault behavior and charac-
teristic earthquakes: Examples from the Wasatch and San Andreas
fault zones, J. Geophys. Res. 89, no. B7, 5681–5698.
Seeber, L., O. Emre, M. H. Cormier, C. C Sorlien, C. M. G. McHugh,
A. Polonia, N. Ozer, N. Cagatay, and The team of the 2000 R/V Urania
Cruise in the Marmara Sea (2004). Uplift and subsidence from oblique
slip: The Ganos Marmara bend of the North Anatolian Transform,
western Turkey, Tectonophysics 391, no. 1–4, 239–258.
Smith, A. D., T. Taymaz, F. Oktay, H. Yuce, B. Alpar, H. Basaran,
J. A. Jackson, S. Kara, and M. Simsek (1995). High-resolution seismic
profiling in the Marmara Sea (Northwest Turkey); Late Quaternary
sedimentation and sea-level changes, Spec. Pap. Geol. Soc. Am.
107, 923–936.
Stafford, P. J., F. O. Strasser, and J. J. Bommer (2008). An evaluation of the
applicability of the NGA models to ground motion prediction in the
Euro-Mediterranean region, Bull. Earthquake Eng. 6, no. 2, 149–177.
Stein, R. S., A. A. Barka, and J. H. Dieterich (1997). Progressive failure on
North Anatolian Fault since 1939 by earthquake stress triggering, Geo-
phys. J. Int. 128, 594–604.
Reassessment of Probabilistic Seismic Hazard in the Marmara Region 2145
Straub, C., H-G. Kahle, and C. Schindler (1997). GPS and geologic esti-
mates of the tectonic activity in the Marmara Sea region, NWAnatolia,
J. Geophys. Res. 102, no. 27, 587–601.
Ulusay, R., E. Tuncay, H. Sonmez, and C. Gokceoglu (2004). An attenua-
tion relationship based on Turkish strong-motion data and iso-
acceleration map of Turkey, Eng. Geol. 74, no. 3–4, 265–291.
Weichert, D. H. (1980). Estimation of earthquake recurrence parameters for
unequal observation periods for different magnitudes, Bull. Seismol.
Soc. Am. 70, 1337–1356.
Wells, D. L., and K. J. Coppersmith (1994). New empirical relation-
ships among magnitude, rupture length, rupture width, rupture
area, and surface displacement, Bull. Seismol. Soc. Am. 84, no. 4,
974–1002.
Yaltirak, C. (2002). Tectonic evolution of the Marmara Sea and its surround-
ings, Mar. Geol. 190, 493–529.
Yenier, E., O. Erdoğan, and S. Akkar (2008). Empirical Relationships for
Magnitude and Source-To-Site Distance Conversions using Recently
Compiled Turkish Strong-Ground motion Database, The Fourteenth
World Conference on Earthquake Engineering, October 12–17
2008, Beijing, China.
Youngs, R. R., and K. J. Coppersmith (1985). Implications of fault slip rates
and earthquake recurrence models to probabilistic seismic hazard
estimates, Bull. Seismol. Soc. Am. 75, no. 4, 939–964.
U.S. Geological Survey
Western Region Earthquake Hazards Team
MS977, 345 Middlefield Rd.
Menlo Park, California 94025
ekalkan@usgs.gov
Manuscript received 1 November 2007
2146 E. Kalkan, P. Gülkan, N. Yilmaz, and M. Çelebi

More Related Content

What's hot

Bölgesel Depremsellik: Doğu Anadolu Fay Zonu
Bölgesel Depremsellik: Doğu Anadolu Fay ZonuBölgesel Depremsellik: Doğu Anadolu Fay Zonu
Bölgesel Depremsellik: Doğu Anadolu Fay ZonuAli Osman Öncel
 
Gaz ve Deprem İlişkisi: İstanbul Deprem Boşluğu
Gaz ve Deprem İlişkisi: İstanbul Deprem BoşluğuGaz ve Deprem İlişkisi: İstanbul Deprem Boşluğu
Gaz ve Deprem İlişkisi: İstanbul Deprem BoşluğuAli Osman Öncel
 
OBS Seismicity Monitoring in Marmara
OBS Seismicity Monitoring in  MarmaraOBS Seismicity Monitoring in  Marmara
OBS Seismicity Monitoring in MarmaraAli Osman Öncel
 
Marmara Sea: Earthquake Hazard Estimation
Marmara Sea: Earthquake Hazard EstimationMarmara Sea: Earthquake Hazard Estimation
Marmara Sea: Earthquake Hazard EstimationAli Osman Öncel
 
Deprem Verilerinin H/V Oranının Mevsimsel Değişimi
Deprem Verilerinin H/V Oranının Mevsimsel Değişimi Deprem Verilerinin H/V Oranının Mevsimsel Değişimi
Deprem Verilerinin H/V Oranının Mevsimsel Değişimi Ali Osman Öncel
 
Kent Odaklı Mikrobölgeleme: Sivas Örneği
Kent Odaklı Mikrobölgeleme: Sivas ÖrneğiKent Odaklı Mikrobölgeleme: Sivas Örneği
Kent Odaklı Mikrobölgeleme: Sivas ÖrneğiAli Osman Öncel
 
Türkiye'nin Kabuk Yapısı: Jeofizik Veri
Türkiye'nin Kabuk Yapısı: Jeofizik VeriTürkiye'nin Kabuk Yapısı: Jeofizik Veri
Türkiye'nin Kabuk Yapısı: Jeofizik VeriAli Osman Öncel
 
Deprem Tehlike Potansiyeli Araştırması: Antakya Örneği
Deprem Tehlike Potansiyeli Araştırması: Antakya ÖrneğiDeprem Tehlike Potansiyeli Araştırması: Antakya Örneği
Deprem Tehlike Potansiyeli Araştırması: Antakya ÖrneğiAli Osman Öncel
 
An Integrated Study of Gravity and Magnetic Data to Determine Subsurface Stru...
An Integrated Study of Gravity and Magnetic Data to Determine Subsurface Stru...An Integrated Study of Gravity and Magnetic Data to Determine Subsurface Stru...
An Integrated Study of Gravity and Magnetic Data to Determine Subsurface Stru...iosrjce
 
ÖNCEL AKADEMİ: İSTANBUL DEPREMİ
ÖNCEL AKADEMİ: İSTANBUL DEPREMİÖNCEL AKADEMİ: İSTANBUL DEPREMİ
ÖNCEL AKADEMİ: İSTANBUL DEPREMİAli Osman Öncel
 
IGARSS2011_Pernicana.ppt
IGARSS2011_Pernicana.pptIGARSS2011_Pernicana.ppt
IGARSS2011_Pernicana.pptgrssieee
 
Structural interpretation of abakiliki – ugep, using
Structural interpretation of abakiliki – ugep, usingStructural interpretation of abakiliki – ugep, using
Structural interpretation of abakiliki – ugep, usingAlexander Decker
 
Marmara Sea: Tarihsel Deprem Senaryoları
Marmara Sea: Tarihsel Deprem SenaryolarıMarmara Sea: Tarihsel Deprem Senaryoları
Marmara Sea: Tarihsel Deprem SenaryolarıAli Osman Öncel
 
Gravity Predictions for Earthquakes
Gravity Predictions for EarthquakesGravity Predictions for Earthquakes
Gravity Predictions for EarthquakesProfDrAliOsmanncel
 
ÖNCEL AKADEMİ: İSTANBUL DEPREMİ
ÖNCEL AKADEMİ: İSTANBUL DEPREMİÖNCEL AKADEMİ: İSTANBUL DEPREMİ
ÖNCEL AKADEMİ: İSTANBUL DEPREMİAli Osman Öncel
 
ÖNCEL AKADEMİ: İSTANBUL DEPREMİ
ÖNCEL AKADEMİ: İSTANBUL DEPREMİÖNCEL AKADEMİ: İSTANBUL DEPREMİ
ÖNCEL AKADEMİ: İSTANBUL DEPREMİAli Osman Öncel
 
Marmara Sea: Çınarcık Basin
Marmara Sea: Çınarcık BasinMarmara Sea: Çınarcık Basin
Marmara Sea: Çınarcık BasinAli Osman Öncel
 

What's hot (20)

Seismic Risk in SE Turkey
Seismic Risk in  SE TurkeySeismic Risk in  SE Turkey
Seismic Risk in SE Turkey
 
Seismic Risk in Marmara
Seismic Risk in  MarmaraSeismic Risk in  Marmara
Seismic Risk in Marmara
 
Bölgesel Depremsellik: Doğu Anadolu Fay Zonu
Bölgesel Depremsellik: Doğu Anadolu Fay ZonuBölgesel Depremsellik: Doğu Anadolu Fay Zonu
Bölgesel Depremsellik: Doğu Anadolu Fay Zonu
 
Gaz ve Deprem İlişkisi: İstanbul Deprem Boşluğu
Gaz ve Deprem İlişkisi: İstanbul Deprem BoşluğuGaz ve Deprem İlişkisi: İstanbul Deprem Boşluğu
Gaz ve Deprem İlişkisi: İstanbul Deprem Boşluğu
 
OBS Seismicity Monitoring in Marmara
OBS Seismicity Monitoring in  MarmaraOBS Seismicity Monitoring in  Marmara
OBS Seismicity Monitoring in Marmara
 
Marmara Sea: Earthquake Hazard Estimation
Marmara Sea: Earthquake Hazard EstimationMarmara Sea: Earthquake Hazard Estimation
Marmara Sea: Earthquake Hazard Estimation
 
Deprem Verilerinin H/V Oranının Mevsimsel Değişimi
Deprem Verilerinin H/V Oranının Mevsimsel Değişimi Deprem Verilerinin H/V Oranının Mevsimsel Değişimi
Deprem Verilerinin H/V Oranının Mevsimsel Değişimi
 
Beppu geothermal field
Beppu geothermal fieldBeppu geothermal field
Beppu geothermal field
 
Kent Odaklı Mikrobölgeleme: Sivas Örneği
Kent Odaklı Mikrobölgeleme: Sivas ÖrneğiKent Odaklı Mikrobölgeleme: Sivas Örneği
Kent Odaklı Mikrobölgeleme: Sivas Örneği
 
Türkiye'nin Kabuk Yapısı: Jeofizik Veri
Türkiye'nin Kabuk Yapısı: Jeofizik VeriTürkiye'nin Kabuk Yapısı: Jeofizik Veri
Türkiye'nin Kabuk Yapısı: Jeofizik Veri
 
Deprem Tehlike Potansiyeli Araştırması: Antakya Örneği
Deprem Tehlike Potansiyeli Araştırması: Antakya ÖrneğiDeprem Tehlike Potansiyeli Araştırması: Antakya Örneği
Deprem Tehlike Potansiyeli Araştırması: Antakya Örneği
 
An Integrated Study of Gravity and Magnetic Data to Determine Subsurface Stru...
An Integrated Study of Gravity and Magnetic Data to Determine Subsurface Stru...An Integrated Study of Gravity and Magnetic Data to Determine Subsurface Stru...
An Integrated Study of Gravity and Magnetic Data to Determine Subsurface Stru...
 
ÖNCEL AKADEMİ: İSTANBUL DEPREMİ
ÖNCEL AKADEMİ: İSTANBUL DEPREMİÖNCEL AKADEMİ: İSTANBUL DEPREMİ
ÖNCEL AKADEMİ: İSTANBUL DEPREMİ
 
IGARSS2011_Pernicana.ppt
IGARSS2011_Pernicana.pptIGARSS2011_Pernicana.ppt
IGARSS2011_Pernicana.ppt
 
Structural interpretation of abakiliki – ugep, using
Structural interpretation of abakiliki – ugep, usingStructural interpretation of abakiliki – ugep, using
Structural interpretation of abakiliki – ugep, using
 
Marmara Sea: Tarihsel Deprem Senaryoları
Marmara Sea: Tarihsel Deprem SenaryolarıMarmara Sea: Tarihsel Deprem Senaryoları
Marmara Sea: Tarihsel Deprem Senaryoları
 
Gravity Predictions for Earthquakes
Gravity Predictions for EarthquakesGravity Predictions for Earthquakes
Gravity Predictions for Earthquakes
 
ÖNCEL AKADEMİ: İSTANBUL DEPREMİ
ÖNCEL AKADEMİ: İSTANBUL DEPREMİÖNCEL AKADEMİ: İSTANBUL DEPREMİ
ÖNCEL AKADEMİ: İSTANBUL DEPREMİ
 
ÖNCEL AKADEMİ: İSTANBUL DEPREMİ
ÖNCEL AKADEMİ: İSTANBUL DEPREMİÖNCEL AKADEMİ: İSTANBUL DEPREMİ
ÖNCEL AKADEMİ: İSTANBUL DEPREMİ
 
Marmara Sea: Çınarcık Basin
Marmara Sea: Çınarcık BasinMarmara Sea: Çınarcık Basin
Marmara Sea: Çınarcık Basin
 

Similar to ÖNCEL AKADEMİ: İSTANBUL DEPREMİ

ÖNCEL AKADEMİ: İSTANBUL DEPREMİ
ÖNCEL AKADEMİ: İSTANBUL DEPREMİÖNCEL AKADEMİ: İSTANBUL DEPREMİ
ÖNCEL AKADEMİ: İSTANBUL DEPREMİAli Osman Öncel
 
Site-dependent Spectra: Ground Motion Records in Turkey
Site-dependent Spectra: Ground Motion Records in TurkeySite-dependent Spectra: Ground Motion Records in Turkey
Site-dependent Spectra: Ground Motion Records in TurkeyAli Osman Öncel
 
ÖNCEL AKADEMİ: İSTANBUL DEPREMİ
ÖNCEL AKADEMİ: İSTANBUL DEPREMİÖNCEL AKADEMİ: İSTANBUL DEPREMİ
ÖNCEL AKADEMİ: İSTANBUL DEPREMİAli Osman Öncel
 
Nakamura Technique for Soil Characterization
Nakamura Technique for Soil CharacterizationNakamura Technique for Soil Characterization
Nakamura Technique for Soil CharacterizationAli Osman Öncel
 
ÖNCEL AKADEMİ: İSTANBUL DEPREMİ
ÖNCEL AKADEMİ: İSTANBUL DEPREMİÖNCEL AKADEMİ: İSTANBUL DEPREMİ
ÖNCEL AKADEMİ: İSTANBUL DEPREMİAli Osman Öncel
 
ÖNCEL AKADEMİ: İSTANBUL DEPREMİ
ÖNCEL AKADEMİ: İSTANBUL DEPREMİÖNCEL AKADEMİ: İSTANBUL DEPREMİ
ÖNCEL AKADEMİ: İSTANBUL DEPREMİAli Osman Öncel
 
Earthquake-prone Zonation of North Bengkulu Based on Peak Ground Acceleration...
Earthquake-prone Zonation of North Bengkulu Based on Peak Ground Acceleration...Earthquake-prone Zonation of North Bengkulu Based on Peak Ground Acceleration...
Earthquake-prone Zonation of North Bengkulu Based on Peak Ground Acceleration...INFOGAIN PUBLICATION
 
موقعیت صفحه توران.pdf
موقعیت صفحه توران.pdfموقعیت صفحه توران.pdf
موقعیت صفحه توران.pdfmahnazsabahi
 
IGARSS11_Stramondo.ppt
IGARSS11_Stramondo.pptIGARSS11_Stramondo.ppt
IGARSS11_Stramondo.pptgrssieee
 
IGARSS11_Stramondo.ppt
IGARSS11_Stramondo.pptIGARSS11_Stramondo.ppt
IGARSS11_Stramondo.pptgrssieee
 
A review of progress in modelling induced geoelectric and
A review of progress in modelling induced geoelectric andA review of progress in modelling induced geoelectric and
A review of progress in modelling induced geoelectric andoilandgas24
 
Seismic Microzonation Study in Tabriz Metropolitan City for Earthquake Risk M...
Seismic Microzonation Study in Tabriz Metropolitan City for Earthquake Risk M...Seismic Microzonation Study in Tabriz Metropolitan City for Earthquake Risk M...
Seismic Microzonation Study in Tabriz Metropolitan City for Earthquake Risk M...IJERA Editor
 
Active Plate Tectonics in Turkey
Active Plate Tectonics in TurkeyActive Plate Tectonics in Turkey
Active Plate Tectonics in TurkeyAli Osman Öncel
 
ÖNCEL AKADEMİ: İSTANBUL DEPREMİ
ÖNCEL AKADEMİ: İSTANBUL DEPREMİÖNCEL AKADEMİ: İSTANBUL DEPREMİ
ÖNCEL AKADEMİ: İSTANBUL DEPREMİAli Osman Öncel
 
Marmara Sea: Deep Seismic Survey
Marmara Sea: Deep Seismic SurveyMarmara Sea: Deep Seismic Survey
Marmara Sea: Deep Seismic SurveyAli Osman Öncel
 
Possible Formation Mechanisms of Earthquake Ionospheric Precursors
Possible Formation Mechanisms of Earthquake Ionospheric PrecursorsPossible Formation Mechanisms of Earthquake Ionospheric Precursors
Possible Formation Mechanisms of Earthquake Ionospheric PrecursorsGlobal Risk Forum GRFDavos
 

Similar to ÖNCEL AKADEMİ: İSTANBUL DEPREMİ (20)

1612375560.pdf
1612375560.pdf1612375560.pdf
1612375560.pdf
 
ÖNCEL AKADEMİ: İSTANBUL DEPREMİ
ÖNCEL AKADEMİ: İSTANBUL DEPREMİÖNCEL AKADEMİ: İSTANBUL DEPREMİ
ÖNCEL AKADEMİ: İSTANBUL DEPREMİ
 
Site-dependent Spectra: Ground Motion Records in Turkey
Site-dependent Spectra: Ground Motion Records in TurkeySite-dependent Spectra: Ground Motion Records in Turkey
Site-dependent Spectra: Ground Motion Records in Turkey
 
ÖNCEL AKADEMİ: İSTANBUL DEPREMİ
ÖNCEL AKADEMİ: İSTANBUL DEPREMİÖNCEL AKADEMİ: İSTANBUL DEPREMİ
ÖNCEL AKADEMİ: İSTANBUL DEPREMİ
 
Nakamura Technique for Soil Characterization
Nakamura Technique for Soil CharacterizationNakamura Technique for Soil Characterization
Nakamura Technique for Soil Characterization
 
ÖNCEL AKADEMİ: İSTANBUL DEPREMİ
ÖNCEL AKADEMİ: İSTANBUL DEPREMİÖNCEL AKADEMİ: İSTANBUL DEPREMİ
ÖNCEL AKADEMİ: İSTANBUL DEPREMİ
 
ÖNCEL AKADEMİ: İSTANBUL DEPREMİ
ÖNCEL AKADEMİ: İSTANBUL DEPREMİÖNCEL AKADEMİ: İSTANBUL DEPREMİ
ÖNCEL AKADEMİ: İSTANBUL DEPREMİ
 
Earthquake-prone Zonation of North Bengkulu Based on Peak Ground Acceleration...
Earthquake-prone Zonation of North Bengkulu Based on Peak Ground Acceleration...Earthquake-prone Zonation of North Bengkulu Based on Peak Ground Acceleration...
Earthquake-prone Zonation of North Bengkulu Based on Peak Ground Acceleration...
 
موقعیت صفحه توران.pdf
موقعیت صفحه توران.pdfموقعیت صفحه توران.pdf
موقعیت صفحه توران.pdf
 
Final.Project.Geophysics
Final.Project.GeophysicsFinal.Project.Geophysics
Final.Project.Geophysics
 
IGARSS11_Stramondo.ppt
IGARSS11_Stramondo.pptIGARSS11_Stramondo.ppt
IGARSS11_Stramondo.ppt
 
IGARSS11_Stramondo.ppt
IGARSS11_Stramondo.pptIGARSS11_Stramondo.ppt
IGARSS11_Stramondo.ppt
 
A review of progress in modelling induced geoelectric and
A review of progress in modelling induced geoelectric andA review of progress in modelling induced geoelectric and
A review of progress in modelling induced geoelectric and
 
Seismic Microzonation Study in Tabriz Metropolitan City for Earthquake Risk M...
Seismic Microzonation Study in Tabriz Metropolitan City for Earthquake Risk M...Seismic Microzonation Study in Tabriz Metropolitan City for Earthquake Risk M...
Seismic Microzonation Study in Tabriz Metropolitan City for Earthquake Risk M...
 
Seismic Microzonation Study in Tabriz Metropolitan City for Earthquake Risk M...
Seismic Microzonation Study in Tabriz Metropolitan City for Earthquake Risk M...Seismic Microzonation Study in Tabriz Metropolitan City for Earthquake Risk M...
Seismic Microzonation Study in Tabriz Metropolitan City for Earthquake Risk M...
 
Relationship Between Fault and Earthquake in sumatera
Relationship Between Fault and Earthquake in sumateraRelationship Between Fault and Earthquake in sumatera
Relationship Between Fault and Earthquake in sumatera
 
Active Plate Tectonics in Turkey
Active Plate Tectonics in TurkeyActive Plate Tectonics in Turkey
Active Plate Tectonics in Turkey
 
ÖNCEL AKADEMİ: İSTANBUL DEPREMİ
ÖNCEL AKADEMİ: İSTANBUL DEPREMİÖNCEL AKADEMİ: İSTANBUL DEPREMİ
ÖNCEL AKADEMİ: İSTANBUL DEPREMİ
 
Marmara Sea: Deep Seismic Survey
Marmara Sea: Deep Seismic SurveyMarmara Sea: Deep Seismic Survey
Marmara Sea: Deep Seismic Survey
 
Possible Formation Mechanisms of Earthquake Ionospheric Precursors
Possible Formation Mechanisms of Earthquake Ionospheric PrecursorsPossible Formation Mechanisms of Earthquake Ionospheric Precursors
Possible Formation Mechanisms of Earthquake Ionospheric Precursors
 

More from Ali Osman Öncel

Riskli Yapılar - Çevre ve Şehircilik
Riskli Yapılar - Çevre ve ŞehircilikRiskli Yapılar - Çevre ve Şehircilik
Riskli Yapılar - Çevre ve ŞehircilikAli Osman Öncel
 
Riskli Yapılar -Çevre ve Şehircilik
Riskli Yapılar -Çevre ve ŞehircilikRiskli Yapılar -Çevre ve Şehircilik
Riskli Yapılar -Çevre ve ŞehircilikAli Osman Öncel
 
Kar Kar Geothermal Field Work
Kar Kar Geothermal Field WorkKar Kar Geothermal Field Work
Kar Kar Geothermal Field WorkAli Osman Öncel
 
High Resolution Earth's Gravitational Field
High Resolution Earth's Gravitational FieldHigh Resolution Earth's Gravitational Field
High Resolution Earth's Gravitational FieldAli Osman Öncel
 
Gravity Predictions for Earthquakes
Gravity Predictions for EarthquakesGravity Predictions for Earthquakes
Gravity Predictions for EarthquakesAli Osman Öncel
 
Geopsy: Seismic Vibration Processing
Geopsy: Seismic Vibration ProcessingGeopsy: Seismic Vibration Processing
Geopsy: Seismic Vibration ProcessingAli Osman Öncel
 
M6.0 2004 Parkfield Earthquake : Seismic Attenuation
M6.0 2004 Parkfield Earthquake : Seismic AttenuationM6.0 2004 Parkfield Earthquake : Seismic Attenuation
M6.0 2004 Parkfield Earthquake : Seismic AttenuationAli Osman Öncel
 
The first earthquake site assessments in alberta canada
The first earthquake site assessments in alberta canadaThe first earthquake site assessments in alberta canada
The first earthquake site assessments in alberta canadaAli Osman Öncel
 

More from Ali Osman Öncel (20)

APA Yazım Kuralları
APA Yazım KurallarıAPA Yazım Kuralları
APA Yazım Kuralları
 
Gravimetri : Ders 14
Gravimetri : Ders 14Gravimetri : Ders 14
Gravimetri : Ders 14
 
Gravimetri : Ders 13
Gravimetri : Ders 13Gravimetri : Ders 13
Gravimetri : Ders 13
 
Gravimetri : Ders 12
Gravimetri : Ders 12Gravimetri : Ders 12
Gravimetri : Ders 12
 
Riskli Yapılar - Çevre ve Şehircilik
Riskli Yapılar - Çevre ve ŞehircilikRiskli Yapılar - Çevre ve Şehircilik
Riskli Yapılar - Çevre ve Şehircilik
 
Riskli Yapılar -Çevre ve Şehircilik
Riskli Yapılar -Çevre ve ŞehircilikRiskli Yapılar -Çevre ve Şehircilik
Riskli Yapılar -Çevre ve Şehircilik
 
Gravimetri : Ders 07
Gravimetri : Ders 07Gravimetri : Ders 07
Gravimetri : Ders 07
 
Gravimetri : Ders 06
Gravimetri : Ders 06Gravimetri : Ders 06
Gravimetri : Ders 06
 
Gravimetri: Ders 05
Gravimetri: Ders 05Gravimetri: Ders 05
Gravimetri: Ders 05
 
Gravimetri : Ders 04
Gravimetri : Ders 04Gravimetri : Ders 04
Gravimetri : Ders 04
 
Gravimetri : Ders 03
Gravimetri : Ders 03Gravimetri : Ders 03
Gravimetri : Ders 03
 
Gravimetri Ders 02
Gravimetri Ders 02Gravimetri Ders 02
Gravimetri Ders 02
 
Gravimetri Ders 01
Gravimetri Ders 01Gravimetri Ders 01
Gravimetri Ders 01
 
Kar Kar Geothermal Field Work
Kar Kar Geothermal Field WorkKar Kar Geothermal Field Work
Kar Kar Geothermal Field Work
 
High Resolution Earth's Gravitational Field
High Resolution Earth's Gravitational FieldHigh Resolution Earth's Gravitational Field
High Resolution Earth's Gravitational Field
 
Gravity Predictions for Earthquakes
Gravity Predictions for EarthquakesGravity Predictions for Earthquakes
Gravity Predictions for Earthquakes
 
H/V User Guidelines
H/V User Guidelines H/V User Guidelines
H/V User Guidelines
 
Geopsy: Seismic Vibration Processing
Geopsy: Seismic Vibration ProcessingGeopsy: Seismic Vibration Processing
Geopsy: Seismic Vibration Processing
 
M6.0 2004 Parkfield Earthquake : Seismic Attenuation
M6.0 2004 Parkfield Earthquake : Seismic AttenuationM6.0 2004 Parkfield Earthquake : Seismic Attenuation
M6.0 2004 Parkfield Earthquake : Seismic Attenuation
 
The first earthquake site assessments in alberta canada
The first earthquake site assessments in alberta canadaThe first earthquake site assessments in alberta canada
The first earthquake site assessments in alberta canada
 

Recently uploaded

Kisan Call Centre - To harness potential of ICT in Agriculture by answer farm...
Kisan Call Centre - To harness potential of ICT in Agriculture by answer farm...Kisan Call Centre - To harness potential of ICT in Agriculture by answer farm...
Kisan Call Centre - To harness potential of ICT in Agriculture by answer farm...Krashi Coaching
 
Organic Name Reactions for the students and aspirants of Chemistry12th.pptx
Organic Name Reactions  for the students and aspirants of Chemistry12th.pptxOrganic Name Reactions  for the students and aspirants of Chemistry12th.pptx
Organic Name Reactions for the students and aspirants of Chemistry12th.pptxVS Mahajan Coaching Centre
 
URLs and Routing in the Odoo 17 Website App
URLs and Routing in the Odoo 17 Website AppURLs and Routing in the Odoo 17 Website App
URLs and Routing in the Odoo 17 Website AppCeline George
 
Separation of Lanthanides/ Lanthanides and Actinides
Separation of Lanthanides/ Lanthanides and ActinidesSeparation of Lanthanides/ Lanthanides and Actinides
Separation of Lanthanides/ Lanthanides and ActinidesFatimaKhan178732
 
CARE OF CHILD IN INCUBATOR..........pptx
CARE OF CHILD IN INCUBATOR..........pptxCARE OF CHILD IN INCUBATOR..........pptx
CARE OF CHILD IN INCUBATOR..........pptxGaneshChakor2
 
Alper Gobel In Media Res Media Component
Alper Gobel In Media Res Media ComponentAlper Gobel In Media Res Media Component
Alper Gobel In Media Res Media ComponentInMediaRes1
 
Concept of Vouching. B.Com(Hons) /B.Compdf
Concept of Vouching. B.Com(Hons) /B.CompdfConcept of Vouching. B.Com(Hons) /B.Compdf
Concept of Vouching. B.Com(Hons) /B.CompdfUmakantAnnand
 
Call Girls in Dwarka Mor Delhi Contact Us 9654467111
Call Girls in Dwarka Mor Delhi Contact Us 9654467111Call Girls in Dwarka Mor Delhi Contact Us 9654467111
Call Girls in Dwarka Mor Delhi Contact Us 9654467111Sapana Sha
 
How to Configure Email Server in Odoo 17
How to Configure Email Server in Odoo 17How to Configure Email Server in Odoo 17
How to Configure Email Server in Odoo 17Celine George
 
BASLIQ CURRENT LOOKBOOK LOOKBOOK(1) (1).pdf
BASLIQ CURRENT LOOKBOOK  LOOKBOOK(1) (1).pdfBASLIQ CURRENT LOOKBOOK  LOOKBOOK(1) (1).pdf
BASLIQ CURRENT LOOKBOOK LOOKBOOK(1) (1).pdfSoniaTolstoy
 
A Critique of the Proposed National Education Policy Reform
A Critique of the Proposed National Education Policy ReformA Critique of the Proposed National Education Policy Reform
A Critique of the Proposed National Education Policy ReformChameera Dedduwage
 
Software Engineering Methodologies (overview)
Software Engineering Methodologies (overview)Software Engineering Methodologies (overview)
Software Engineering Methodologies (overview)eniolaolutunde
 
Sanyam Choudhary Chemistry practical.pdf
Sanyam Choudhary Chemistry practical.pdfSanyam Choudhary Chemistry practical.pdf
Sanyam Choudhary Chemistry practical.pdfsanyamsingh5019
 
ECONOMIC CONTEXT - LONG FORM TV DRAMA - PPT
ECONOMIC CONTEXT - LONG FORM TV DRAMA - PPTECONOMIC CONTEXT - LONG FORM TV DRAMA - PPT
ECONOMIC CONTEXT - LONG FORM TV DRAMA - PPTiammrhaywood
 
Enzyme, Pharmaceutical Aids, Miscellaneous Last Part of Chapter no 5th.pdf
Enzyme, Pharmaceutical Aids, Miscellaneous Last Part of Chapter no 5th.pdfEnzyme, Pharmaceutical Aids, Miscellaneous Last Part of Chapter no 5th.pdf
Enzyme, Pharmaceutical Aids, Miscellaneous Last Part of Chapter no 5th.pdfSumit Tiwari
 
MENTAL STATUS EXAMINATION format.docx
MENTAL     STATUS EXAMINATION format.docxMENTAL     STATUS EXAMINATION format.docx
MENTAL STATUS EXAMINATION format.docxPoojaSen20
 
microwave assisted reaction. General introduction
microwave assisted reaction. General introductionmicrowave assisted reaction. General introduction
microwave assisted reaction. General introductionMaksud Ahmed
 
KSHARA STURA .pptx---KSHARA KARMA THERAPY (CAUSTIC THERAPY)————IMP.OF KSHARA ...
KSHARA STURA .pptx---KSHARA KARMA THERAPY (CAUSTIC THERAPY)————IMP.OF KSHARA ...KSHARA STURA .pptx---KSHARA KARMA THERAPY (CAUSTIC THERAPY)————IMP.OF KSHARA ...
KSHARA STURA .pptx---KSHARA KARMA THERAPY (CAUSTIC THERAPY)————IMP.OF KSHARA ...M56BOOKSTORE PRODUCT/SERVICE
 
Paris 2024 Olympic Geographies - an activity
Paris 2024 Olympic Geographies - an activityParis 2024 Olympic Geographies - an activity
Paris 2024 Olympic Geographies - an activityGeoBlogs
 

Recently uploaded (20)

Staff of Color (SOC) Retention Efforts DDSD
Staff of Color (SOC) Retention Efforts DDSDStaff of Color (SOC) Retention Efforts DDSD
Staff of Color (SOC) Retention Efforts DDSD
 
Kisan Call Centre - To harness potential of ICT in Agriculture by answer farm...
Kisan Call Centre - To harness potential of ICT in Agriculture by answer farm...Kisan Call Centre - To harness potential of ICT in Agriculture by answer farm...
Kisan Call Centre - To harness potential of ICT in Agriculture by answer farm...
 
Organic Name Reactions for the students and aspirants of Chemistry12th.pptx
Organic Name Reactions  for the students and aspirants of Chemistry12th.pptxOrganic Name Reactions  for the students and aspirants of Chemistry12th.pptx
Organic Name Reactions for the students and aspirants of Chemistry12th.pptx
 
URLs and Routing in the Odoo 17 Website App
URLs and Routing in the Odoo 17 Website AppURLs and Routing in the Odoo 17 Website App
URLs and Routing in the Odoo 17 Website App
 
Separation of Lanthanides/ Lanthanides and Actinides
Separation of Lanthanides/ Lanthanides and ActinidesSeparation of Lanthanides/ Lanthanides and Actinides
Separation of Lanthanides/ Lanthanides and Actinides
 
CARE OF CHILD IN INCUBATOR..........pptx
CARE OF CHILD IN INCUBATOR..........pptxCARE OF CHILD IN INCUBATOR..........pptx
CARE OF CHILD IN INCUBATOR..........pptx
 
Alper Gobel In Media Res Media Component
Alper Gobel In Media Res Media ComponentAlper Gobel In Media Res Media Component
Alper Gobel In Media Res Media Component
 
Concept of Vouching. B.Com(Hons) /B.Compdf
Concept of Vouching. B.Com(Hons) /B.CompdfConcept of Vouching. B.Com(Hons) /B.Compdf
Concept of Vouching. B.Com(Hons) /B.Compdf
 
Call Girls in Dwarka Mor Delhi Contact Us 9654467111
Call Girls in Dwarka Mor Delhi Contact Us 9654467111Call Girls in Dwarka Mor Delhi Contact Us 9654467111
Call Girls in Dwarka Mor Delhi Contact Us 9654467111
 
How to Configure Email Server in Odoo 17
How to Configure Email Server in Odoo 17How to Configure Email Server in Odoo 17
How to Configure Email Server in Odoo 17
 
BASLIQ CURRENT LOOKBOOK LOOKBOOK(1) (1).pdf
BASLIQ CURRENT LOOKBOOK  LOOKBOOK(1) (1).pdfBASLIQ CURRENT LOOKBOOK  LOOKBOOK(1) (1).pdf
BASLIQ CURRENT LOOKBOOK LOOKBOOK(1) (1).pdf
 
A Critique of the Proposed National Education Policy Reform
A Critique of the Proposed National Education Policy ReformA Critique of the Proposed National Education Policy Reform
A Critique of the Proposed National Education Policy Reform
 
Software Engineering Methodologies (overview)
Software Engineering Methodologies (overview)Software Engineering Methodologies (overview)
Software Engineering Methodologies (overview)
 
Sanyam Choudhary Chemistry practical.pdf
Sanyam Choudhary Chemistry practical.pdfSanyam Choudhary Chemistry practical.pdf
Sanyam Choudhary Chemistry practical.pdf
 
ECONOMIC CONTEXT - LONG FORM TV DRAMA - PPT
ECONOMIC CONTEXT - LONG FORM TV DRAMA - PPTECONOMIC CONTEXT - LONG FORM TV DRAMA - PPT
ECONOMIC CONTEXT - LONG FORM TV DRAMA - PPT
 
Enzyme, Pharmaceutical Aids, Miscellaneous Last Part of Chapter no 5th.pdf
Enzyme, Pharmaceutical Aids, Miscellaneous Last Part of Chapter no 5th.pdfEnzyme, Pharmaceutical Aids, Miscellaneous Last Part of Chapter no 5th.pdf
Enzyme, Pharmaceutical Aids, Miscellaneous Last Part of Chapter no 5th.pdf
 
MENTAL STATUS EXAMINATION format.docx
MENTAL     STATUS EXAMINATION format.docxMENTAL     STATUS EXAMINATION format.docx
MENTAL STATUS EXAMINATION format.docx
 
microwave assisted reaction. General introduction
microwave assisted reaction. General introductionmicrowave assisted reaction. General introduction
microwave assisted reaction. General introduction
 
KSHARA STURA .pptx---KSHARA KARMA THERAPY (CAUSTIC THERAPY)————IMP.OF KSHARA ...
KSHARA STURA .pptx---KSHARA KARMA THERAPY (CAUSTIC THERAPY)————IMP.OF KSHARA ...KSHARA STURA .pptx---KSHARA KARMA THERAPY (CAUSTIC THERAPY)————IMP.OF KSHARA ...
KSHARA STURA .pptx---KSHARA KARMA THERAPY (CAUSTIC THERAPY)————IMP.OF KSHARA ...
 
Paris 2024 Olympic Geographies - an activity
Paris 2024 Olympic Geographies - an activityParis 2024 Olympic Geographies - an activity
Paris 2024 Olympic Geographies - an activity
 

ÖNCEL AKADEMİ: İSTANBUL DEPREMİ

  • 1. Reassessment of Probabilistic Seismic Hazard in the Marmara Region by Erol Kalkan, Polat Gülkan, Nazan Yilmaz, and Mehmet Çelebi Abstract In 1999, the eastern coastline of the Marmara region (Turkey) witnessed increased seismic activity on the North Anatolian fault (NAF) system with two dam- aging earthquakes (M 7.4 Kocaeli and M 7.2 Düzce) that occurred almost three months apart. These events have reduced stress on the western segment of the NAF where it continues under the Marmara Sea. The undersea fault segments have been recently explored using bathymetric and reflection surveys. These recent findings helped scientists to understand the seismotectonic environment of the Marmara basin, which has remained a perplexing tectonic domain. On the basis of collected new data, seismic hazard of the Marmara region is reassessed using a probabilistic approach. Two different earthquake source models: (1) the smoothed-gridded seismicity model and (2) fault model and alternate magnitude-frequency relations, Gutenberg–Richter and characteristic, were used with local and imported ground-motion-prediction equations. Regional exposure is computed and quantified on a set of hazard maps that provide peak horizontal ground acceleration (PGA) and spectral acceleration at 0.2 and 1.0 sec on uniform firm-rock site condition (760 m=sec average shear wave velocity in the upper 30 m). These acceleration levels were computed for ground mo- tions having 2% and 10% probabilities of exceedance in 50 yr, corresponding to return periods of about 2475 and 475 yr, respectively. The maximum PGA computed (at rock site) is 1.5g along the fault segments of the NAF zone extending into the Marmara Sea. The new maps generally show 10% to 15% increase for PGA, 0.2 and 1.0 sec spectral acceleration values across much of Marmara compared to previous regional hazard maps. Hazard curves and smooth design spectra for three site conditions: rock, soil, and soft-soil are provided for the Istanbul metropolitan area as possible tools in future risk estimates. Introduction The Marmara region houses one-third of Turkey’s popu- lation and is one of the most tectonically active regions in Eurasia. In the last century, this region (Fig. 1) experienced unusual seismic activity with nine strong events having M ≥ 7:0 (M moment magnitude). In 1999, two destructive earthquakes (Kocaeli and Düzce) occurred in the eastern part of the Marmara region on the North Anatolian fault (NAF) system. This strike-slip fault system cuts across northern Turkey for more than 1200 km and accommodates ∼25 mm=yr right-lateral slip between the Anatolian and Eurasian plates (Straub et al. 1997; McClusky et al. 2000). Since 1939, the NAF system has produced nine large earth- quakes in a consistently westward-propagating sequence (Fig. 2); the only exception is the most recent large earth- quake (Düzce) that occurred east of the second most-recent earthquake (Kocaeli). This pattern of earthquake propagation was recognized long ago (Ketin, 1969; Ambraseys, 1970; Barka, 1992; Stein et al., 1997). The Kocaeli earthquake (M 7.4) is the most recent event that occurred on the south of the eastern border of the Istanbul province, which is located in the heart of the Mar- mara region. Today, this most-populated city in Europe is under threat of much publicized forecasted earthquakes. Two fault systems located south and southeast of Istanbul (the Yalova fault segment and the northern boundary fault) have the potential to rupture (Parsons et al., 2000; Hubert– Ferrari et al., 2000). Based on a renewal model, the probabil- ity of occurrence of M 7.0 and greater earthquakes in the Marmara region that could directly influence the Istanbul metropolitan area was computed as 44 18% in the next 30 yr (Parsons, 2004). As implied by the level of seismic risk, critical assessment of the regional seismic hazard is of paramount importance to facilitate and support a wide range of earthquake engineering applications. The current regulatory seismic zoning map of Turkey, including the Marmara region, was developed using a Bayes- ian estimation based on then available earthquake catalog and ground-motion-prediction equations (GMPEs) originally developed from western U.S. ground motion data (Gülkan et al., 1993). This choice was dictated by the paucity of 2127 Bulletin of the Seismological Society of America, Vol. 99, No. 4, pp. 2127–2146, August 2009, doi: 10.1785/0120080285
  • 2. strong-motion records in the country at the time. In the past 15 yr, a number of strong-motion records have been recorded in Turkey, mainly from the 1999 Kocaeli M 7.4 and Duzce M 7.2 events, and hence, prompted development of national GMPEs (e.g., Gülkan and Kalkan, 2002; Kalkan and Gülkan, 2004; Ulusay et al., 2004). In addition, tracing of new fault segments beneath the Marmara Sea has helped better under- standing of the seismotectonic environment of the Marmara basin (Le Pichon et al., 2001; Armijo et al., 2002; Le Pichon et al., 2003; Armijo et al., 2005). Seismic hazard of the Marmara region has been studied previously (Atakan et al., 2002; Erdik et al., 2004). These studies are based on broadly described fault segments under the Marmara Sea and nonindigenous GMPEs from the 1990s. In our study, the regional seismic hazard is reassessed by considering detailed submarine faults and using the latest generation of GMPEs. The next generation of attenuation (NGA) relations (Boore and Atkinson, 2008; Campbell and Bozorgnia, 2008; Chiou and Youngs, 2008) are used in ad- dition to the GMPE of Kalkan and Gülkan, developed based on data from shallow crustal tectonic environment of Turkey. The weight assigned to the local GMPE is set equal to total weight of the NGA relations. In computing the probabilisticseismic hazard, weinclude two different earthquake source models: (1) smoothed- gridded seismicity model and (2) fault model, similar to those used in the development of the 2008 USGS National Seismic Hazard Maps (Petersen et al. 2008). The first model assumes that historical large earthquakes have in general taken place in locations where epicenters of smaller earthquakes have ac- cumulated (Kafka and Walcott, 1998; Kafka, 2002). This model is based on the earthquake catalog and characterizes Figure 1. Seismicity of the Marmara region based on M ≥6:0 events (A.D. 1509–1999). The numbers of earthquakes are given in parentheses. Faults-1* type faults were recently visualized using bathymetric images and seismic reflection surveys (Le Pichon et al., 2001; Armijo et al., 2002; Le Pichon et al., 2003; Armijo et al., 2005) and Faults-2** type faults are previously known faults (Saroglu et al., 1992); see Table 1 for epicenter coordinates, magnitudes, and depths of earthquakes. Figure 2. Westward propagating sequence of earthquakes on the North Anatolian fault system since 1939. 2128 E. Kalkan, P. Gülkan, N. Yilmaz, and M. Çelebi
  • 3. thehazardfromearthquakesbetweenM 4.0and6.5.Thefaults contributeto the hazard for earthquakes larger than M 6.5. The hazard calculation is the sum of the smoothed-gridded seis- micity model (for M ≤6:5) and the fault model (for M ≤6:5). Seismic hazard of Marmara is computed and projected on a set of hazard maps. These hazard maps show the PGA and spectral accelerations (SA) at 0.2 and 1.0 sec on uniform firm-rock site condition (VS30 760 m=sec). In the interest of completeness, site amplification maps are also provided to estimate the ground motion at stiff-soil (VS30 360 m=sec) and soft-soil (VS30 180 m=sec) sites. These acceleration levels were computed for 2% and 10% probabilities of ex- ceedance in 50 yr corresponding to return periods of about 2475 and 475 yr, respectively. The seismic hazard exposures in the vicinity of Istanbul metropolitan area are also exam- ined, and a series of hazard curves and smooth design spectra for three site categories are provided. Regional Tectonic Setting For the purpose of this study, the Marmara region is de- fined as the rectangular area bounded by latitudes 39°–43° N and longitudes of 26°–32° E. The area is one of the most tectonically active regions of Turkey as evidenced by the number of large earthquakes (M ≥6:0) that have occurred between 1509 and 1999 (Fig. 1). Many of these events were M ≥7:0 and generated on or in proximity of the NAF system. Moderate to large earthquakes with M ≥6:0 have also oc- curred on fault segments situated well away from the NAF. Figure 3 depicts the distribution of all distinct events with M ≥4:0 that occurred in the period 1901–2004. The figure also shows the breakdown of the number of earthquakes within each magnitude interval. The Marmara region has a complex and heterogeneous fault system as shown in Figure 4. The 1200 km long NAF fault system extends from the east of the region toward the Bay of Izmit. In the east at the junction of the Marmara Sea, the NAF system is controlled by right-lateral strike-slip faults, while the plate boundary changes into a transtensional system that has opened a deep-basin below the Marmara Sea (Okay et al., 2000). There is no evidence of a single, con- tinuous, purely strike-slip fault under the Marmara Sea, but there is a complex segmented fault system with large normal components. This fault system has been identified from seis- mic reflection surveys (Smith et al., 1995; Parke et al., 1999). In the past a series of strong earthquakes has ruptured the NAF zone in this region. Kocaeli and Düzce were the lat- est events in a westward-propagating earthquake sequence that began with the M 7.9 Erzincan earthquake in 1939 on this fault system. This progression has since generated nine M ≥7 earthquakes. When the 1912 event that occurred in the west of the Marmara Sea is taken into account, a seis- mic gap that has not ruptured for more than 200 yr is iden- tified (Fig. 2). This crosses close to the northern shoreline of the Marmara Sea (Barka, 1992; Stein et al., 1997). This seis- mic gap is around 150–160 km long and possesses the po- tential to generate an M ≥7 earthquake (Hubert-Ferrari et al. 2000). Coulomb stress calculations indicate that shear stress increased in the aftermath of the 1999 Kocaeli earthquake on the fault segments below the sea, which may indicate their likely impact on the rupture potential (Parsons et al., 2000). The measured slip vectors in the Anatolian plate with respect to the stable Eurasian plate exhibit a generally antic- lockwise rotation and an increase in total displacement to- ward the west caused by the increasing westward pull of the Hellenic subduction system located southwest of Turkey Figure 3. Seismicity of the Marmara region during the 103 years between 1901 and 2004. The numbers of earthquakes are given in parentheses. Reassessment of Probabilistic Seismic Hazard in the Marmara Region 2129
  • 4. (McClusky et al., 2000). This dynamic structure pushes the Marmara region in a northerly path. The NAF system within the Marmara region can account for 22 3 mm=yr right-lateral slip (Straub et al., 1997; McClusky et al., 2000). On the basis of Le Pichon et al. (2001), we assigned 23 mm=yr slip-rate to major faults below the Marmara Sea; for the rest of the fault segments, the slip-rate distribution from Global Positioning System (GPS) measurements given in Straub et al. (1997) were used. The slip-rate distributions assigned to fault segments agree with tectonic (Barka and Kadinsky–Cade, 1988; McClusky et al., 2000; Yaltirak, 2002; Seeber et al., 2004; Aksoy et al., 2006; Motagh et al., 2007) and kinematic simulation-based (Pulido et al., 2004) studies. General Methodology Based on our current state of knowledge about the seis- micity and tectonic environment of the Marmara basin, regional probabilistic seismic hazard analysis (PSHA) is per- formed using two different classes of earthquake source models: (1) a smoothed-gridded seismicity model and (2) a fault model. The firstmodel is based on the earthquake catalog and characterizes the hazard from earthquakes between M 4.0 and 6.5. The faults contribute to the hazard for earthquakes larger than M 6.5. As a recurrence forecasting process, the Poisson equation (time independent) is used to estimate the probability of exceedance over finite time interval. Earthquake Catalog The earthquake catalog includes events from historical and instrumental seismicity. The magnitude, epicenter coor- dinates, and depth of all events with M ≥6:0 are listed in Table 1 (M ≥7:0 events are in bold type). These events were compiled from different sources (see Data and Resources section) that use different intensity scales: (1) Earthquake Research Department, General Directorate of Disaster Affair of Turkey; (2) Kandilli Observatory, Boğaziçi University; (3) International Seismological Centre of UK; and (4) the U.S. Geological Survey. Magnitude scales of all events were converted to moment magnitude (M) through a set of empiri- cal equations derived based on Turkish earthquakes (Yenier et al., 2008). These equations are listed in descending order of priority of the scales selected to convert to M. M 0:571Ms 2:484; 3:0 ≤ Ms <5:5 (1a) M 0:817Ms 1:176; 5:5 ≤ Ms ≤7:7 (1b) M 0:953ML 0:422; 3:9 ≤ ML ≤6:8 (1c) M 0:764Md 1:379; 3:7 ≤ Md ≤6:0 (1d) M 1:104mb 0:194; 3:5 ≤ mb ≤6:3 (1e) In compiling the catalog of events, fore- and aftershocks were removed using the declustering methodology (Gardner and Knopoff, 1974); this simple algorithm requires no tuning parameters, thus the results are easily reproducible. In addi- tion, events before 1901 were excluded due to catalog incom- pleteness. For the 103 yr time period between 1901 and Figure 4. Active faults in the Marmara region (NAF). 2130 E. Kalkan, P. Gülkan, N. Yilmaz, and M. Çelebi
  • 5. 2004, the catalog completeness was tested by plotting the cumulative number of events against time (Al-Tarazi and Sandvol, 2007); Figure 5 depicts the distribution of all dis- tinct events between M 4.0–5.0 and M 5.0–6.0. When events with magnitudes 5.0 and 6.0 are considered, these plots are approximately linear for the 103 yr period. Similar analyses were made for the magnitude intervals 4–5, 5–6, and 6 . We computed completeness levels of M 4.0 or greater since 1964 and M 5.0 or greater since 1901. Earthquake Recurrence For the computation of smoothed-gridded seismicity, a catalog having discrete independent earthquakes was asso- ciated with the Gutenberg–Richter (GR) earthquake recur- rence relation: log N a bM; (2) where N is the annual number of earthquakes of magnitude equal to or greater than M, 10a is the mean yearly number of earthquakes of magnitude greater than or equal to zero, and b describes the relative likelihood of large and small earth- quakes. As the number of larger magnitude earthquakes de- creases compared to those of smaller magnitudes, the b-value increases. For the Marmara region, the 100 yr long data set is more complete for small events than is the 2000 yr long data set and yields b 0:60; whereas the 2000 yr long data set re- sults in a lower b-value and consequently assigns higher Table 1 Marmara Region Earthquakes with M ≥6:0 (A.D. 1509–1999) Number Year Month Day Latitude Longitude Depth (km) M* Approximate Rupture Length (km)† Source‡ 1 1509 9 10 40.90 28.70 - 6.7 24 1 2 1556 5 10 40.60 28.00 - 6.7 24 1 3 1625 5 18 40.30 26.00 - 6.6 21 1 4 1659 2 17 40.50 26.40 - 6.7 24 1 5 1672 2 14 39.50 26.00 6.6 19 1 6 1719 5 25 40.70 29.80 - 6.8 29 1 7 1737 3 6 40.00 27.00 - 6.6 19 1 8 1766 5 22 40.80 29.00 - 6.6 21 1 9 1766 8 5 40.60 27.00 - 6.8 29 1 10 1855 2 28 40.10 28.60 - 6.6 21 1 11 1894 7 10 40.70 29.60 - 6.8 26 1 12 1905 4 15 40.20 29.00 6.6 19 4 13 1912 8 10 40.60 27.20 16 7.4 100 4 14 1919 11 18 39.20 27.40 - 7.0 44 2 15 1928 5 3 39.64 29.14 10 6.1 7 4 16 1935 1 4 40.40 27.49 30 6.7 24 4 17 1939 9 22 39.07 29.94 10 7.1 54 4 18 1939 10 19 39.07 26.94 10 6.6 19 4 19 1942 6 16 40.80 27.8 20 6 6 4 20 1943 6 20 40.85 30.51 10 6.6 19 4 21 1944 6 25 39.05 29.26 - 6.1 7 2 22 1944 10 6 39.48 26.56 40 7.0 44 4 23 1953 3 18 39.99 27.36 10 6.6 19 1 24 1956 2 20 39.89 30.49 40 6.4 13 4 25 1957 5 26 40.67 31.00 10 6.7 24 1 26 1961 11 28 40.00 26.30 - 6.0 6 4 27 1964 10 6 40.30 28.23 34 6.9 36 2 28 1966 8 21 40.33 27.40 12 6.0 6 4 29 1967 7 22 40.70 30.70 - 6.7 24 1 30 1970 3 28 39.21 29.51 18 7.1 54 2 31 1971 5 25 39.03 29.74 24 6.1 7 3 32 1975 3 27 40.42 26.14 5 6.7 24 3 33 1976 8 25 39.30 28.80 33 6.0 6 4 34 1976 9 6 39.06 29.00 11 6.6 19 4 35 1999 8 17 40.76 29.97 18 7.4 100 5 36 1999 11 12 40.74 31.21 25 7.2 66 5 * Moment magnitude values are converted from MS (as given by Aki, 1983) using equation (1c). M ≥7:0 events are in bold type. † Based on Wells and Coppersmith (1994) empirical formulations. ‡ (1) Ambraseys (2006), (2) Papazachos and Papazachou (1997), (3) U.S. Council of National Seismic System (CNSS) Catalog, (4) Kandilli Observatory and Earthquake Research Institute, and (5) Gulkan and Kalkan (2002). Reassessment of Probabilistic Seismic Hazard in the Marmara Region 2131
  • 6. mean rate of transcendence for larger events (Ambraseys, 2002). A b 0:69 for the same region considering the 100 yr long earthquake catalog with M ≥5:5 events is re- ported by Crowley and Bommer (2006). For the entire Marmara region, the b-value was estimated as 0.72 using maximum likelihood method (Weichert, 1980) based on the 103 yr catalog; this method accounts for variable completeness. No uncertainty associated with the b-value was considered since the single b-value calculated herein is in good agreement with the values reported in previous studies. Thereafter, a values were computed for each cell and spatially smoothed over a grid of 0:05° × 0:05° in lati- tude and longitude using two-dimensional Gaussian filters with a decay of 50 km. Such a fine grid resulted in hazard computations at about 9600 grid sites. Source Models Smoothed-Gridded Seismicity Model. The contribution of background events to hazard is calculated using the smoothed-gridded seismicity model (Frankel, 1995; Kafka, 2002). This model addresses the aleatoric uncertainty in the location of future earthquakes, thus allowing spatially sta- tionary seismicity while eliminating the subjectivity in delin- eation of areal sources. This seismicity model requires a declustered earthquake catalog for computation of Poisso- nian earthquake recurrence rates. In this model, events that 100 200 300 400 500 600 700 1910 1919 1928 1937 1946 1955 1964 1973 1982 1991 2000 CumulativeNumber M 4.0 - 5.0 0 20 40 60 80 1901 1910 1919 1928 1937 1946 1955 1964 1973 1982 1991 2000 Years CumulativeNumber M 5.0 - 6.0 Figure 5. Incompleteness test for earthquakes that occurred in the Marmara region for M 4–5 (upper) and M 5–6 (lower) considering a 103 yr time interval (between 1901 and 2004). 2132 E. Kalkan, P. Gülkan, N. Yilmaz, and M. Çelebi
  • 7. are not assigned to specific faults are assumed to be potential seismogenic sources and are spatially gridded to cells. First, we count the number of earthquakes ni with magnitude greater than Mref in each cell i of a grid with spacing of 0.05° in latitude and 0.05° in longitude. This count repre- sents the maximum likelihood estimate of 10a for that cell (Weichert, 1980; Bender, 1983) for earthquakes above Mref. The values of ni are converted from cumulative values (number of events above Mref) to incremental values (num- ber of events from Mref to Mref ΔM) using the Herrmann formula (Herrmann, 1977). The grid of ni values is then smoothed spatially by multiplying by a Gaussian function with correlation distance c. For each cell i, the smoothed va- lue ~ni is obtained from (Frankel, 1995) ~ni P j nje Δ2 ij=c2 P j e Δ2 ij=c2 : (3) In this equation, ~ni is normalized to preserve the total number of events, and Δij is the distance between the ith and jth cells. The sum is taken over cells j within a distance of 3c of cell i. The annual probability of exceeding specified ground motions is calculated for a grid of sites using ~ni from equation (3). For each site, the values of ~ni are binned by their distance from that site, so that Nk denotes the total of ~ni values for cells within a certain distance increment of the site. Now the annual rate λ u > u0 of exceeding ground motion u0 at a specific site is determined from a sum over distance and magnitude (Frankel, 1995) λ u > u0 X k X l 10 log NK=T b Ml Mref × P u > u0jDk; Ml ; (4) where k is the index for the distance bin, and l is the index for the magnitude bin; T is the time in years of the earthquake catalog used to determine Nk. The first factor in the summa- tion is the annual rate of earthquakes in the distance bin k and magnitude bin l. P u > u0jDk; Ml is the probability that u at the site will exceed u0, for an earthquake at distance Dk with magnitude Ml (Dk is fixed for each bin). This probabil- ity is dependent on the attenuation relation and the standard deviation (variability) of the ground motion for any specific distance and magnitude. For this model, values are computed from the magnitude 4.0 and larger earthquakes since 1901. Segmented Fault Source Model. This model is based on the assumption that large earthquakes occurring in small areas are likely to belong to the same seismogenic fault or a ho- mogenous system of faults. This implies that the seismicity is concentrated on fault planes. In order to utilize the contribu- tion of the fault sources to regional seismic hazard, four aspects of each source are examined. These are: (a) style- of-faulting, (b) location and orientation, (c) slip rate, and (d) maximum magnitude earthquake expected (Petersen et al., 2000). All faults that were included in the evaluation are judged with confidence as active faults with reported slip rates greater than or equal to 10 mm=yr; other active faults having slip rates less than 10 mm=yr were not included. For the faults below the Marmara Sea, we used fault segmenta- tion data from Le Pichon et al. (2003) and Armijo et al. (2005). The remainder of the faults was taken from the active fault map of Turkey (Saroglu et al. 1992) with the caveat that this map is in the process of being updated. As shown in Figure 6, the region’s complex fault system is modeled with 48 fault segments and each is assumed to rupture indepen- dently. The properties of each fault segment are tabulated in Table 2. For nonvertical faults, dip angle is an important param- eter to determine the average fault depth and the projected Figure 6. Fault segmentation model for the Marmara region (see Table 2 for fault names and their activity rates). Reassessment of Probabilistic Seismic Hazard in the Marmara Region 2133
  • 8. distance on the grid to be used in the GMPEs. Because down- dip width and depth data for each fault are not available to accurately determine the actual subsurface source geometry, some of the planar sources were approximated as linear sources (i.e., 90° dip is assumed for strike-slip faults). Also, 10 km depth is assigned to those faults where reliable depth information is not available. Also listed in Table 2 are the approximate slip-rates broadly described from GPS measurements because only three fault segments: Izmit, Düzce and Ganos, were studied in detail by paleoseismolo- gical methods to be able to assess the long-term slip-rates. Most of the faults that are labeled active are mainly mapped on the basis of the morphological studies and with simple spatial correlations with recent known earthquakes. These issues will remain as constraints on the results presented until more reliable data on the subsurface geometry and slip rates for faults become available. In interpreting our fault segmentation model in Figure 6, which primarily relies on seismotectonic studies along with recurrence and locations of historical events, it should be em- phasized that geometry and recurrence are not totally inde- pendent of each other. If a fault is modeled with several small segments instead of fewer large segments, the maximum magnitude will be lower, and a given slip-rate will require many more small earthquakes to accommodate a cumulative seismic moment. Forthe segmented fault source model, available historical and instrumented data are not sufficient to determine whether the GR model or characteristic earthquake (CE) model or hy- brid model (Youngs and Coppersmith, 1985) is more appro- priate. Therefore, two different models (GR and CE) were placed within the logic treewith equal weights. In the CE mod- el, each of the fault segments considered is assumed to be ca- pableofrupturingindependentlyandproducingthemaximum magnitudeearthquake (Mmax)basedonfaultlengthandpoten- tial rupture depth (Aki, 1983; Schwartz and Coppersmith, 1984). It should be noted that Mmax denotes the maximum characteristic magnitude. Mmax for each fault segment is com- puted through empirical relations (Wells and Coppersmith, 1994) and cross-checked with the neighborhood historical events. To account for the uncertainties in Mmax values, Mmax is allowed to float along each fault segment in three lim- its as Mmax σ, Mmax, Mmax σ, and σ is the dispersion in statistical modeling of Mmax and taken as 0.3 on the basis of Wells and Coppersmith (1994). For the faults, we used the following seismic moment formula to find the activity rate of the characteristic event, i.e., number of earthquake per year or reciprocal of its recur- rence interval from M0 μAD; (5) where M0 is the seismic moment of the characteristic earth- quake. The rigidity or shear modulus of the crust is repre- sented by μ and is taken as 3:0 × 1011 dyne=cm2. A is the area of the rupture plane (in cm2 ), and D is the slip on the plane (in cm). Time derivative of equation (5) results in a moment rate as a function of slip-rate M0 0 μAS; (6) Table 2 Characteristic Attributes of Fault Segmentation Model Fault Segment Length (km) Characteristic Event (M) Slip-Rate (mm=yr) Activity Rate (Earthquake/yr) Fault Segment Length (km) Characteristic Event (M) Slip-Rate (mm=yr) Activity Rate (Earthquake/yr) F1 45 7.0 20 0.0073 F25 31 6.8 20 0.0095 F2 48 7.0 20 0.0070 F26 44 7.0 20 0.0074 F3 82 7.3 20 0.0049 F27 42 7.0 20 0.0077 F4 31 6.8 20 0.0094 F28 51 7.1 23 0.0077 F5 36 6.9 20 0.0085 F29 62 7.2 23 0.0068 F6 22 6.7 20 0.0119 F30 51 7.1 23 0.0077 F7 28 6.8 20 0.0101 F31 20 6.6 23 0.0148 F8 63 7.2 20 0.0058 F32 16 6.5 20 0.0150 F9 58 7.1 20 0.0062 F33 57 7.1 20 0.0062 F10 40 7.0 20 0.0079 F34 20 6.6 20 0.0128 F11 28 6.8 20 0.0101 F35 41 7.0 20 0.0077 F12 46 7.0 20 0.0072 F36 36 6.9 20 0.0085 F13 21 6.6 20 0.0121 F37 112 7.5 23 0.0045 F14 29 6.8 20 0.0099 F38 36 6.9 18 0.0076 F15 21 6.7 20 0.0121 F39 15 6.5 18 0.0140 F16 66 7.2 20 0.0056 F40 37 6.9 18 0.0075 F17 21 6.6 20 0.0122 F41 30 6.8 18 0.0088 F18 21 6.6 20 0.0124 F42 10 6.3 18 0.0185 F19 90 7.3 20 0.0046 F43 20 6.6 15 0.0096 F20 26 6.7 20 0.0107 F44 22 6.7 15 0.0089 F21 19 6.6 20 0.0133 F45 15 6.5 15 0.0116 F22 23 6.7 20 0.0114 F46 20 6.6 15 0.0096 F23 49 7.1 10 0.0034 F47 30 6.8 20 0.0097 F24 33 6.9 10 0.0045 F48 46 7.0 20 0.0072 2134 E. Kalkan, P. Gülkan, N. Yilmaz, and M. Çelebi
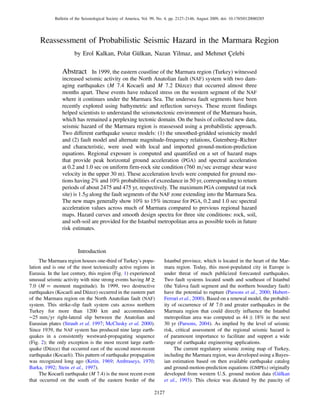
  • 9. where M0 0 is the moment rate, and S is the slip rate. The seis- mic moment can be obtained through moment magnitude, M, from the relation given by Hanks and Kanamori (1979) M 2=3 log M0 10:7 (7) By rewriting equation (7), we obtain seismic moment as log10 M0 1:5M 16:05 (8) and the activity rate of earthquakes above a minimum mag- nitude, Mmin, from N Mmin μAS mean M0=earthquake (9) On the basis of these formulas, the activity rate for each fault segment was computed and is listed in Table 2. The GR model requires computation of a value for each fault segment, therefore, buffer zones with radius of 10–15 km were introduced around each fault segment, and events within each zone were counted. If one event was counted for one buffer zone, it was not included in any other zones although it might fall within their radius. Ground-Motion-Prediction Equations In the post-1999 period, many ground motion records were recorded in Turkey. These new data were combined with the existing national ground motion library to develop a GMPE to be used for regional hazard assessments (Gülkan and Kalkan, 2002). The GMPE of Gülkan and Kalkan has the same functional form as the GMPE of Boore et al. (1997) but with different coefficients; this model was updated later by considering a larger data set (Kalkan and Gülkan, 2004). In the study presented herein, three NGA relations (Boore and Atkinson, 2008; Campbell and Bozorgnia, 2008; Chiou and Youngs, 2008) are used in addition to the GMPE of Kalkan and Gülkan (2004) to compute the ground motions at dis- tances less than 200 km. The NGA equations have been derived for shallow crustal earthquakes from a data set that includes some Turkish strong-motion records. These equations are found to be applicable for Europe and the Middle East (Stafford et al., 2008). Figure 7 compares the attenuation curves based on four different GMPEs computed for PGA, spectral acceleration (SA) at 0.2 sec, and SA at 1.0 sec. These curves correspond to an M 7.0 event on a strike-slip fault, and site condition is firm-rock (VS30 760 m=sec). Note that in Kalkan and Gülkan’s GMPE the larger of the two horizontal components for each record was processed in the regression, whereas all the NGA equa- tions use the geometric mean of the two horizontal compo- nents, which is consistently smaller. For consistency, PGA, SA at 0.2 sec, and 1.0 sec predictions from KG04 were first adjusted by 0.9, 0.9, and 0.85, respectively, and then plotted in Figure 7. These factors, relating maximum horizontal component to the geometric mean of the two horizontal com- ponents, were taken from Campbell and Bozorgnia (2008). As shown, the three NGA relations produce similar results. For PGA and SA at 0.2 sec, Kalkan and Gülkan’s GMPE yields slightly lower acceleration values within 5 km of fault rupture, whereas its predictions are comparable in the inter- mediate distances (between 5 to 25 km). For SA at 1.0 sec, Kalkan and Gülkan’s GMPE estimates larger acceleration values at distances larger than 5 km as compared to the pre- dictions of the NGA relations. 0.01 0.1 1 10 1 10 100 PeakGroundAcceleration(g) Kalkan and Gulkan (2004) Campbell and Bozorgnia (2008) Chiou and Youngs (2008) Boore and Atkinson (2008) 0.01 0.1 1 10 1 10 100 Closest Fault Distance (km) SpectralAccelerationat0.2sec(g) 0.01 0.1 1 10 1 10 100 SpectralAccelerationat1.0sec(g) Figure 7. Comparison of ground motion predictions from Kalkan and Gülkan (2004) GMPE to three NGA relations (Boore and Atkinson, 2008; Campbell and Bozorgnia, 2008; Chiou and Youngs, 2008). Plots are for PGA (left panel), SA at 0.2 sec (middle panel), and SA at 1.0 sec (right panel). Ground-motion prediction is based on an M 7.0 scenario event on a strike-slip fault (with depth of 2.0 km) and at a uniform firm-rock site (VS30 760 m=sec). Reassessment of Probabilistic Seismic Hazard in the Marmara Region 2135
  • 10. Logic Tree The logic tree constructed for hazard computations is shown in Figure 8. For smoothed seismicity model, the tree has 12 branches. For the fault source model, the three has 24 branches. The weight assigned to the local GMPE is set equal to total weight of the three NGA relations. All relative weights are subjective and based on what we consider to be defensible judgment. Seismic Hazard Results The seismic hazard is computed for PGA and SA ordinates at 0.2 sec and 1.0 sec for the uniform firm-rock site condition (VS30 760 m=sec). The 0.2 and 1.0 sec spectral periods are selected because they are frequently used to construct a smooth design spectrum; an appropriate procedure to obtain a smooth design spectrum from a uniform hazard spectrum is given in the Federal Emergency Management Association (FEMA) 356 guidelines (ASCE, 2000). Seismic hazard for the Marmara region was computed for two ground motion levels having 2% and 10% probabilities of exceedance in 50 yr and corresponding to return periods of about 2475 (annual probability of exceedance 0:000404) and 475 yr (annual probability of exceedance 0:0021), respectively. Figures 9–11 render the mean seismic hazard computed for PGA, SA at 0.2 sec, and SA at 1.0 sec for 2% and 10% prob- ability levels. The distribution of PGA and SA ordinates, shown by the color gradient, indicates a broader scattering of higher acceleration values toward the south and east of the Marmara region. For the 2475 yr return period, the maximum PGA (Fig. 9) at a uniform firm-rock site is computed as 1.5 g; PGA diminishes to 0.8 g when the return period is set to 475 yr. Figure 8. Logic tree established for seismic hazard analysis; values in brackets indicate the assigned weight to each cell; Mmax stands for maximum magnitude. 2136 E. Kalkan, P. Gülkan, N. Yilmaz, and M. Çelebi
  • 11. Such high values of PGA are observed in the vicinity of fault segments along the branch of the NAF zone extending into the Marmara Sea. This zone of large ground motions also corre- sponds to areas where large numbers of 4 events have oc- curred since 1901. At the same locations, the maximum SA at 0.2 sec (Fig. 10) is computed as 2.8 g and 1.8 g at the return period of 2475 and 475 yr, respectively. The maximum SA at 1.0 sec (Fig. 11) is computed as 1.5 g for a 2475 yr return per- iod and 0.8 g for a 475 yr return period. The hazard maps presented in Figures 9–11 are for a uni- form firm-rock site condition (VS30 760 m=sec). To obtain motions for average stiff-soil site (VS30 360 m=sec) and soft-soil site (VS30 180 m=sec), the mapped values should be modified. It is not possible to provide a constant modifica- tion factor to transfer the hazard values computed for VS30 760 m=sec to those at VS30 360 m=sec or 180 m=sec be- cause the three NGA relations utilized have nonlinear site correction term; that is, site amplification decreases with Figure 9. Seismic hazard map of the Marmara region for PGA for uniform firm-rock site condition considering 2% (top panel) and 10% (bottom panel) probability of exceedance in 50 yr. Reassessment of Probabilistic Seismic Hazard in the Marmara Region 2137
  • 12. increasing ground motion intensity as surface materials reach their limit strength and start behaving nonlinearly. The difference between a linear and nonlinear site correction term affects the stronger ground motions. In order to predict the ground motion at soil and soft-soil sites, we computed the amplification factors (by taking the ratio of hazard results for a particular VS30 to those for VS30 760 m=sec) at every grid point and projected them on a series of site amplification maps in Figures 12 and 13. These maps are generated for PGA and SA at 0.2 sec, and SA at 1.0 sec considering ground-motion level at 2% and 10% probability of exceedance in 50 yr. For both ground motion levels, site amplification factors for VS30 180 m=sec are almost unity at the locations where the high PGA values are computed. For VS30 180 m=sec, Kalkan and Gülkan’s GMPE yields a constant amplification factor of 1.3 independent of the PGA level. At the PGA level of 0.3 g and higher, NGA relations yield site amplification factors less than unity; therefore, combination of four GMPE Figure 10. Seismic hazard map of the Marmara region for spectral acceleration at 0.2 sec for uniform firm-rock site condition con- sidering 2% (top panel) and 10% (bottom panel) probability of exceedance in 50 yr. 2138 E. Kalkan, P. Gülkan, N. Yilmaz, and M. Çelebi
  • 13. within the logic tree results in no site amplification around the major fault lines. The same applies for SA at 0.2 sec. However, for SA at 1.0 sec, NGA relations yield amplification factors greater than unity, thus, soft-soil sites around the major fault lines are expected to experience a minimum 1.6 times higher ground motion as compared to the uniform firm-rock sites considering 2% probability of exceedance in 50 yr. In general, nonlinearity phenomenaresult inashiftoftheenergy tolonger response periods. Comparisons between Figures 12 and 13 show that site amplification factors computed for 10% prob- ability of exceedance level are higher than those for 2% probability of exceedance level because nonlinearity is more pronounced for higher PGA and spectral accelerationvalues at 2% probability of exceedance level. Note that about 20% deamplification is predicted by NGA formulas at higher fre- quencies such as 0.2 sec for soft-soil compared to rock when ground motions are high. Seismic Hazard of the Istanbul Metropolitan Area The northern segments of the Marmara Sea faults are about 10–15 km from the southern coastline of Istanbul Figure 11. Seismic hazard map of the Marmara region for spectral acceleration at 1.0 sec for uniform firm-rock site condition con- sidering 2% (top panel) and 10% (bottom panel) probability of exceedance in 50 yr. Reassessment of Probabilistic Seismic Hazard in the Marmara Region 2139
  • 14. Figure 12. Site amplification map of the Marmara region for PGA, SA (0.2 sec), and SA (1.0 sec) considering 2% probability of ex- ceedance. Ratio of ground-motion estimate between VS30 180 m=sec and VS30 760 m=sec (left panels). Ratio of ground-motion es- timate between VS30 360 m=sec and VS30 760 m=sec (right panels). 2140 E. Kalkan, P. Gülkan, N. Yilmaz, and M. Çelebi
  • 15. Figure 13. Site amplification map of the Marmara region for PGA, SA (0.2 sec), and SA (1.0 sec) considering 10% probability of exceedance. Ratio of ground motion estimate between VS30 180 m=sec and VS30 760 m=sec (left panels). Ratio of ground motion estimate between VS30 360 m=sec and VS30 760 m=sec (right panels). Reassessment of Probabilistic Seismic Hazard in the Marmara Region 2141
  • 16. proper (Fig. 4), while two-thirds of the city remains within 20–30 km radius of fault segments F29 and F30 (Fig. 6). These fault segments when ruptured independently have the potential to generate an event with magnitude greater than 7 (see Table 2 for their characteristic magnitudes). Intense PGA level is expected particularly in southern parts of Istanbul where the Istanbul Strait opens to the Marmara Sea. The level of shaking gradually diminishes toward the north. The predicted PGA ranges between 0.3 and 0.4 g for 475 yr return period in southern parts of Istanbul; esti- mated PGA increases to as much as 0.45 g on the shoreline west of Istanbul. The 2475 yr return period pushes this envelope from 0.5 to 0.7 g level. The results of the previous study by Gülkan et al. (1993), constituting the fundament of the regulatory seismic zoning map of Turkey, reveal PGA dis- tribution about 0.4 g around Istanbul metropolitan area for 475 yr return period, in good agreement with our predictions. For the Istanbul metropolitan area seismic hazard curves are plotted in Figure 14 for PGA, SA at 0.2 sec, and SA at 1.0 sec by considering a uniform firm-rock, soil, and soft-soil sites. The two horizontal reference lines drawn indicate 2% and 10% probability levels. For the Istanbul c area, site-dependent design spectra are computed next by using the PSHA-based uniform hazard spectra following the FEMA-356 procedure. The smooth design spectrum for each of three site categories are produced for 10% probability of exceedance in 50 yr; the resultant smooth spectra are shown in Figure 15. The design spectra based on the regulatory Turkish Seismic Code (TSC; Ministry of Public Works and Settlement, 2007) are also plotted on the same figure for comparison. In this figure, Z4, Z3, and Z2 denote the TSC-2007 site classifications; they roughly corre- spond to VS30 180, 360, and 760 m=sec, respectively. TSC-2007 design spectra well envelope the smooth design spectra and remain on the conservative side. It should be noted that TSC-2007 does not consider distance to fault as a param- eter in constructing the design spectrum and assumes that the design spectrum based on a specific site category is invariant within a seismic zone; Turkey is divided into five seismic zones, and the southern part of Istanbul is located in zone 1 designated as the most active seismic zone. The PSHA results presented here and the previous study by Kalkan and Gülkan (2004) suggest that Turkish code-based spectrum should havedistancedependencesimilartotheInternationalBuilding Code (International Conference of Building Officials [ICBO], 2006) to achieve realistic design spectral values consistent with regional hazard conditions. For distances close to faults, design spectrum may be constructed as the lower spectral values computed from a deterministic-based approach (where a characteristic event dominates the hazard) and probability- based approach; for farther distances the probabilistic-based approach may govern the design spectrum. A suite of deter- ministic-based design spectra have been already developed for Turkey (Kalkan and Gülkan, 2004). Conclusions This paper presents a reassessment of the seismic hazard in the Marmara region on the basis of recent findings on sea bottom surveys and enhanced ground motion library from recent national events. All potential sources of seismic activity that might contribute to ground motions were identified and characterized by examining geologic, tectonic, historic, and instrumental evidence. The methodology applied here is similar to that used in the development of the most recent U.S. seismic hazard maps. Two models of seismic sources were combined and employed with different GMPEs for the Figure 14. Seismic hazard curves for the Istanbul metropolitan area computed for PGA, SA at 0.2 sec, and SA at 1.0 sec for uniform firm rock (VS30 760 m=sec), soil (VS30 360 m=sec), and soft-soil (VS30 180 m=sec) sites. Horizontal dashed lines identify 2% and 10% probability of a given acceleration level being exceeded. 2142 E. Kalkan, P. Gülkan, N. Yilmaz, and M. Çelebi
  • 17. Figure 15. Comparison of PSHA-based smooth design spectrum (10% probability of exceedance in 50 yr) constructed on uniform hazard spectrum with Turkish Seismic Code (2007) design spectrum for rock, soil, and soft-soil site conditions (TSC site classes are Z2, Z3, Z4, respectively). Damping ratio is 5%. Reassessment of Probabilistic Seismic Hazard in the Marmara Region 2143
  • 18. assessment of hazard quantified in terms of peak ground ac- celeration andspectral accelerations at0.2 and1.0 secwith 2% and 10% probability of exceedance in 50 yr. Confidence of time-dependent models is inevitably hampered by short-term completeness of the earthquake catalog, and as a result tem- poral occurrence of earthquakes was assumed to be Poisso- nian; because of that our model represents an upper bound compared to time-dependent models. Hazard maps were com- puted for generic rock site conditions; for soil and soft-soil sites, a set of amplification maps is provided. The reliability of the hazard analyses conducted here depends primarily on precision with which uncertainty in magnitude, epicenter, recurrence, fault segmentation, and their cross effects can be identified and characterized. For instance, the maximum magnitude at each fault segment was estimated from the fault length and approximate slip rates. In order to account for the associated uncertainties, maximum magnitude is allowed to float along each fault segment. This treatment results in enhanced hazard level especially for long return periods (e.g., 2475 yr), while its influence remains marginal for short return periods (e.g., 475 yr). The uncertainty in recurrence is also a factor because of the many big events in the 1999–present period. We have ignored the faults with less than 10 mm=yr average slip. In addition, we did not model faults as unsegmented as another branch in the logic tree. Considering them in PSHA may increase the hazard in the region. Results in this study show that for the 475 yr return period, PGA may reach to as much as a 0.4 g level in the south- ern areas of Istanbul and the Yalova region and 0.5 g level around the shoreline to the west of the metropolitan area at a closest distance of about 10 km to the active Marmara Sea faults. PGA increases to the 0.8 g level at much closer distances near the fault segments. In the Istanbul downtown area, the average PGA is expected to measure at 0.4 g for 10% probability of exceedance in the next 50 yr. Our analyses for the Istanbul metropolitan area lack very fine grid-spacing, and the results presented herein are intended to give a general perspective on the anticipated level of shaking. The principal differences of the study described here and the previous studies focused on the Marmara region (e.g., Atakan et al., 2002; Erdik et al., 2004) are that the GMPE developed from indigenous sources has been given prepon- derance in the weighting. The characteristics attributed to the seismogenic sources and use of NGA relations are also major improvements. The new maps (Figs. 9–11) generally show 10% to 15% increase for PGA, 0.2 sec, and 1.0 sec spectral acceleration across much of Marmara compared to previous regional hazard maps. The seismic hazard maps provided here are intended to shed some light on future assessments of risk to structures in the defined Marmara region and, we hope, serve as a remind- er to improve design and construction practices to minimize losses of life and property. Data and Resources Digital data of hazard curves for the entire Marmara region including the Istanbul metropolitan area and hazard maps presented herein can beviewed in color and downloaded fromwww.erolkalkan.com/Marmara_Research(lastaccessed June 2009). Seismic hazard maps are also integrated with the 3D-Earth model at www.erolkalkan.com/MIM (last accessed June 2009) to provide an interactive interface. Events that use different intensity scales compiled from different sources are the Earthquake Research Department, General Directorate of Disaster Affairs of Turkey (http://angora.deprem.gov.tr/ ivmekataloglaren.htm, last accessed June 2009); Kandilli Observatory, Boğaziçi University (http://www.koeri.boun .edu.tr/sismo/Mudim/katalog.asp, last accessed June 2009); International Seismological Centre (http://www.isc.ac.uk/ doc/products/catalogue.html, last accessed June 2009); and the U.S. Geological Survey (http://neic.usgs.gov/neis/epic/, last accessed June 2009). Acknowledgments We wish to thank Tom Parsons for providing us the coordinates of fault segments under the Marmara Sea and Steve Harmsen for his generous sup- port on the latest version of the USGS seismic hazard code and also for reviewing this article. Special thanks are extended to Luke J. Blair who plotted the maps in a GIS environment, Thomas Holzer, Vladimir Graizer, and Tianqin Cao for their insightful reviews. Comments and suggestions by Julian J. Bommer, Fleur O. Strasser, and an anonymous reviewer were help- ful in improving the technical quality of the paper. References Aki, K. (1983). Seismological evidence in support of the existence of char- acteristic earthquakes, Earthquake Notes 54, 60–61. Aksoy, M. E., M. Meghraoui, M. Ferry, Z. Çakir, S. Akyüz, V. Karabacak, and E. Altunel (2006). Fault characteristics, segmentation and paleo- seismology along the 9 August 1912 Ganos earthquake-rupture (North Anatolian Fault, Turkey), Geophys. Res. Abstr. 8, 10002. Al-Tarazi, E., and E. Sandvol (2007). Alternative Models of Seismic Hazard Evaluation along the Jordan—Dead Sea Transform, Earthq. Spectra 32, no. 1, 1–19. Ambraseys, N. N. (1970). Some characteristic features of the Anatolian fault zone, Tectonophysics 9, 143–165. Ambraseys, N. N. (2002). The seismic activity of the Marmara region over the last 2000 years, Bull. Seismol. Soc. Am. 92, no. 1, 1–18. Ambraseys, N. N. (2006). Comparison of frequency of occurrence of earth- quakes with slip rates from long-term seismicity data: The cases of Gulf of Corinth, Marmara Sea and Dead Sea Fault Zone, Geophys. J. Int. 165, 516–526. American Society of Civil Engineers (ASCE) (2000). Prestandard and Com- mentary for the Seismic Rehabilitation of Buildings, prepared for the SAC Joint Venture, Federal Emergency Management Agency, FEMA- 356, Washington D.C. Armijo, R., B. Meyer, S. Navarro, G. King, and A. Barka (2002). Asym- metric slip partitioning in the Marmara Sea pull-apart: A clue to propagation processes of the North Anatolian fault? Terranova 14, 80–86. Armijo, R., N. Pondard, B. Meyer, G. Üçarcus, B. Mercier de Lépinay, J. Malavieille, S. Dominguez, M.-A. Gustcher, S. Schmidt, C. Beck, N. Çağatay, Z. Cakir, C. Imren, K. Eris, B. Natalin, S. Özalaybey, L. Tolun, I. Lefèvre, L. Seeber, L. Gasperini, C. Rangin, Ö. Emre, and K. Sarikavak (2005). Submarine fault scarps in the Sea of Mar- 2144 E. Kalkan, P. Gülkan, N. Yilmaz, and M. Çelebi
  • 19. mara pull-apart (North Anatolian Fault): Implications for seismic ha- zard in Istanbul, Geochem. Geophys. Geosyst. 6, no. 6, 1–29. Atakan, K., A. Ojeda, M. Meghraoui, A. A. Barka, M. Erdik, and A. Bodare (2002). Seismic hazard in Istanbul following the 17 August 1999 Izmit and 12 November 1999 Düzce earthquakes, Bull. Seismol. Soc. Am. 92, no. 1, 466–482. Barka, A. (1992). The North Anatolian fault zone, Annales Tectonicae 6, 164–195. Barka, A., and K. Kadinsky-Cade (1988). Strike-slip fault geometry in Turkey and its influence on earthquake activity, Tectonics 7, no. 3, 663–684. Bender, B. (1983). Maximum likelihood estimation of b values for magni- tude grouped data, Bull. Seismol. Soc. Am. 73, 831–851. Boore, D. M., and G. Atkinson (2008). Ground motion prediction equations for the average horizontal component of PGA, PGV, and 5%-damped PSA at spectral periods between 0.01 s and 10.0 s, Earthq. Spectra 24, no. 1, 99–138. Boore, D. M., W. B. Joyner, and T. E. Fumal (1997). Equations for estimat- ing horizontal response spectra and peak acceleration from western North American earthquakes: A summary of recent work, Seism. Res. Lett. 68, no. 1, 128–153. Campbell, K., and Y. Bozorgnia (2008). NGA ground motion model for the geometric mean horizontal component of PGA, PGV, PGD and 5% damped linear elastic response spectra for periods ranging from 0.01 s to 10 s, Earthquake Spectra 24, no. 1, 139–171. Chiou, B., and R. Youngs (2008). An NGA model for the average horizontal component of peak ground motion and response spectra, Earthq. Spec- tra 24, no. 1, 173–215. Crowley, H., and J. J. Bommer (2006). Modeling seismic hazard in earth- quake loss models with spatially distributed exposure, Bull. Eq. Eng. 4, 249–273. Erdik, M., M. Demircioğlu, K. Şeşetyan, E. Durukal, and B. Siyahi (2004). Earthquake hazard in Marmara region, Turkey, Soil Dyn. Earthq. Eng. 24, 605–631. Frankel, A. (1995). Mapping seismic hazard in the Central and Eastern United States, Seism. Res. Lett. 66, no. 4, 8–21. Gardner, J. K., and L. Knopoff (1974). Is the sequence of earthquakes in southern California, with aftershocks removed, Poissonian? Bull. Seis- mol. Soc. Am. 64, 1363–1367. Gülkan, P., and E. Kalkan (2002). Attenuation modeling of recent earth- quakes in Turkey, J. Seism. 6, no. 3, 397–409. Gülkan, P., A. Koçyiğit, M. S. Yücemen, V. Doyuran, and N. Başöz (1993). A seismic zones map of Turkey derived from recent data, Middle East Technical University, Earthquake Engineering Research Center Report No. 93-01, (in Turkish). Hanks, T. C., and H. Kanamori (1979). A moment magnitude scale, J. Geophys. Res. 84, 2348–2350. Herrmann, R. B. (1977). Recurrence Relations, Earthquake Notes 88, 47–49. Hubert-Ferrari, A., A. A. Barka, E. Jacquess, S. S. Nalbant, B. Meyer, R. Armijo, P. Tapponier, and G. C. P. King (2000). Seismic hazard in the Marmara Sea following the Izmit earthquake, Nature 404, 269–272. International Conference of Building Officials (ICBO) (2006). International Building Code, Whittier, CA. Kafka, A. L. (2002). Statistical analysis of the hypothesis that seismicity delineates areas where future large earthquakes are likely to occur in the central and eastern United States, Seism. Res. Lett. 73, no. 6, 992–1003. Kafka, A. L., and J. R. Walcott (1998). How well does the spatial distri- bution of smaller earthquakes forecast the locations of larger earth- quakes in the northwestern United States? Seism. Res. Lett. 69, 428–440. Kalkan, E., and P. Gülkan (2004). Site-dependent spectra derived from ground motion records in Turkey, Earthq. Spectra 20, no. 4, 1111–1138. Ketin, I. (1969). Uber die nordanatolische Horizontalverschiebung, Bull. Min. Res. Explor. Inst. Turkey 72, 1–28. Le Pichon, X., A. M. C. Sengor, E. Demirbag, C. Rangin, C. Imren, R. Armijo, N. Gorur, N. Cagatay, B. Mercier de Lepinay, B. Meyer, R. Saatcilar, and B. Tok (2001). The active main Marmara fault, Earth Planet. Sci. Lett. 192, 595–616. Le Pichon, X., N. Chamot-Rooke, C. Rangin, and A. M. C. Sengor (2003). The North Anatolian Fault in the Marmara Sea 2003, J. Geophys. Res. B Solid Earth Planets 108, 2170–2179. McClusky, S.27 coauthors (2000). Global Positioning System constraints on plate kinematics and dynamics in the eastern Mediterranean and Caucasus, J. Geophys. Res. 105, 5695–5719. Ministry of Public Works and Settlement (2007). Turkish Seismic Code, Specification for Structures to be Built in Disaster Areas, Ankara, Turkey. Motagh, M., J. Hoffmann, B. Kampes, M. Baes, and J. Zschau (2007). Strain accumulation across the Gazikoy—Saros segment of the North Anatolian Fault inferred from Persistent Scatterer Interferometry and GPS measurements, Earth Planet Sci. Lett. 255, no. 30, 432–444. Okay, A. I., A. K. Ozcan, C. Imren, A. B. Guney, E. Demirbag, and I. Kuscu (2000). Active faults and evolving strike-slip basins in the Marmara Sea, northwest Turkey: A multichannel seismic reflection study, Tectonophysics 321, 189–218. Papazachos, B. C., and C. Papazachou (1997). The Earthquakes of Greece, ZITI Ed., Thessaloniki 304 p. Parke, J. R., T. A. Minshull, and G. Anderson (1999). Active faults in the Marmara Sea, western Turkey, imaged by seismic reflection profiles, Terra Nova 11, 223–227. Parsons, T. (2004). Recalculated probability of M ≥ 7 earthquakes beneath the Marmara Sea, Turkey, J. Geophys. Res. 109, B05304, 1–21. Parsons, T., S. Toda, R. S. Stein, A. Barka, and J. H. Dieterich (2000). Heightenined odds of large earthquake near Istanbul: An interac- tion-based probability calculation, Science 288, 661–665. Petersen, Mark D., Arthur D. Frankel, Stephen C. Harmsen, Charles S. Mueller, Kathleen M. Haller, Russell L. Wheeler, Robert L. Wesson, Yuehua Zeng, Oliver S. Boyd, David M. Perkins, Nicolas Luco, H. Field Edward, Chris J. Wills, and S. Rukstales Kenneth (2008). Documentation for the 2008 Update of the United States National Seismic Hazard Maps, U.S. Geol. Surv. Open-File Rept. 2008- 1128, 61 p. Petersen, M. D., T. R. Toppozada, T. Cao, C. H. Cramer, M. S. Reichle, and W. A. Bryant (2000). Active fault near-source zones within and bor- dering the State of California for the 1997 Uniform Building Code, Earthq. Spectra 16, no. 1, 69–83. Pulido, N., A. Ojeda, K. Atakan, and T. Kubo (2004). Strong ground motion estimation in the Marmara Sea region (Turkey) based on scenario earthquake, Tectonophysics 39, 357–374. Saroglu, F., O. Emre, and I. Kuscu (1992). Active fault map of Turkey, Ma- den Tetkik ve Arama (in Turkish). Schwartz, D. P., and K. J. Coppersmith (1984). Fault behavior and charac- teristic earthquakes: Examples from the Wasatch and San Andreas fault zones, J. Geophys. Res. 89, no. B7, 5681–5698. Seeber, L., O. Emre, M. H. Cormier, C. C Sorlien, C. M. G. McHugh, A. Polonia, N. Ozer, N. Cagatay, and The team of the 2000 R/V Urania Cruise in the Marmara Sea (2004). Uplift and subsidence from oblique slip: The Ganos Marmara bend of the North Anatolian Transform, western Turkey, Tectonophysics 391, no. 1–4, 239–258. Smith, A. D., T. Taymaz, F. Oktay, H. Yuce, B. Alpar, H. Basaran, J. A. Jackson, S. Kara, and M. Simsek (1995). High-resolution seismic profiling in the Marmara Sea (Northwest Turkey); Late Quaternary sedimentation and sea-level changes, Spec. Pap. Geol. Soc. Am. 107, 923–936. Stafford, P. J., F. O. Strasser, and J. J. Bommer (2008). An evaluation of the applicability of the NGA models to ground motion prediction in the Euro-Mediterranean region, Bull. Earthquake Eng. 6, no. 2, 149–177. Stein, R. S., A. A. Barka, and J. H. Dieterich (1997). Progressive failure on North Anatolian Fault since 1939 by earthquake stress triggering, Geo- phys. J. Int. 128, 594–604. Reassessment of Probabilistic Seismic Hazard in the Marmara Region 2145
  • 20. Straub, C., H-G. Kahle, and C. Schindler (1997). GPS and geologic esti- mates of the tectonic activity in the Marmara Sea region, NWAnatolia, J. Geophys. Res. 102, no. 27, 587–601. Ulusay, R., E. Tuncay, H. Sonmez, and C. Gokceoglu (2004). An attenua- tion relationship based on Turkish strong-motion data and iso- acceleration map of Turkey, Eng. Geol. 74, no. 3–4, 265–291. Weichert, D. H. (1980). Estimation of earthquake recurrence parameters for unequal observation periods for different magnitudes, Bull. Seismol. Soc. Am. 70, 1337–1356. Wells, D. L., and K. J. Coppersmith (1994). New empirical relation- ships among magnitude, rupture length, rupture width, rupture area, and surface displacement, Bull. Seismol. Soc. Am. 84, no. 4, 974–1002. Yaltirak, C. (2002). Tectonic evolution of the Marmara Sea and its surround- ings, Mar. Geol. 190, 493–529. Yenier, E., O. Erdoğan, and S. Akkar (2008). Empirical Relationships for Magnitude and Source-To-Site Distance Conversions using Recently Compiled Turkish Strong-Ground motion Database, The Fourteenth World Conference on Earthquake Engineering, October 12–17 2008, Beijing, China. Youngs, R. R., and K. J. Coppersmith (1985). Implications of fault slip rates and earthquake recurrence models to probabilistic seismic hazard estimates, Bull. Seismol. Soc. Am. 75, no. 4, 939–964. U.S. Geological Survey Western Region Earthquake Hazards Team MS977, 345 Middlefield Rd. Menlo Park, California 94025 ekalkan@usgs.gov Manuscript received 1 November 2007 2146 E. Kalkan, P. Gülkan, N. Yilmaz, and M. Çelebi