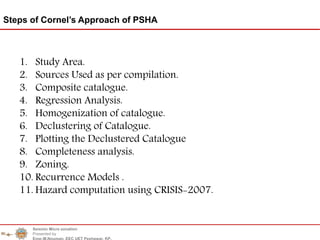
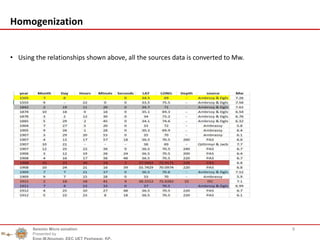
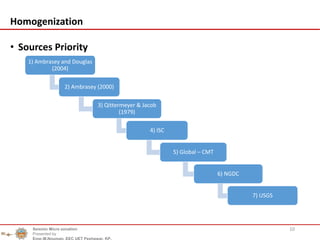
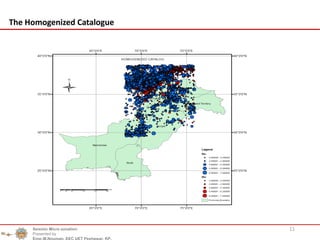
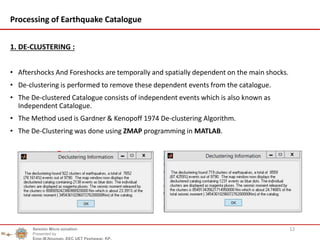
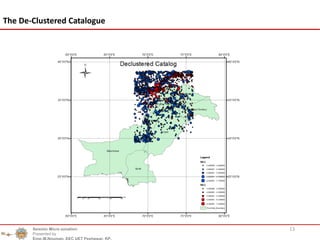
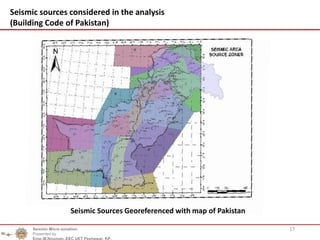
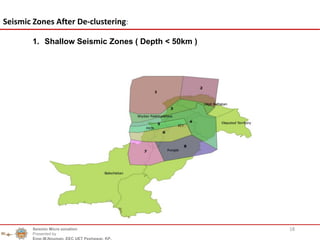
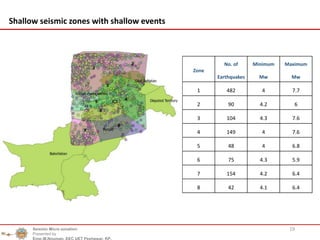
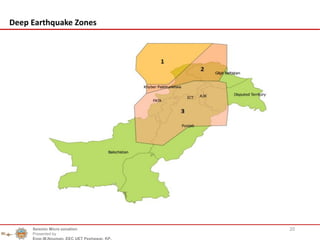
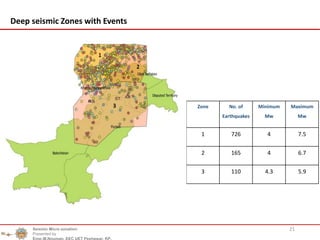
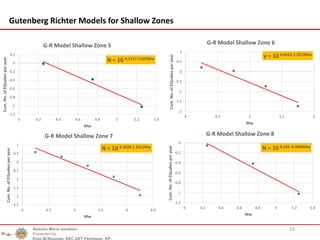
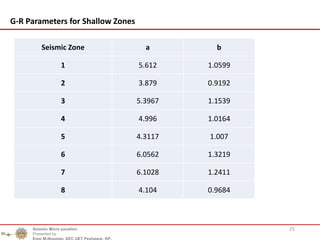
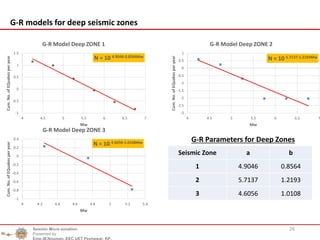
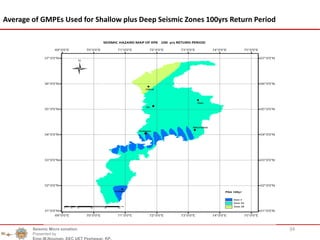
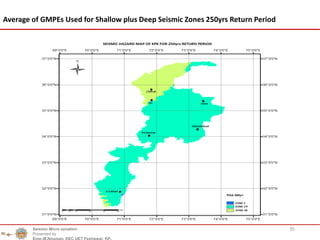
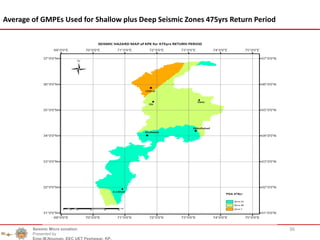
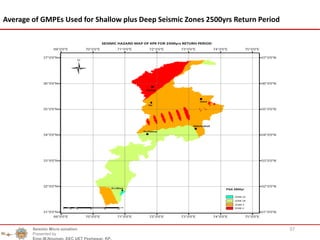
Seismic Hazard Assessment of KPK
UET
Presented By:
Muhammad Nouman
Supervised By:
Engr. Dr. Naveed Ahmad
2
Introduction
 Seismic hazard:
• A seismic hazard is the probability that an earthquake will occur in a given geographic area,
within a given window of time, and with ground motion intensity exceeding a given
threshold.
• With a hazard thus estimated, risk can be assessed and included in such areas as building
codes for standard buildings, designing larger buildings and infrastructure projects and
land use planning.
• In general terms, the seismic hazard defines the expected seismic ground motion at a site,
phenomenon which may result in destructions and losses.
Seismic Micro zonation
Presented by
Engr.M.Nouman, EEC UET Peshawar, KP.
3
Introduction
Seismic Micro zonation
Presented by
Engr.M.Nouman, EEC UET Peshawar, KP.
 Seismic hazard:
• Two major approaches deterministic and probabilistic are worldwide used at present for
seismic hazard assessment.
• The deterministic approach takes into account a single, particular earthquake, the event
that is expected to produce the strongest level of shaking at the site.
• The outputs intensity, peak ground acceleration, peak ground velocity, peak ground
displacement, response spectra may be used directly in engineering applications.
• In the probabilistic approach, initiated with the pioneering work of Cornell, the seismic
hazard is estimated in terms of a ground motion parameter intensity, peak ground
acceleration and its annual probability of exceedance (or return period) at a site.
• The method yields regional seismic probability maps, displaying contours of maximum
ground motion (macroseismic intensity, PGA) of equal specified return period.
Steps of Cornel’s Approach of PSHA
1. Study Area.
2. Sources Used as per compilation.
3. Composite catalogue.
4. Regression Analysis.
5. Homogenization of catalogue.
6. Declustering of Catalogue.
7. Plotting the Declustered Catalogue
8. Completeness analysis.
9. Zoning.
10. Recurrence Models .
11. Hazard computation using CRISIS-2007.
Seismic Micro zonation
Presented by
Engr.M.Nouman, EEC UET Peshawar, KP.
5
Introduction
 Area of Responsibility:
• The area for which seismic hazard is to be computed, which is Khyber Pakhtunkhwa (KPK)
in our case.
 Area of influence (AI):
• It is the region surrounding KPK Boundary in which if
any earthquake occurs will affect KPK.
• It is taken 200 Km area surrounding KPK.
Area of influence
200 KM
KPK
Seismic Micro zonation
Presented by
Engr.M.Nouman, EEC UET Peshawar, KP.
Area of
Responsibility
6
Sources used in the compilation of the catalogue
• The seismic event data was collected From the Following Sources (year 1500 to 2016).
No. Sources
1 Ambrasey and Douglas (2004)
2 Ambrasey (2000)
3 Qittermeyer & Jacob (1979)
4 International Seismological Center
(ISC)
5 Global – CMT
6 National Geophysical Data Center
(NGDC)
7 USGS
Seismic Micro zonation
Presented by
Engr.M.Nouman, EEC UET Peshawar, KP.
29.49824 S 38.72559 N
68.26591 W 75.88964 E
• All the sources data was merged in excel sheet and Combined or Composite catalogue was
formed.
• It Consisted of 12788 Earthquake events.
• The data is filtered and sorted.
• All the duplicate events are colored which were reported in two or more sources.
7
Combined Catalogue
Seismic Micro zonation
Presented by
Engr.M.Nouman, EEC UET Peshawar, KP.
• Homogenization Relationships
8
Homogenization
Relationship
between
Relationship (Equation)
Mw & MS ≤ 6.2 Mw=0.5998Ms+2.3885
Mw& MS > 6.2 Mw=0.8573Ms+0.8806
Mw & Mb Mw=0.7998Mb+1.135
Mw & ML Mw=0.0487Ml+5.2428
Seismic Micro zonation
Presented by
Engr.M.Nouman, EEC UET Peshawar, KP.
• Using the relationships shown above, all the sources data is converted to Mw.
9
Homogenization
Seismic Micro zonation
Presented by
Engr.M.Nouman, EEC UET Peshawar, KP.
• Sources Priority
10
Homogenization
Seismic Micro zonation
Presented by
Engr.M.Nouman, EEC UET Peshawar, KP.
1) Ambrasey and Douglas
(2004)
2) Ambrasey (2000)
3) Qittermeyer & Jacob
(1979)
4) ISC
5) Global – CMT
6) NGDC
7) USGS
11
The Homogenized Catalogue
Seismic Micro zonation
Presented by
Engr.M.Nouman, EEC UET Peshawar, KP.
1. DE-CLUSTERING :
• Aftershocks And Foreshocks are temporally and spatially dependent on the main shocks.
• De-clustering is performed to remove these dependent events from the catalogue.
• The De-clustered Catalogue consists of independent events which is also known as
Independent Catalogue.
• The Method used is Gardner & Kenopoff 1974 De-clustering Algorithm.
• The De-Clustering was done using ZMAP programming in MATLAB.
12
Processing of Earthquake Catalogue
Seismic Micro zonation
Presented by
Engr.M.Nouman, EEC UET Peshawar, KP.
13
The De-Clustered Catalogue
Seismic Micro zonation
Presented by
Engr.M.Nouman, EEC UET Peshawar, KP.
2. Completeness analysis (Visual inspection method)
• One of the methods used for completeness is Visual Cumulative method (CUVI)
formulated by Mulargia and Tinti (1985).
• It is a simple, graphical procedure based on the observation that earthquakes follow
a stationary occurrence process.
• For a given magnitude class, the period of completeness is considered to begin at
the earliest time when the slope of the fitting curve can be well approximated by a
straight line.
14
Processing of Earthquake Catalogue
Seismic Micro zonation
Presented by
Engr.M.Nouman, EEC UET Peshawar, KP.
15
Completeness analysis (Visual inspection method)
0
100
200
300
400
500
600
700
800
1950 1960 1970 1980 1990 2000 2010 2020
Cumulativeno.ofevents
Year
Completeness (4-4.5)
CP=1995
0
200
400
600
800
1000
1200
1950 1960 1970 1980 1990 2000 2010 2020
Cumulativeno.ofevents
Year
Completeness (4.6-5)
0
50
100
150
200
250
300
350
1900 1920 1940 1960 1980 2000 2020 2040
Cumulativeno.ofevents
Year
Completeness (5.1-5.5)
0
10
20
30
40
50
60
70
80
90
1880 1900 1920 1940 1960 1980 2000 2020 2040
Cumulativeno.ofevents
Year
Completeness (5.6-6)
Seismic Micro zonation
Presented by
Engr.M.Nouman, EEC UET Peshawar, KP.
16
Mw Average Mw Interval Tc
4.0- 4.5 4.25 1995-2016 20
4.51 - 5.0 4.75 1984-2016 31
5.01 - 5.50 5.25 1973-2016 42
5.51 - 6.0 5.75 1961-2016 54
6.01 - 6.5.0 6.25 1931-2016 84
>= 6.6 6.75 1907-2016 108
0
5
10
15
20
25
30
35
1860 1880 1900 1920 1940 1960 1980 2000 2020 2040
Cumulativeno.ofevents
Year
Completeness (6.1-6.5)
0
5
10
15
20
25
30
1490 1590 1690 1790 1890 1990 2090
Cumulativeno.ofevents
Year
Completeness (6.6 onwards)
Processing of the earthquake catalogue
Seismic Micro zonation
Presented by
Engr.M.Nouman, EEC UET Peshawar, KP.
17
Seismic sources considered in the analysis
(Building Code of Pakistan)
Seismic Sources Georeferenced with map of Pakistan
Seismic Micro zonation
Presented by
Engr.M.Nouman, EEC UET Peshawar, KP.
18
Seismic Zones After De-clustering:
1. Shallow Seismic Zones ( Depth < 50km )
Seismic Micro zonation
Presented by
Engr.M.Nouman, EEC UET Peshawar, KP.
19
Shallow seismic zones with shallow events
Zone
No. of
Earthquakes
Minimum
Mw
Maximum
Mw
1 482 4 7.7
2 90 4.2 6
3 104 4.3 7.6
4 149 4 7.6
5 48 4 6.8
6 75 4.3 5.9
7 154 4.2 6.4
8 42 4.1 6.4
Seismic Micro zonation
Presented by
Engr.M.Nouman, EEC UET Peshawar, KP.
20
Deep Earthquake Zones
Seismic Micro zonation
Presented by
Engr.M.Nouman, EEC UET Peshawar, KP.
21
Deep seismic Zones with Events
Zone No. of
Earthquakes
Minimum
Mw
Maximum
Mw
1 726 4 7.5
2 165 4 6.7
3 110 4.3 5.9
Seismic Micro zonation
Presented by
Engr.M.Nouman, EEC UET Peshawar, KP.
• The Gutenberg–Richter law(GR law) expresses the relationship
between the magnitude and total number of earthquakes in any given
region and time period of at least that magnitude.
• Inputs for crisis needs the values of commutative frequency “N” or “λ”
which is the number of magnitude earthquakes per year. It can be
obtained from G-R relationship in recurrence model.
•
22
Gutenberg–Richter law
Seismic Micro zonation
Presented by
Engr.M.Nouman, EEC UET Peshawar, KP.
log10 𝑁 = 𝑎 − 𝑏𝑀
23
Gutenberg Richter Models for Shallow Zones
N = 10 5.612-1.0599Mw
-2
-1.5
-1
-0.5
0
0.5
1
1.5
4 4.5 5 5.5 6 6.5 7
Cum.No.ofEQuakesperyear
Mw
G-R Model Shallow Zone 1
N = 10 3.879-0.9192Mw
-1.6
-1.4
-1.2
-1
-0.8
-0.6
-0.4
-0.2
0
4 4.5 5 5.5 6
Cum.No.ofEQuakesperyear
Mw
G-R Model Shallow Zone 2
N = 10 5.3967-1.1539Mw
-2.5
-2
-1.5
-1
-0.5
0
0.5
1
4 4.5 5 5.5 6 6.5
Cum.No.ofEQuakesperyear
Mw
G-R Model Shallow Zone 3
N = 10 4.996-1.0164Mw
-2.5
-2
-1.5
-1
-0.5
0
0.5
1
4 4.5 5 5.5 6 6.5 7
Cum.No.ofEQuakesperyear
Mw
G-R Model Shallow Zone 4
Seismic Micro zonation
Presented by
Engr.M.Nouman, EEC UET Peshawar, KP.
24
Gutenberg Richter Models for Shallow Zones
N = 10 4.3117-1.007Mw
-1.2
-1
-0.8
-0.6
-0.4
-0.2
0
0.2
4 4.2 4.4 4.6 4.8 5 5.2 5.4
Cum.No.ofEQuakesperyear
Mw
G-R Model Shallow Zone 5
y = 10 6.0562-1.3219Mw
-2
-1.5
-1
-0.5
0
0.5
1
4 4.5 5 5.5 6
Cum.No.ofEQuakesperyear
Mw
G-R Model Shallow Zone 6
N = 10 6.1028-1.2411Mw
-2.5
-2
-1.5
-1
-0.5
0
0.5
1
4 4.5 5 5.5 6 6.5
Cum.No.ofEQuakesperyear
Mw
G-R Model Shallow Zone 7
N = 10 4.104 -0.9684Mw
-1.2
-1
-0.8
-0.6
-0.4
-0.2
0
4 4.2 4.4 4.6 4.8 5 5.2 5.4
Cum.No.ofEQuakesperyear
Mw
G-R Model Shallow Zone 8
Seismic Micro zonation
Presented by
Engr.M.Nouman, EEC UET Peshawar, KP.
25
G-R Parameters for Shallow Zones
Seismic Zone a b
1 5.612 1.0599
2 3.879 0.9192
3 5.3967 1.1539
4 4.996 1.0164
5 4.3117 1.007
6 6.0562 1.3219
7 6.1028 1.2411
8 4.104 0.9684
Seismic Micro zonation
Presented by
Engr.M.Nouman, EEC UET Peshawar, KP.
26
G-R models for deep seismic zones
G-R Parameters for Deep Zones
N = 10 5.7137-1.2193Mw
-3
-2.5
-2
-1.5
-1
-0.5
0
0.5
1
4 4.5 5 5.5 6 6.5 7
Cum.No.ofEQuakesperyear
Mw
G-R Model Deep ZONE 2
N = 10 4.6056-1.0108Mw
-1
-0.8
-0.6
-0.4
-0.2
0
0.2
0.4
4 4.2 4.4 4.6 4.8 5 5.2 5.4
Cum.No.ofEQuakesperyear
Mw
G-R Model Deep ZONE 3
Seismic Zone a b
1 4.9046 0.8564
2 5.7137 1.2193
3 4.6056 1.0108
N = 10 4.9046-0.8564Mw
-1
-0.5
0
0.5
1
1.5
4 4.5 5 5.5 6 6.5 7
Cum.No.ofEQuakesperyear
Mw
G-R Model Deep ZONE 1
Seismic Micro zonation
Presented by
Engr.M.Nouman, EEC UET Peshawar, KP.
• Inputs for crisis needs the values of commutative frequency “λ” which
is the number of magnitude earthquakes per year. It can be obtained
from G-R relationship in recurrence model.
• Log (λ) = a-b*M
o α=a*2.303
o β=b*2.303
27
Hazard Computation Using CRISIS 2007
Seismic Micro zonation
Presented by
Engr.M.Nouman, EEC UET Peshawar, KP.
• Shallow Zones
28
CRISIS Input Parameters
Seismic Zone a b λ M0 Mmax α β
1 5.612 1.0599 23.57 4 6.8 12.92444 2.44095
2 3.879 0.9192 1.59 4 5.8 8.933337 2.116918
3 5.3967 1.1539 6.04 4 6.3 12.4286 2.657432
4 4.996 1.0164 8.52 4 6.8 11.50579 2.340769
5 4.3117 1.007 1.92 4 5.3 9.929845 2.319121
6 6.0562 1.3219 5.87 4 5.8 13.94743 3.044336
7 6.1028 1.2411 13.75 4 6.3 14.05475 2.858253
8 4.104 0.9684 1.7 4 5.3 9.451512 2.230225
Seismic Micro zonation
Presented by
Engr.M.Nouman, EEC UET Peshawar, KP.
29
• Deep Zones
CRISIS Input Parameters
Seismic Zone a b λ M0 Mmax α β
1 4.9046 0.8564 30.13 4 6.8 11.29529 1.972289
2 5.7137 1.2193 6.86 4 6.8 13.15865 2.808048
3 4.6056 1.0108 3.65 4 5.3 10.6067 2.327872
Seismic Micro zonation
Presented by
Engr.M.Nouman, EEC UET Peshawar, KP.
 For Shallow Zones:
1. Akkar and Boomer ,2010
2. Bore and Atkinson,NGA 2008
 For Deep Zones:
1. Lin and Lee ,2008
2. Kanno et al.,2006
- Grid size used in the analysis = 0.05
30
Ground Motion Prediction Equations
Seismic Micro zonation
Presented by
Engr.M.Nouman, EEC UET Peshawar, KP.
31
Ground Motion Maps
Seismic Micro zonation
Presented by
Engr.M.Nouman, EEC UET Peshawar, KP.
32
Levels Used in the Ground Motion Maps
The levels are divided according to the values used in Building Code
of Pakistan as follows:
1. ZONE 1 : 0.01-0.08 g
2. ZONE 2A : 0.08-0.16 g
3. ZONE 2B : 0.16-0.24 g
4. ZONE 3 : 0.24-0.32 g
5. ZONE 4 : > 0.32 g
Seismic Micro zonation
Presented by
Engr.M.Nouman, EEC UET Peshawar, KP.
33
Average of GMPEs Used for Shallow plus Deep Seismic Zones for 50yrs Return Period
Seismic Micro zonation
Presented by
Engr.M.Nouman, EEC UET Peshawar, KP.
34Seismic Micro zonation
Presented by
Engr.M.Nouman, EEC UET Peshawar, KP.
Average of GMPEs Used for Shallow plus Deep Seismic Zones 100yrs Return Period
35Seismic Micro zonation
Presented by
Engr.M.Nouman, EEC UET Peshawar, KP.
Average of GMPEs Used for Shallow plus Deep Seismic Zones 250yrs Return Period
36Seismic Micro zonation
Presented by
Engr.M.Nouman, EEC UET Peshawar, KP.
Average of GMPEs Used for Shallow plus Deep Seismic Zones 475yrs Return Period
37Seismic Micro zonation
Presented by
Engr.M.Nouman, EEC UET Peshawar, KP.
Average of GMPEs Used for Shallow plus Deep Seismic Zones 2500yrs Return Period
Seismic Microzonation

Seismic Microzonation

  • 1.
    Seismic Hazard Assessmentof KPK UET Presented By: Muhammad Nouman Supervised By: Engr. Dr. Naveed Ahmad
  • 2.
    2 Introduction  Seismic hazard: •A seismic hazard is the probability that an earthquake will occur in a given geographic area, within a given window of time, and with ground motion intensity exceeding a given threshold. • With a hazard thus estimated, risk can be assessed and included in such areas as building codes for standard buildings, designing larger buildings and infrastructure projects and land use planning. • In general terms, the seismic hazard defines the expected seismic ground motion at a site, phenomenon which may result in destructions and losses. Seismic Micro zonation Presented by Engr.M.Nouman, EEC UET Peshawar, KP.
  • 3.
    3 Introduction Seismic Micro zonation Presentedby Engr.M.Nouman, EEC UET Peshawar, KP.  Seismic hazard: • Two major approaches deterministic and probabilistic are worldwide used at present for seismic hazard assessment. • The deterministic approach takes into account a single, particular earthquake, the event that is expected to produce the strongest level of shaking at the site. • The outputs intensity, peak ground acceleration, peak ground velocity, peak ground displacement, response spectra may be used directly in engineering applications. • In the probabilistic approach, initiated with the pioneering work of Cornell, the seismic hazard is estimated in terms of a ground motion parameter intensity, peak ground acceleration and its annual probability of exceedance (or return period) at a site. • The method yields regional seismic probability maps, displaying contours of maximum ground motion (macroseismic intensity, PGA) of equal specified return period.
  • 4.
    Steps of Cornel’sApproach of PSHA 1. Study Area. 2. Sources Used as per compilation. 3. Composite catalogue. 4. Regression Analysis. 5. Homogenization of catalogue. 6. Declustering of Catalogue. 7. Plotting the Declustered Catalogue 8. Completeness analysis. 9. Zoning. 10. Recurrence Models . 11. Hazard computation using CRISIS-2007. Seismic Micro zonation Presented by Engr.M.Nouman, EEC UET Peshawar, KP.
  • 5.
    5 Introduction  Area ofResponsibility: • The area for which seismic hazard is to be computed, which is Khyber Pakhtunkhwa (KPK) in our case.  Area of influence (AI): • It is the region surrounding KPK Boundary in which if any earthquake occurs will affect KPK. • It is taken 200 Km area surrounding KPK. Area of influence 200 KM KPK Seismic Micro zonation Presented by Engr.M.Nouman, EEC UET Peshawar, KP. Area of Responsibility
  • 6.
    6 Sources used inthe compilation of the catalogue • The seismic event data was collected From the Following Sources (year 1500 to 2016). No. Sources 1 Ambrasey and Douglas (2004) 2 Ambrasey (2000) 3 Qittermeyer & Jacob (1979) 4 International Seismological Center (ISC) 5 Global – CMT 6 National Geophysical Data Center (NGDC) 7 USGS Seismic Micro zonation Presented by Engr.M.Nouman, EEC UET Peshawar, KP. 29.49824 S 38.72559 N 68.26591 W 75.88964 E
  • 7.
    • All thesources data was merged in excel sheet and Combined or Composite catalogue was formed. • It Consisted of 12788 Earthquake events. • The data is filtered and sorted. • All the duplicate events are colored which were reported in two or more sources. 7 Combined Catalogue Seismic Micro zonation Presented by Engr.M.Nouman, EEC UET Peshawar, KP.
  • 8.
    • Homogenization Relationships 8 Homogenization Relationship between Relationship(Equation) Mw & MS ≤ 6.2 Mw=0.5998Ms+2.3885 Mw& MS > 6.2 Mw=0.8573Ms+0.8806 Mw & Mb Mw=0.7998Mb+1.135 Mw & ML Mw=0.0487Ml+5.2428 Seismic Micro zonation Presented by Engr.M.Nouman, EEC UET Peshawar, KP.
  • 9.
    • Using therelationships shown above, all the sources data is converted to Mw. 9 Homogenization Seismic Micro zonation Presented by Engr.M.Nouman, EEC UET Peshawar, KP.
  • 10.
    • Sources Priority 10 Homogenization SeismicMicro zonation Presented by Engr.M.Nouman, EEC UET Peshawar, KP. 1) Ambrasey and Douglas (2004) 2) Ambrasey (2000) 3) Qittermeyer & Jacob (1979) 4) ISC 5) Global – CMT 6) NGDC 7) USGS
  • 11.
    11 The Homogenized Catalogue SeismicMicro zonation Presented by Engr.M.Nouman, EEC UET Peshawar, KP.
  • 12.
    1. DE-CLUSTERING : •Aftershocks And Foreshocks are temporally and spatially dependent on the main shocks. • De-clustering is performed to remove these dependent events from the catalogue. • The De-clustered Catalogue consists of independent events which is also known as Independent Catalogue. • The Method used is Gardner & Kenopoff 1974 De-clustering Algorithm. • The De-Clustering was done using ZMAP programming in MATLAB. 12 Processing of Earthquake Catalogue Seismic Micro zonation Presented by Engr.M.Nouman, EEC UET Peshawar, KP.
  • 13.
    13 The De-Clustered Catalogue SeismicMicro zonation Presented by Engr.M.Nouman, EEC UET Peshawar, KP.
  • 14.
    2. Completeness analysis(Visual inspection method) • One of the methods used for completeness is Visual Cumulative method (CUVI) formulated by Mulargia and Tinti (1985). • It is a simple, graphical procedure based on the observation that earthquakes follow a stationary occurrence process. • For a given magnitude class, the period of completeness is considered to begin at the earliest time when the slope of the fitting curve can be well approximated by a straight line. 14 Processing of Earthquake Catalogue Seismic Micro zonation Presented by Engr.M.Nouman, EEC UET Peshawar, KP.
  • 15.
    15 Completeness analysis (Visualinspection method) 0 100 200 300 400 500 600 700 800 1950 1960 1970 1980 1990 2000 2010 2020 Cumulativeno.ofevents Year Completeness (4-4.5) CP=1995 0 200 400 600 800 1000 1200 1950 1960 1970 1980 1990 2000 2010 2020 Cumulativeno.ofevents Year Completeness (4.6-5) 0 50 100 150 200 250 300 350 1900 1920 1940 1960 1980 2000 2020 2040 Cumulativeno.ofevents Year Completeness (5.1-5.5) 0 10 20 30 40 50 60 70 80 90 1880 1900 1920 1940 1960 1980 2000 2020 2040 Cumulativeno.ofevents Year Completeness (5.6-6) Seismic Micro zonation Presented by Engr.M.Nouman, EEC UET Peshawar, KP.
  • 16.
    16 Mw Average MwInterval Tc 4.0- 4.5 4.25 1995-2016 20 4.51 - 5.0 4.75 1984-2016 31 5.01 - 5.50 5.25 1973-2016 42 5.51 - 6.0 5.75 1961-2016 54 6.01 - 6.5.0 6.25 1931-2016 84 >= 6.6 6.75 1907-2016 108 0 5 10 15 20 25 30 35 1860 1880 1900 1920 1940 1960 1980 2000 2020 2040 Cumulativeno.ofevents Year Completeness (6.1-6.5) 0 5 10 15 20 25 30 1490 1590 1690 1790 1890 1990 2090 Cumulativeno.ofevents Year Completeness (6.6 onwards) Processing of the earthquake catalogue Seismic Micro zonation Presented by Engr.M.Nouman, EEC UET Peshawar, KP.
  • 17.
    17 Seismic sources consideredin the analysis (Building Code of Pakistan) Seismic Sources Georeferenced with map of Pakistan Seismic Micro zonation Presented by Engr.M.Nouman, EEC UET Peshawar, KP.
  • 18.
    18 Seismic Zones AfterDe-clustering: 1. Shallow Seismic Zones ( Depth < 50km ) Seismic Micro zonation Presented by Engr.M.Nouman, EEC UET Peshawar, KP.
  • 19.
    19 Shallow seismic zoneswith shallow events Zone No. of Earthquakes Minimum Mw Maximum Mw 1 482 4 7.7 2 90 4.2 6 3 104 4.3 7.6 4 149 4 7.6 5 48 4 6.8 6 75 4.3 5.9 7 154 4.2 6.4 8 42 4.1 6.4 Seismic Micro zonation Presented by Engr.M.Nouman, EEC UET Peshawar, KP.
  • 20.
    20 Deep Earthquake Zones SeismicMicro zonation Presented by Engr.M.Nouman, EEC UET Peshawar, KP.
  • 21.
    21 Deep seismic Zoneswith Events Zone No. of Earthquakes Minimum Mw Maximum Mw 1 726 4 7.5 2 165 4 6.7 3 110 4.3 5.9 Seismic Micro zonation Presented by Engr.M.Nouman, EEC UET Peshawar, KP.
  • 22.
    • The Gutenberg–Richterlaw(GR law) expresses the relationship between the magnitude and total number of earthquakes in any given region and time period of at least that magnitude. • Inputs for crisis needs the values of commutative frequency “N” or “λ” which is the number of magnitude earthquakes per year. It can be obtained from G-R relationship in recurrence model. • 22 Gutenberg–Richter law Seismic Micro zonation Presented by Engr.M.Nouman, EEC UET Peshawar, KP. log10 𝑁 = 𝑎 − 𝑏𝑀
  • 23.
    23 Gutenberg Richter Modelsfor Shallow Zones N = 10 5.612-1.0599Mw -2 -1.5 -1 -0.5 0 0.5 1 1.5 4 4.5 5 5.5 6 6.5 7 Cum.No.ofEQuakesperyear Mw G-R Model Shallow Zone 1 N = 10 3.879-0.9192Mw -1.6 -1.4 -1.2 -1 -0.8 -0.6 -0.4 -0.2 0 4 4.5 5 5.5 6 Cum.No.ofEQuakesperyear Mw G-R Model Shallow Zone 2 N = 10 5.3967-1.1539Mw -2.5 -2 -1.5 -1 -0.5 0 0.5 1 4 4.5 5 5.5 6 6.5 Cum.No.ofEQuakesperyear Mw G-R Model Shallow Zone 3 N = 10 4.996-1.0164Mw -2.5 -2 -1.5 -1 -0.5 0 0.5 1 4 4.5 5 5.5 6 6.5 7 Cum.No.ofEQuakesperyear Mw G-R Model Shallow Zone 4 Seismic Micro zonation Presented by Engr.M.Nouman, EEC UET Peshawar, KP.
  • 24.
    24 Gutenberg Richter Modelsfor Shallow Zones N = 10 4.3117-1.007Mw -1.2 -1 -0.8 -0.6 -0.4 -0.2 0 0.2 4 4.2 4.4 4.6 4.8 5 5.2 5.4 Cum.No.ofEQuakesperyear Mw G-R Model Shallow Zone 5 y = 10 6.0562-1.3219Mw -2 -1.5 -1 -0.5 0 0.5 1 4 4.5 5 5.5 6 Cum.No.ofEQuakesperyear Mw G-R Model Shallow Zone 6 N = 10 6.1028-1.2411Mw -2.5 -2 -1.5 -1 -0.5 0 0.5 1 4 4.5 5 5.5 6 6.5 Cum.No.ofEQuakesperyear Mw G-R Model Shallow Zone 7 N = 10 4.104 -0.9684Mw -1.2 -1 -0.8 -0.6 -0.4 -0.2 0 4 4.2 4.4 4.6 4.8 5 5.2 5.4 Cum.No.ofEQuakesperyear Mw G-R Model Shallow Zone 8 Seismic Micro zonation Presented by Engr.M.Nouman, EEC UET Peshawar, KP.
  • 25.
    25 G-R Parameters forShallow Zones Seismic Zone a b 1 5.612 1.0599 2 3.879 0.9192 3 5.3967 1.1539 4 4.996 1.0164 5 4.3117 1.007 6 6.0562 1.3219 7 6.1028 1.2411 8 4.104 0.9684 Seismic Micro zonation Presented by Engr.M.Nouman, EEC UET Peshawar, KP.
  • 26.
    26 G-R models fordeep seismic zones G-R Parameters for Deep Zones N = 10 5.7137-1.2193Mw -3 -2.5 -2 -1.5 -1 -0.5 0 0.5 1 4 4.5 5 5.5 6 6.5 7 Cum.No.ofEQuakesperyear Mw G-R Model Deep ZONE 2 N = 10 4.6056-1.0108Mw -1 -0.8 -0.6 -0.4 -0.2 0 0.2 0.4 4 4.2 4.4 4.6 4.8 5 5.2 5.4 Cum.No.ofEQuakesperyear Mw G-R Model Deep ZONE 3 Seismic Zone a b 1 4.9046 0.8564 2 5.7137 1.2193 3 4.6056 1.0108 N = 10 4.9046-0.8564Mw -1 -0.5 0 0.5 1 1.5 4 4.5 5 5.5 6 6.5 7 Cum.No.ofEQuakesperyear Mw G-R Model Deep ZONE 1 Seismic Micro zonation Presented by Engr.M.Nouman, EEC UET Peshawar, KP.
  • 27.
    • Inputs forcrisis needs the values of commutative frequency “λ” which is the number of magnitude earthquakes per year. It can be obtained from G-R relationship in recurrence model. • Log (λ) = a-b*M o α=a*2.303 o β=b*2.303 27 Hazard Computation Using CRISIS 2007 Seismic Micro zonation Presented by Engr.M.Nouman, EEC UET Peshawar, KP.
  • 28.
    • Shallow Zones 28 CRISISInput Parameters Seismic Zone a b λ M0 Mmax α β 1 5.612 1.0599 23.57 4 6.8 12.92444 2.44095 2 3.879 0.9192 1.59 4 5.8 8.933337 2.116918 3 5.3967 1.1539 6.04 4 6.3 12.4286 2.657432 4 4.996 1.0164 8.52 4 6.8 11.50579 2.340769 5 4.3117 1.007 1.92 4 5.3 9.929845 2.319121 6 6.0562 1.3219 5.87 4 5.8 13.94743 3.044336 7 6.1028 1.2411 13.75 4 6.3 14.05475 2.858253 8 4.104 0.9684 1.7 4 5.3 9.451512 2.230225 Seismic Micro zonation Presented by Engr.M.Nouman, EEC UET Peshawar, KP.
  • 29.
    29 • Deep Zones CRISISInput Parameters Seismic Zone a b λ M0 Mmax α β 1 4.9046 0.8564 30.13 4 6.8 11.29529 1.972289 2 5.7137 1.2193 6.86 4 6.8 13.15865 2.808048 3 4.6056 1.0108 3.65 4 5.3 10.6067 2.327872 Seismic Micro zonation Presented by Engr.M.Nouman, EEC UET Peshawar, KP.
  • 30.
     For ShallowZones: 1. Akkar and Boomer ,2010 2. Bore and Atkinson,NGA 2008  For Deep Zones: 1. Lin and Lee ,2008 2. Kanno et al.,2006 - Grid size used in the analysis = 0.05 30 Ground Motion Prediction Equations Seismic Micro zonation Presented by Engr.M.Nouman, EEC UET Peshawar, KP.
  • 31.
    31 Ground Motion Maps SeismicMicro zonation Presented by Engr.M.Nouman, EEC UET Peshawar, KP.
  • 32.
    32 Levels Used inthe Ground Motion Maps The levels are divided according to the values used in Building Code of Pakistan as follows: 1. ZONE 1 : 0.01-0.08 g 2. ZONE 2A : 0.08-0.16 g 3. ZONE 2B : 0.16-0.24 g 4. ZONE 3 : 0.24-0.32 g 5. ZONE 4 : > 0.32 g Seismic Micro zonation Presented by Engr.M.Nouman, EEC UET Peshawar, KP.
  • 33.
    33 Average of GMPEsUsed for Shallow plus Deep Seismic Zones for 50yrs Return Period Seismic Micro zonation Presented by Engr.M.Nouman, EEC UET Peshawar, KP.
  • 34.
    34Seismic Micro zonation Presentedby Engr.M.Nouman, EEC UET Peshawar, KP. Average of GMPEs Used for Shallow plus Deep Seismic Zones 100yrs Return Period
  • 35.
    35Seismic Micro zonation Presentedby Engr.M.Nouman, EEC UET Peshawar, KP. Average of GMPEs Used for Shallow plus Deep Seismic Zones 250yrs Return Period
  • 36.
    36Seismic Micro zonation Presentedby Engr.M.Nouman, EEC UET Peshawar, KP. Average of GMPEs Used for Shallow plus Deep Seismic Zones 475yrs Return Period
  • 37.
    37Seismic Micro zonation Presentedby Engr.M.Nouman, EEC UET Peshawar, KP. Average of GMPEs Used for Shallow plus Deep Seismic Zones 2500yrs Return Period