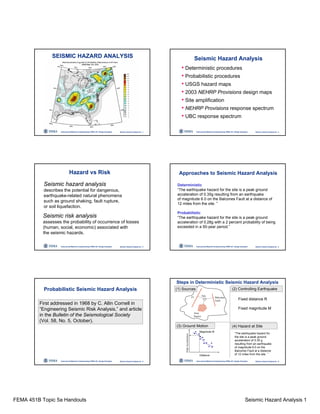
This document provides an overview of seismic hazard analysis, including both deterministic and probabilistic procedures. It discusses key aspects of probabilistic seismic hazard analysis such as determining earthquake sources, developing ground motion estimates, and representing hazards in the form of uniform hazard spectra or seismic hazard curves. The document uses examples and illustrations to explain concepts like attenuation relationships, recurrence models, and incorporating uncertainty in probabilistic analyses.
Shear wave velocity and Geology Based Seismic Microzonation of Port-au-Prince...Johana Sharmin
This is a presentation entirely based on the paper published by Brady R. Cox and his team. I just focused on the key points of the paper in the presentation.
Shear wave velocity and Geology Based Seismic Microzonation of Port-au-Prince...Johana Sharmin
This is a presentation entirely based on the paper published by Brady R. Cox and his team. I just focused on the key points of the paper in the presentation.
Seismic Refraction Test
Subsurface investigation by seismic refraction
Seismic Data Analysis
Seismic refraction instrumental set up and operation
P-waves velocity ranges for different strata
identification of ground water potential zones using gis and remote sensingtp jayamohan
the identification of ground water potential zones using gis and remote sensing.The study is conducted in the Muvattupuzha block.The various parameters used are geology,geomorphology,rainfall,soil type,etc.
Zed-Sales™ - a flagship product of Zed-Axis Technologies Pvt. Ltd.Rakesh Kumar
Zed-Sales™ is a completely web-based solution which streamlines channel sales & distribution activities of manufacturers, distribution partners and everyone involved in the sales function of the company. Zed-Sales™ helps the manufacturers and distribution partners to seamlessly collaborate on a single platform and fuel business growth in the ever dynamic business environment.
The objective of this project is to calculate the factor of safety of a complex slope situation. The stress distribution zones are also shown in the project. The probability of slope failure can be shown using FLAC3D software.
Introduction to back analysis;
Definition- Back analysis;
Historical Review- back analysis;
Factors affecting back analysis;
Steps to perform back analysis;
Solved numerical for demonstration of back analysis;
Practical Problems and limitations of back analysis;
Advantages of back analysis
How to make back analysis accurate?;
Concluding remarks;
Selected References; back analysis procedure;
Back analysis in slope stability problems
This is a slightly modified version of the powerpoint that I presented for the 2010 conference for the International Society of Explosives Engineers. If you would like a copy, please contact me.
2nd Presentation: Risk Assessment
2nd Seminar, "Seismic Risk assessment for Kathmandu Valley" was held on 11th April, 2017, at Hotel Yak and Yeti (Durbarmarg, Kathmandu), for dissemination of results of Seismic Risk Assessment of 'The Project for Assessment of Earthquake Disaster Risk Assessment for the Kathmandu Valley (JICA)'
Inverse Scattering Series & Seismic Exploration - Topical Review by Arthur We...Arthur Weglein
Topical Review on the "Inverse Scattering Series & Seismic Exploration" - Seismic research by Arthur Weglein, Director M-OSRP & Professor Department of Physic University of Houston
2nd Presentation: Risk Assessment
2nd Seminar, "Seismic Risk assessment for Kathmandu Valley" was held on 11th April, 2017, at Hotel Yak and Yeti (Durbarmarg, Kathmandu), for dissemination of results of Seismic Risk Assessment of 'The Project for Assessment of Earthquake Disaster Risk Assessment for the Kathmandu Valley (JICA)'
The performance of soil slope during an earthquake is generally analyzed by three different approaches which are pseudo-static methods, Newmark’s Sliding Block method and numerical techniques. In pseudo-static approach, the effects of an earthquake are represented by constant vertical (kv) and horizontal (kh) seismic acceleration coefficients and the factor of safety is evaluated by using limit equilibrium or limit analysis or finite element method of analysis. Newmark’s sliding block method evaluates the expected displacement of slope subjected to any ground motion obtained from the integration of the equation of motion for a rigid block sliding in an inclined plane. Numerical methods determine the expected displacements obtained from the stress – strain relationship of a soil mass. In this paper the stability of a model soil slope, comprising of an embankment with two canal bunds at the top, at different stages of construction, i.e. only embankment, embankment with empty canal bunds and embankment with canal bunds filled with water, with different foundation soils in different seismic zones have been analyzed and results have been plotted in the form of variation of factor of safety with horizontal seismic acceleration coefficient (kh). The critical case has been further analyzed under dynamic conditions. Dynamic analyses have been carried out by plotting the response spectrum curve and selecting 2001 Bhuj earthquake motion as the typical ground motion.
Similar to Topic05a seismic hazardanalysishandouts (20)
Multi-source connectivity as the driver of solar wind variability in the heli...Sérgio Sacani
The ambient solar wind that flls the heliosphere originates from multiple
sources in the solar corona and is highly structured. It is often described
as high-speed, relatively homogeneous, plasma streams from coronal
holes and slow-speed, highly variable, streams whose source regions are
under debate. A key goal of ESA/NASA’s Solar Orbiter mission is to identify
solar wind sources and understand what drives the complexity seen in the
heliosphere. By combining magnetic feld modelling and spectroscopic
techniques with high-resolution observations and measurements, we show
that the solar wind variability detected in situ by Solar Orbiter in March
2022 is driven by spatio-temporal changes in the magnetic connectivity to
multiple sources in the solar atmosphere. The magnetic feld footpoints
connected to the spacecraft moved from the boundaries of a coronal hole
to one active region (12961) and then across to another region (12957). This
is refected in the in situ measurements, which show the transition from fast
to highly Alfvénic then to slow solar wind that is disrupted by the arrival of
a coronal mass ejection. Our results describe solar wind variability at 0.5 au
but are applicable to near-Earth observatories.
(May 29th, 2024) Advancements in Intravital Microscopy- Insights for Preclini...Scintica Instrumentation
Intravital microscopy (IVM) is a powerful tool utilized to study cellular behavior over time and space in vivo. Much of our understanding of cell biology has been accomplished using various in vitro and ex vivo methods; however, these studies do not necessarily reflect the natural dynamics of biological processes. Unlike traditional cell culture or fixed tissue imaging, IVM allows for the ultra-fast high-resolution imaging of cellular processes over time and space and were studied in its natural environment. Real-time visualization of biological processes in the context of an intact organism helps maintain physiological relevance and provide insights into the progression of disease, response to treatments or developmental processes.
In this webinar we give an overview of advanced applications of the IVM system in preclinical research. IVIM technology is a provider of all-in-one intravital microscopy systems and solutions optimized for in vivo imaging of live animal models at sub-micron resolution. The system’s unique features and user-friendly software enables researchers to probe fast dynamic biological processes such as immune cell tracking, cell-cell interaction as well as vascularization and tumor metastasis with exceptional detail. This webinar will also give an overview of IVM being utilized in drug development, offering a view into the intricate interaction between drugs/nanoparticles and tissues in vivo and allows for the evaluation of therapeutic intervention in a variety of tissues and organs. This interdisciplinary collaboration continues to drive the advancements of novel therapeutic strategies.
Seminar of U.V. Spectroscopy by SAMIR PANDASAMIR PANDA
Spectroscopy is a branch of science dealing the study of interaction of electromagnetic radiation with matter.
Ultraviolet-visible spectroscopy refers to absorption spectroscopy or reflect spectroscopy in the UV-VIS spectral region.
Ultraviolet-visible spectroscopy is an analytical method that can measure the amount of light received by the analyte.
Introduction:
RNA interference (RNAi) or Post-Transcriptional Gene Silencing (PTGS) is an important biological process for modulating eukaryotic gene expression.
It is highly conserved process of posttranscriptional gene silencing by which double stranded RNA (dsRNA) causes sequence-specific degradation of mRNA sequences.
dsRNA-induced gene silencing (RNAi) is reported in a wide range of eukaryotes ranging from worms, insects, mammals and plants.
This process mediates resistance to both endogenous parasitic and exogenous pathogenic nucleic acids, and regulates the expression of protein-coding genes.
What are small ncRNAs?
micro RNA (miRNA)
short interfering RNA (siRNA)
Properties of small non-coding RNA:
Involved in silencing mRNA transcripts.
Called “small” because they are usually only about 21-24 nucleotides long.
Synthesized by first cutting up longer precursor sequences (like the 61nt one that Lee discovered).
Silence an mRNA by base pairing with some sequence on the mRNA.
Discovery of siRNA?
The first small RNA:
In 1993 Rosalind Lee (Victor Ambros lab) was studying a non- coding gene in C. elegans, lin-4, that was involved in silencing of another gene, lin-14, at the appropriate time in the
development of the worm C. elegans.
Two small transcripts of lin-4 (22nt and 61nt) were found to be complementary to a sequence in the 3' UTR of lin-14.
Because lin-4 encoded no protein, she deduced that it must be these transcripts that are causing the silencing by RNA-RNA interactions.
Types of RNAi ( non coding RNA)
MiRNA
Length (23-25 nt)
Trans acting
Binds with target MRNA in mismatch
Translation inhibition
Si RNA
Length 21 nt.
Cis acting
Bind with target Mrna in perfect complementary sequence
Piwi-RNA
Length ; 25 to 36 nt.
Expressed in Germ Cells
Regulates trnasposomes activity
MECHANISM OF RNAI:
First the double-stranded RNA teams up with a protein complex named Dicer, which cuts the long RNA into short pieces.
Then another protein complex called RISC (RNA-induced silencing complex) discards one of the two RNA strands.
The RISC-docked, single-stranded RNA then pairs with the homologous mRNA and destroys it.
THE RISC COMPLEX:
RISC is large(>500kD) RNA multi- protein Binding complex which triggers MRNA degradation in response to MRNA
Unwinding of double stranded Si RNA by ATP independent Helicase
Active component of RISC is Ago proteins( ENDONUCLEASE) which cleave target MRNA.
DICER: endonuclease (RNase Family III)
Argonaute: Central Component of the RNA-Induced Silencing Complex (RISC)
One strand of the dsRNA produced by Dicer is retained in the RISC complex in association with Argonaute
ARGONAUTE PROTEIN :
1.PAZ(PIWI/Argonaute/ Zwille)- Recognition of target MRNA
2.PIWI (p-element induced wimpy Testis)- breaks Phosphodiester bond of mRNA.)RNAse H activity.
MiRNA:
The Double-stranded RNAs are naturally produced in eukaryotic cells during development, and they have a key role in regulating gene expression .
A brief information about the SCOP protein database used in bioinformatics.
The Structural Classification of Proteins (SCOP) database is a comprehensive and authoritative resource for the structural and evolutionary relationships of proteins. It provides a detailed and curated classification of protein structures, grouping them into families, superfamilies, and folds based on their structural and sequence similarities.
1. FEMA 451B Topic 5a Handouts Seismic Hazard Analysis 1
Instructional Material Complementing FEMA 451, Design Examples Seismic Hazard Analysis 5a - 1
SEISMIC HAZARD ANALYSIS
Instructional Material Complementing FEMA 451, Design Examples Seismic Hazard Analysis 5a - 2
Seismic Hazard Analysis
• Deterministic procedures
• Probabilistic procedures
• USGS hazard maps
• 2003 NEHRP Provisions design maps
• Site amplification
• NEHRP Provisions response spectrum
• UBC response spectrum
Instructional Material Complementing FEMA 451, Design Examples Seismic Hazard Analysis 5a - 3
Seismic hazard analysis
describes the potential for dangerous,
earthquake-related natural phenomena
such as ground shaking, fault rupture,
or soil liquefaction.
Seismic risk analysis
assesses the probability of occurrence of losses
(human, social, economic) associated with
the seismic hazards.
Hazard vs Risk
Instructional Material Complementing FEMA 451, Design Examples Seismic Hazard Analysis 5a - 4
Approaches to Seismic Hazard Analysis
Deterministic
“The earthquake hazard for the site is a peak ground
acceleration of 0.35g resulting from an earthquake
of magnitude 6.0 on the Balcones Fault at a distance of
12 miles from the site. ”
Probabilistic
“The earthquake hazard for the site is a peak ground
acceleration of 0.28g with a 2 percent probability of being
exceeded in a 50-year period.”
Instructional Material Complementing FEMA 451, Design Examples Seismic Hazard Analysis 5a - 5
Probabilistic Seismic Hazard Analysis
First addressed in 1968 by C. Allin Cornell in
“Engineering Seismic Risk Analysis,” and article
in the Bulletin of the Seismological Society
(Vol. 58, No. 5, October).
Instructional Material Complementing FEMA 451, Design Examples Seismic Hazard Analysis 5a - 6
F1 Balcones
Fault
Area
Source
Site
Fixed distance R
Fixed magnitude M
“The earthquake hazard for
the site is a peak ground
acceleration of 0.35 g
resulting from an earthquake
of magnitude 6.0 on the
Balcones Fault at a distance
of 12 miles from the site. ”
Magnitude M
Distance
PeakAcceleration
(2) Controlling Earthquake
Steps in Deterministic Seismic Hazard Analysis
(1) Sources
(4) Hazard at Site(3) Ground Motion
2. FEMA 451B Topic 5a Handouts Seismic Hazard Analysis 2
Instructional Material Complementing FEMA 451, Design Examples Seismic Hazard Analysis 5a - 7
Fault Fault
Area
Source
Site
Fault
Localizing
structure
Seismotectonic
province
Source Types
Instructional Material Complementing FEMA 451, Design Examples Seismic Hazard Analysis 5a - 8
Localizing structure: An identifiable geological
structure that is assumed to generate or “localize”
earthquakes. This is generally a concentration of
known or unknown active faults.
Seismotectonic province: A region where there
is a known seismic hazard but where there are no
identifiable active faults or localizing structures.
Source Types
Instructional Material Complementing FEMA 451, Design Examples Seismic Hazard Analysis 5a - 9
Maximum Earthquake
Maximum possible earthquake: An upper bound to
size (however unlikely) determined by earthquake processes (e.g.,
maximum seismic moment).
Maximum credible earthquake: The maximum
reasonable earthquake size based on earthquake processes (but
does not imply likely occurrence).
Maximum historic earthquake: The maximum historic
or instrumented earthquake that is often a lower bound on
maximum possible or maximum credible earthquake.
Maximum considered earthquake: Described
later.
Instructional Material Complementing FEMA 451, Design Examples Seismic Hazard Analysis 5a - 10
Ground Motion Attenuation
Reasons:
• Geometric spreading
• Absorption (damping)
Magnitude M
Distance
GroundMotionParameter
Instructional Material Complementing FEMA 451, Design Examples Seismic Hazard Analysis 5a - 11
Attenuation with Distance
Instructional Material Complementing FEMA 451, Design Examples Seismic Hazard Analysis 5a - 12
Comparison of Attenuation for Four Earthquakes
3. FEMA 451B Topic 5a Handouts Seismic Hazard Analysis 3
Instructional Material Complementing FEMA 451, Design Examples Seismic Hazard Analysis 5a - 13
Ground Motion Attenuation
Steps to Obtain Empirical Relationship
1. Obtain catalog of appropriate ground motion records
2. Correct for aftershocks, foreshocks
3. Correct for consistent magnitude measure
4. Fit data to empirical relationship of type:
εln)(ln),(ln)(ln)(lnˆln 43211 +++++= iPfRMfRfMfbY
Instructional Material Complementing FEMA 451, Design Examples Seismic Hazard Analysis 5a - 14
Ground Motion Attenuation
Basic Empirical Relationships
εln)(ln),(ln)(ln)(lnˆln 43211 +++++= iPfRMfRfMfbY
1b
)(1 Mf
)(2 Rf
),(3 RMf
)(4 iPf
ε
Scaling factor
Function of magnitude
Function of distance
Function of magnitude and distance
Other variables
Error term
Yˆ Ground motion parameter (e.g. PGA)
Instructional Material Complementing FEMA 451, Design Examples Seismic Hazard Analysis 5a - 15
Ground Motion Attenuation
Relationships for Different Conditions
• Central and eastern United States
• Subduction zone earthquakes
• Shallow crustal earthquakes
• Near-source attenuation
• Extensional tectonic regions
• Many others
May be developed for any desired quantity (PGA,
PGV, spectral response).
Instructional Material Complementing FEMA 451, Design Examples Seismic Hazard Analysis 5a - 16
Ground Motion Attenuation
Relationships
Seismological Research Letters
Volume 68, Number 1
January/February, 1997
Instructional Material Complementing FEMA 451, Design Examples Seismic Hazard Analysis 5a - 17
Earthquake Catalog for Shallow Crustal Earthquakes
(Sadigh, Chang, Egan, Makdisi, and Youngs)
Instructional Material Complementing FEMA 451, Design Examples Seismic Hazard Analysis 5a - 18
Earthquake Catalog for Shallow Crustal Earthquakes
(Sadigh, Chang, Egan, Makdisi, and Youngs)
5. FEMA 451B Topic 5a Handouts Seismic Hazard Analysis 5
Instructional Material Complementing FEMA 451, Design Examples Seismic Hazard Analysis 5a - 25
0.0001
0.001
0.01
0.1
1
10
100
1000
0 2 4 6 8 10
Magnitude
MeanAnnualRateofExceedance
Empirical Gutenberg-Richter
Recurrence Relationship
bmam −=λlog
mλ = mean rate of
recurrence
(events/year)
a and b to be deter-
mined from data
λm
mλ/1 = return period
Instructional Material Complementing FEMA 451, Design Examples Seismic Hazard Analysis 5a - 26
0.000001
0.00001
0.0001
0.001
0.01
0.1
1
10
100
1000
0 2 4 6 8 10
Magnitude
MeanAnnualRateofExceedance
Unbounded
Bounded
Bounded vs Unbounded
Recurrence Relationship
Instructional Material Complementing FEMA 451, Design Examples Seismic Hazard Analysis 5a - 27
Uncertainties Included in
Probabilistic Analysis
Attenuation laws
Recurrence relationship
Distance to site
][][],*[
1 1 1
* kjkj
N
i
N
j
N
k
iy rRPmMPrmyYPv
S M R
==>= ∑∑∑= = =
λ
Instructional Material Complementing FEMA 451, Design Examples Seismic Hazard Analysis 5a - 28
Source 1
Source 2
Source 3
Site
D1=?
D2=?D3
Source 1
Source 2
Source 3
Site
Example Probabilistic Analysis (Kramer)
M2=?
M3=?
M1=?
A1=?
A3=?
A2=?
Instructional Material Complementing FEMA 451, Design Examples Seismic Hazard Analysis 5a - 29
Source 1
Source 2
Source 3
Site
0.0 0.2 0.4 0.6 0.8
10-6
10-4
10-2
10-0
10-7
10-5
10-3
10-1
10-1
10-8
Peak Horizontal Acceleration (g)
MeanAnnualRateofExceedance
Source 1
Source 2
Source 3
All Source Zones
SEISMIC HAZARD CURVE
Result of Probabilistic Hazard Analysis
Instructional Material Complementing FEMA 451, Design Examples Seismic Hazard Analysis 5a - 30
1
10
100
1000
10000
0 20 40 60 80 100
Period of Interest (years)
ReturnPeriod(years)
2%
10%
20%
30%
40%
50%
2475
474
50
Relationship Between Return Period, Period of Interest,
and Probability of Exceedance
Return period = -T/ln(1-P(Z>z))
6. FEMA 451B Topic 5a Handouts Seismic Hazard Analysis 6
Instructional Material Complementing FEMA 451, Design Examples Seismic Hazard Analysis 5a - 31
0.0 0.2 0.4 0.6 0.8
10-6
10-4
10-2
10-0
10-7
10-5
10-3
10-1
10-1
10-8
Peak Horizontal Acceleration (g)
MeanAnnualRateofExceedance
SEISMIC HAZARD CURVE
PGA=0.33g
10% probability in 50 years
Return period = 475 years
Rate of exceedance = 1/475=0.0021
Use of PGA Seismic Hazard Curve
Period, T (sec)
Acceleration,g
0.0 0.5 1.0 1.5
0.2
0.4
0.6
0.8
10% in 50 year
elastic response
spectrum
Instructional Material Complementing FEMA 451, Design Examples Seismic Hazard Analysis 5a - 32
0.0 0.2 0.4 0.6 0.8
10-6
10-4
10-2
10-0
10-7
10-5
10-3
10-1
10-1
10-8
0.2 Sec Spectral Acceleration (g)
MeanAnnualRateofExceedance
SEISMIC HAZARD CURVE
PGA = 0.55g
10% probability in 50 years
Return period = 475 years
rate of exceedance = 1/475=0.0021
Use of 0.2 Sec. Seismic Hazard Curve
Period, T (sec)
Acceleration,g
0.0 0.5 1.0 1.5
0.2
0.4
0.6
0.8
10% in 50 year
Elastic Response
Spectrum
Instructional Material Complementing FEMA 451, Design Examples Seismic Hazard Analysis 5a - 33
Period, T (sec)
Acceleration,g
0.0 0.5 1.0 1.5
0.2
0.4
0.6
0.8
10% in 50 Year Elastic
Response Spectrum
Instructional Material Complementing FEMA 451, Design Examples Seismic Hazard Analysis 5a - 34
Uniform Hazard Spectrum
Large distant
earthquake
Small nearby
earthquake
Uniform hazard spectrum
Period
Response
Instructional Material Complementing FEMA 451, Design Examples Seismic Hazard Analysis 5a - 35
Uniform Hazard Spectrum
All ordinates have equal probability of exceedance
Developed from probabilistic analysis
Represents contributions from small local,
large distant earthquakes
May be overly conservative for modal response
spectrum analysis
May not be appropriate for artificial ground motion
generation
Instructional Material Complementing FEMA 451, Design Examples Seismic Hazard Analysis 5a - 36
Probabilistic vs Deterministic
Seismic Hazard Analysis
“The deterministic approach provides a clear and
trackable method of computing seismic hazard whose
assumptions are easily discerned. It provides
understandable scenarios that can be related to the
problem at hand.”
“However, it has no way for accounting for uncertainty.
Conclusions based on deterministic analysis can easily
be upset by the occurrence of new earthquakes.”
7. FEMA 451B Topic 5a Handouts Seismic Hazard Analysis 7
Instructional Material Complementing FEMA 451, Design Examples Seismic Hazard Analysis 5a - 37
Probabilistic vs Deterministic
Seismic Hazard Analysis
“The probabilistic approach is capable of integrating
a wide range of information and uncertainties into
a flexible framework.”
“Unfortunately, its highly integrated framework can
obscure those elements which drive the results, and its
highly quantitative nature can lead to false impressions
of accuracy.”
Instructional Material Complementing FEMA 451, Design Examples Seismic Hazard Analysis 5a - 38
USGS Probabilistic Hazard Maps (Project 97)
0.0
0.5
1.0
1.5
2.0
2.5
0 0.5 1 1.5 2 2.5
Period (sec)
SpectralResponseAcceleration(g)
2% in 50 years 10% in 50 years
HAZARD MAP RESPONSE SPECTRA
Instructional Material Complementing FEMA 451, Design Examples Seismic Hazard Analysis 5a - 39
USGS Probabilistic Hazard Maps
(and NEHRP Provisions Maps)
Earthquake Spectra, Seismic Design Provisions and
Guidelines Theme Issue, Volume 16, Number 1,
February 2000
Instructional Material Complementing FEMA 451, Design Examples Seismic Hazard Analysis 5a - 40
Maximum Considered Earthquake (MCE)
The MCE ground motions are defined as
the maximum level of earthquake shaking
that is considered as reasonable to design
normal structures to resist.
Instructional Material Complementing FEMA 451, Design Examples Seismic Hazard Analysis 5a - 41
USGS Seismic Hazard Regions
Note: Different attenuation relationships used for different regions.
Instructional Material Complementing FEMA 451, Design Examples Seismic Hazard Analysis 5a - 42
USGS Seismic Hazard WUS Faults
8. FEMA 451B Topic 5a Handouts Seismic Hazard Analysis 8
Instructional Material Complementing FEMA 451, Design Examples Seismic Hazard Analysis 5a - 43
USGS Seismic Hazard Curves for Various Cities
Instructional Material Complementing FEMA 451, Design Examples Seismic Hazard Analysis 5a - 44
Uniform Hazard Spectra for San Francisco
0.0
0.5
1.0
1.5
2.0
2.5
0 0.5 1 1.5 2 2.5
Period (sec)
SpectralResponseAcceleration(g)
2% in 50 years 10% in 50 years
Instructional Material Complementing FEMA 451, Design Examples Seismic Hazard Analysis 5a - 45
Uniform Hazard Spectra for Charleston, SC
0.0
0.2
0.4
0.6
0.8
1.0
1.2
1.4
1.6
1.8
2.0
0 0.5 1 1.5 2 2.5
Period (sec)
SpectralResponseAcceleration(g)
2% in 50 years 10% in 50 years
Instructional Material Complementing FEMA 451, Design Examples Seismic Hazard Analysis 5a - 46
USGS Seismic Hazard Map of Coterminous United States
http://earthquake.usgs.gov/hazmaps/
Instructional Material Complementing FEMA 451, Design Examples Seismic Hazard Analysis 5a - 47
USGS Seismic Hazard Map of Coterminous United States
Instructional Material Complementing FEMA 451, Design Examples Seismic Hazard Analysis 5a - 48
USGS Seismic Hazard Map for Coterminous United States
9. FEMA 451B Topic 5a Handouts Seismic Hazard Analysis 9
Instructional Material Complementing FEMA 451, Design Examples Seismic Hazard Analysis 5a - 49
USGS Map for Central and Eastern United States
Instructional Material Complementing FEMA 451, Design Examples Seismic Hazard Analysis 5a - 50
USGS Map for Central and Eastern United States
Instructional Material Complementing FEMA 451, Design Examples Seismic Hazard Analysis 5a - 51
USGS Map for Central and Eastern United States
Instructional Material Complementing FEMA 451, Design Examples Seismic Hazard Analysis 5a - 52
USGS Map for Western United States
Instructional Material Complementing FEMA 451, Design Examples Seismic Hazard Analysis 5a - 53
USGS Map for Western United States
Instructional Material Complementing FEMA 451, Design Examples Seismic Hazard Analysis 5a - 54
USGS Map for Western United States
10. FEMA 451B Topic 5a Handouts Seismic Hazard Analysis 10
Instructional Material Complementing FEMA 451, Design Examples Seismic Hazard Analysis 5a - 55
USGS Map for California
Instructional Material Complementing FEMA 451, Design Examples Seismic Hazard Analysis 5a - 56
USGS Map for California
Instructional Material Complementing FEMA 451, Design Examples Seismic Hazard Analysis 5a - 57
USGS Map for California
Instructional Material Complementing FEMA 451, Design Examples Seismic Hazard Analysis 5a - 58
USGS Map for Pacific Northwest
Instructional Material Complementing FEMA 451, Design Examples Seismic Hazard Analysis 5a - 59
USGS Map for Pacific Northwest
Instructional Material Complementing FEMA 451, Design Examples Seismic Hazard Analysis 5a - 60
USGS Map for Pacific Northwest
11. FEMA 451B Topic 5a Handouts Seismic Hazard Analysis 11
Instructional Material Complementing FEMA 451, Design Examples Seismic Hazard Analysis 5a - 61
USGS Seismic Hazard Map of Coterminous United States
Instructional Material Complementing FEMA 451, Design Examples Seismic Hazard Analysis 5a - 62
USGS Seismic Hazard Map of Coterminous United States
Instructional Material Complementing FEMA 451, Design Examples Seismic Hazard Analysis 5a - 63
USGS Seismic Hazard Map of Coterminous United States
Instructional Material Complementing FEMA 451, Design Examples Seismic Hazard Analysis 5a - 64
USGS Map for Central and Eastern United States
Instructional Material Complementing FEMA 451, Design Examples Seismic Hazard Analysis 5a - 65
USGS Map for Central and Eastern United States
Instructional Material Complementing FEMA 451, Design Examples Seismic Hazard Analysis 5a - 66
USGS Map for Central and Eastern United States
12. FEMA 451B Topic 5a Handouts Seismic Hazard Analysis 12
Instructional Material Complementing FEMA 451, Design Examples Seismic Hazard Analysis 5a - 67
USGS Map for Western United States
Instructional Material Complementing FEMA 451, Design Examples Seismic Hazard Analysis 5a - 68
USGS Map for Western United States
Instructional Material Complementing FEMA 451, Design Examples Seismic Hazard Analysis 5a - 69
USGS Map for Western United States
Instructional Material Complementing FEMA 451, Design Examples Seismic Hazard Analysis 5a - 70
USGS Map for California
Instructional Material Complementing FEMA 451, Design Examples Seismic Hazard Analysis 5a - 71
USGS Map for California
Instructional Material Complementing FEMA 451, Design Examples Seismic Hazard Analysis 5a - 72
USGS Map for California
13. FEMA 451B Topic 5a Handouts Seismic Hazard Analysis 13
Instructional Material Complementing FEMA 451, Design Examples Seismic Hazard Analysis 5a - 73
USGS Map for Pacific Northwest
Instructional Material Complementing FEMA 451, Design Examples Seismic Hazard Analysis 5a - 74
USGS Map for Pacific Northwest
Instructional Material Complementing FEMA 451, Design Examples Seismic Hazard Analysis 5a - 75
USGS Map for Pacific Northwest
Instructional Material Complementing FEMA 451, Design Examples Seismic Hazard Analysis 5a - 76
USGS Website for Map Values
http://earthquake.usgs.gov/research/hazmaps/design/
The input zipcode is 80203. (DENVER)
ZIP CODE 80203
LOCATION 39.7310 Lat. -104.9815 Long.
DISTANCE TO NEAREST GRID POINT 3.7898 kms
NEAREST GRID POINT 39.7 Lat. -105.0 Long.
Probabilistic ground motion values, in %g, at the Nearest Grid
point are:
10%PE in 50 yr 5%PE in 50 yr 2%PE in 50 yr
PGA 3.299764 5.207589 9.642159
0.2 sec SA 7.728900 11.917400 19.921591
0.3 sec SA 6.178438 9.507714 16.133711
1.0 sec SA 2.334019 3.601994 5.879917
CAUTION: USE OF ZIPCODES IS DISCOURAGED; LAT-LONG VALUES WILL GIVE
ACCURATE RESULTS.
Instructional Material Complementing FEMA 451, Design Examples Seismic Hazard Analysis 5a - 77
Relative PGAs for the United States
Instructional Material Complementing FEMA 451, Design Examples Seismic Hazard Analysis 5a - 78
2000 NEHRP Recommended Provisions Maps
• 5% damped, 2% in 50 years, Site Class B (firm rock)
• 0.2 second and 1.0 second spectral ordinates provided
• On certain faults in California, Alaska, Hawaii, and CUS
Provisions values are deterministic cap times 1.5. Outside
deterministic areas, Provisions maps are the same
as the USGS maps.
• USGS longitude/latitude and zipcode values are
probabilistic MCE. To avoid confusion, ALWAYS
use Provisions (adopted by ASCE and IBC) maps
for design purposes.
14. FEMA 451B Topic 5a Handouts Seismic Hazard Analysis 14
Instructional Material Complementing FEMA 451, Design Examples Seismic Hazard Analysis 5a - 79
Location of Deterministic Areas
Instructional Material Complementing FEMA 451, Design Examples Seismic Hazard Analysis 5a - 80
Deterministic Cap
Applies only where probabilistic values exceed
highest design values from old (Algermissen and Perkins)
maps.
The deterministic procedure for mapping applies:
• For known “active” faults
• Uses characteristic largest earthquake on fault
• Uses 150% of value from median attenuation
Use deterministic value if lower than 2% in 50 year value
Instructional Material Complementing FEMA 451, Design Examples Seismic Hazard Analysis 5a - 81
NEHRP Provisions Maps
0.2 Second Spectral Response (SS)
Instructional Material Complementing FEMA 451, Design Examples Seismic Hazard Analysis 5a - 82
NEHRP Provisions Maps
1.0 Second Spectral Response (S1)
Instructional Material Complementing FEMA 451, Design Examples Seismic Hazard Analysis 5a - 83
0.00
0.20
0.40
0.60
0.80
1.00
0 1 2 3 4 5
Period, sec.
SpectralAcceleration,g.
2% in 50 Year 5% Damped MCE Elastic Spectra
Site Class B (Firm Rock)
S1 = 0.30g
Ss = 0.75g
Curve is S1/T
PGA
Not mapped
Constant
displacement
region beyond
transition
period TL
Instructional Material Complementing FEMA 451, Design Examples Seismic Hazard Analysis 5a - 84
A
B
A
B
Time
Acceleration
Rock
Shale
Sand
Site Amplification Effects
15. FEMA 451B Topic 5a Handouts Seismic Hazard Analysis 15
Instructional Material Complementing FEMA 451, Design Examples Seismic Hazard Analysis 5a - 85
Site Amplification Effects
• Amplification of ground motion
• Longer duration of motion
• Change in frequency content of motion
• Not the same as soil-structure interaction
Instructional Material Complementing FEMA 451, Design Examples Seismic Hazard Analysis 5a - 86
Site Amplification (Seed et al.)
Instructional Material Complementing FEMA 451, Design Examples Seismic Hazard Analysis 5a - 87
Site Amplification: Loma Prieta Earthquake
Soft
Rock
Instructional Material Complementing FEMA 451, Design Examples Seismic Hazard Analysis 5a - 88
Site Amplification: Loma Prieta
and Mexico City Earthquakes
Instructional Material Complementing FEMA 451, Design Examples Seismic Hazard Analysis 5a - 89
A Hard rock vs > 5000 ft/sec
B Rock: 2500 < vs < 5000 ft/sec
C Very dense soil or soft rock: 1200 < vs < 2500 ft/sec
D Stiff soil : 600 < vs < 1200 ft/sec
E Vs < 600 ft/sec
F Site-specific requirements
NEHRP Provisions Site Classes
Instructional Material Complementing FEMA 451, Design Examples Seismic Hazard Analysis 5a - 90
NEHRP Site Amplification
for Site Classes A through E
0.00
0.50
1.00
1.50
2.00
2.50
3.00
0.00 0.25 0.50 0.75 1.00 1.25 1.50
Short Period Ss (sec)
AmplificationFa
A
B
C
D
E
Site Class
0.00
0.50
1.00
1.50
2.00
2.50
3.00
3.50
4.00
0.00 0.25 0.50 0.75 1.00 1.25 1.50
Long Period S1 (sec)
AmplificationFv
A
B
C
D
E
Site Class
16. FEMA 451B Topic 5a Handouts Seismic Hazard Analysis 16
Instructional Material Complementing FEMA 451, Design Examples Seismic Hazard Analysis 5a - 91
0.00
0.21
0.42
0.63
0.84
1.05
0 1 2 3 4 5
Period, sec.
SpectralAcceleration,g.
SMS = FASS = 1.2(0.75)=0.9g
SM1 = FVS1 = 1.8(0.30) = 0.54g
2% in 50 Year 5% Damped MCE Elastic Spectra
Modified for Site Class D
Basic
Site Amplified
Instructional Material Complementing FEMA 451, Design Examples Seismic Hazard Analysis 5a - 92
Buildings designed according to current procedures
assumed to have margin of collapse of 1.5
Judgment of “lower bound” margin of
collapse given by current design procedures
Design with current maps (2% in 50 year) but
scale motions by 2/3
Results in 2/3 x 1.5 = 1.0 deterministic earthquake
(where applicable)
Scaling of NEHRP Provisions Spectra
by 2/3 for “Margin of Performance”
Instructional Material Complementing FEMA 451, Design Examples Seismic Hazard Analysis 5a - 93
0.00
0.20
0.40
0.60
0.80
1.00
0 1 2 3 4 5
Period, sec.
SpectralAceleration,g.
2% in 50 Year 5% Damped Elastic
Design Spectra (Scaled by 2/3)
SDS = (2/3)(0.90) = 0.60g
SD1 = (2/3)(0.54) = 0.36g
Basic
Site Amplified
Scaled
Instructional Material Complementing FEMA 451, Design Examples Seismic Hazard Analysis 5a - 94
0.0
0.5
1.0
1.5
2.0
2.5
0 0.5 1 1.5 2 2.5
Period (sec)
SpectralResponseAcceleration(g)
2% in 50 years 10% in 50 years 2/3 of 2% in 50 years
Effect of Scaling in Western United States
Instructional Material Complementing FEMA 451, Design Examples Seismic Hazard Analysis 5a - 95
0.0
0.5
1.0
1.5
2.0
2.5
0 0.5 1 1.5 2 2.5
Period (sec)
SpectralResponseAcceleration(g)
2% in 50 years 10% in 50 years 2/3 of 2% in 50 years
Effect of Scaling in Eastern United States
Instructional Material Complementing FEMA 451, Design Examples Seismic Hazard Analysis 5a - 96
0.00
0.20
0.40
0.60
0.80
1.00
0 1 2 3 4 5
Period, sec.
SpectralAcceleration,g.
2% in 50 Year 5% Damped
Inelastic Design Spectra (R=6, I=1)
Site Class D
CS = SD1/R = 0.90/6 = 0.15g
CS = SDS/R = 0.36/6 = 0.06g
Basic
Site Amplified
Scaled
Inelastic
17. FEMA 451B Topic 5a Handouts Seismic Hazard Analysis 17
Instructional Material Complementing FEMA 451, Design Examples Seismic Hazard Analysis 5a - 97
Basis for Reduction of
Elastic Spectra by R
Inelastic behavior of structures
Methods for obtaining acceptable
inelastic response are presented
in later topics
Instructional Material Complementing FEMA 451, Design Examples Seismic Hazard Analysis 5a - 98
Directionality and “Killer Pulse” Earthquakes
For sites relatively close to the fault, the
direction of fault rupture can have an amplifying
effect on ground motion amplitude.
Instructional Material Complementing FEMA 451, Design Examples Seismic Hazard Analysis 5a - 99
Towards
Away
Effect of Directionality on Response Spectra
Instructional Material Complementing FEMA 451, Design Examples Seismic Hazard Analysis 5a - 100
Effect of Directionality on Ground Motion