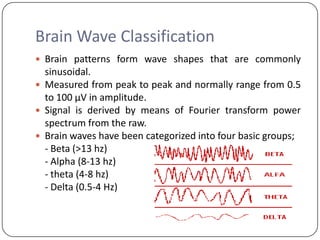
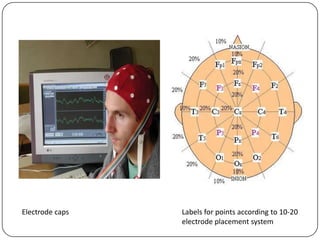
ELECTROENCEPHALOGRAPHY
          (EEG)
Introduction
 A medical imaging technique
 A measurement of the electrical activity of the brain.
 The recording of the brain's spontaneous electrical activity
  over a short period of time, usually 20–40 minutes, as
  recorded from multiple electrodes placed on the scalp.


 An early EEG recording, obtained by Hans Berger in 1924. The upper tracing is
 EEG, and the lower is a 10 Hz timing signal.
Principle
 The brain's electrical charge is maintained by billions of neurons.
 Neurons pass signals via action potential created by exchange
  between sodium and potassium ions in and out of the cell -
  Volume conduction.
 When the wave of ions reaches the electrodes on the scalp, they
  can push or pull electrons on the metal on the electrodes, the
  difference in push, or voltage, between any two electrodes can
  be measured by a voltmeter. Recording these voltages over time
  gives us the EEG.
 Scalp EEG activity shows oscillations at a variety of frequencies.
  Several of these oscillations have characteristic frequency
  ranges, spatial distributions and are associated with different
  states of brain functioning.
Brain Wave Classification
 Brain patterns form wave shapes that are commonly
  sinusoidal.
 Measured from peak to peak and normally range from 0.5
  to 100 μV in amplitude.
 Signal is derived by means of Fourier transform power
  spectrum from the raw.
 Brain waves have been categorized into four basic groups;
  - Beta (>13 hz)
  - Alpha (8-13 hz)
  - theta (4-8 hz)
  - Delta (0.5-4 Hz)
Type    Frequency (Hz)   Location                         Normally                           Pathologically
Delta   Upto 4           frontally in adults,             adults slow wave sleep,            subcortical lesions,
                         posteriorly in children; high    in babies,                         diffuse lesions,
                         amplitude waves                  Has been found during              metabolic encephalopathy
                                                          some continuous attention          hydrocephalus,
                                                          tasks                              deep midline lesions
Theta   4-8              Found in locations not           young children,                    focal subcortical lesions,
                         related to task at hand          drowsiness or arousal in           metabolic encephalopathy,
                                                          older children and adults,         deep midline disorders,
                                                          idling,                            some instances of
                                                          Associated with inhibition of      hydrocephalus
                                                          elicited responses
Alpha   8-13             posterior regions of head,       relaxed/reflecting,                coma
                         both sides, higher in            closing the eyes,
                         amplitude on dominant            Also associated with
                                                          inhibition control, seemingly
                         side. Central sites (c3-c4) at
                                                          with the purpose of timing
                         rest
                                                          inhibitory activity in different
                                                          locations across the brain
Beta    13-30            both sides, symmetrical          alert/working,                     benzodiazepines
                         distribution, most evident       active, busy or anxious,
                         frontally; low amplitude         thinking, active
                                                          concentration
                         waves
Gamma   30-100+          Somatosensory cortex             Displays during cross-modal        A decrease in gamma band
                                                          sensory processing,                activity may be associated
                                                          Also is shown during short         with cognitive decline,
                                                          term memory matching of            especially when related the
                                                          recognized objects, sounds,        theta band; however, this
                                                          or tactile sensations              has not been proven for use
                                                                                             as a clinical diagnostic
Mu      8-13             Sensorimotor cortex              Shows rest state motor             Mu suppression could be
                                                          neurons                            indicative for motor mirror
                                                                                             neurons working, and
                                                                                             deficits in Mu suppression,
                                                                                             and thus in mirror neurons,
                                                                                             might play a role in autism
Applications
 Monitor alertness, coma and brain death
 Locate areas of damage following head injury, stroke,
    tumour, etc.
   Test afferent pathways (by evoked potentials)
   Monitor cognitive engagement (alpha rhythm)
   Produce biofeedback situations, alpha, etc.
   Control anaesthesia depth
   Investigate epilepsy and locate seizure origin
   Test epilepsy drug effects
   Assist in experimental cortical excision of epileptic focus
   Monitor human and animal brain development
   Test drugs for convulsive effects
   Investigate sleep disorder and physiology
Methodology
 Non-invasive and painless
 To study the brain organization of cognitive processes such as
     perception, memory, attention, language and emotion in normal
     adults and children.
    Major components;
1.   Electrodes with conductive media
2.   Amplifiers with filters
3.   A/D converter
4.   Recording device
    Electrodes read the signal from the head surface, amplifiers
     bring the microvolt signals into the range where they can be
     digitalized accurately, converter changes signals from analog to
     digital form and personal computer stores and displays obtained
     data.
Recording electrodes
• Types of electrodes:
1. Disposable (gel-less, and pre-gelled types)
2. Reusable disc electrodes (gold, silver, s.s. or tin)
3. Headbands and electrode caps
4. Saline-based electrodes
5. Needle electrodes

• Electrode caps are preferred, with certain number of electrodes
  installed on its surface.
• Commonly used scalp electrodes consist of Ag-AgCl disks, 1 to 3
  mm in diameter, with long flexible leads that can be plugged
  into an amplifier.
• Needle electrodes are used for long recordings and are
  invasively inserted under the scalp.
 Electrode    locations and names are specified by
  the International 10–20 system for most clinical and
  research applications
 Label 10-20 designates proportional distance in percents
  between ears and nose where points for electrodes are
  chosen.
 Electrode placements are labeled according adjacent brain
  areas: F (frontal), C (central), T (temporal), P (posterior),
  and O (occipital).
 The letters are accompanied by odd numbers at the left
  side of the head and with even numbers on the right side.
Electrode caps   Labels for points according to 10-20
                 electrode placement system
 Display of the EEG may be set up in one of several ways.
   The representation of the EEG channels is referred to as
   a montage.
1. Bipolar montage Each channel (i.e., waveform) represents
   the difference between two adjacent electrodes. The
   entire montage consists of a series of these channels.
2. Referential montage Each channel represents the
   difference between a certain electrode and a designated
   reference electrode.
3. Average reference montage The outputs of all of the
   amplifiers are summed and averaged, and this averaged
   signal is used as the common reference for each channel.
4. Laplacian montage Each channel represents the difference
   between an electrode and a weighted average of the
   surrounding electrodes.
Amplifiers and filters
 The input signal to the amplifier consists of five components:
1.Desired biopotential
2.Undesired biopotential
3.A power line interference signal of 50/60 Hz and its harmonics
4.Interference signals generated by the tissue/electrode interface
5.Noise
 The A/D converter is interfaced to a computer system so that
  channels of analog signal are converted into a digital
  representation.
 Analog low-pass filters prevent distortion of the signal by
  interference effects with sampling rate, called aliasing, which
  would occur if frequencies greater than one half of the sampling
  rate survive.
Artefacts
 Among basic evaluation of the EEG traces belongs scanning
  for signal distortions called Artefacts.
 The Artefact in the recorded EEG may be either patient-
  related or technical.
 Patient related:             Technical:
 - Any minor body movements   - 50/60 hz
 - EMG                        - Impedance fluctuation
 - ECG (pulse, pace-maker)    - Cable movements
 - Eye movements              - Broken wire contacts
 - Sweating                   - Too much electrode paste/jelly
                              - Low battery
Alternative Neuroimaging Techniques
 Positron emission technique (PET)
  - Picture image of brain giving information about glucose and
  oxygen structures in the brain, blood flow, and blood volume in
  the brain
  - Advantage: compare cross-sections of brain regions
  simultaneously
  - Disadvantage: findings may be caused by inhibitory neurons

 Functional magnetic resonance imaging (ғmri)
  - Picture image of anatomical structures, derived from magnetic
  imaging
  - Allows for measurement of blood oxygen concentration, blood
  flow, and blood volume
  - Advantage: see ongoing changes as well as strong spatial
  resolution, and quick/effective data collection
 Biomagnetism
  - Measures magnetic activity given off by the brain
  - Super conductive quantum interfering device (SQUID)
  - Disadvantage: very difficult to pick up these small magnetic
  measures due to environmental magnetic forces

 Magnetoencephalogram (MEG)
  - Similar to EEG in that it combines the activities of millions of
  neurons
  - Advantages: no reference electrode, some currents can only be
  found magnetically, scans field patterns of brain allowing for
  simultaneous area activity
  - Disadvantage: data not as clear and device is very susceptible
  to noise
Limitations
 Poor spatial resolution
 Most sensitive to a particular set of post-synaptic
  potentials, those generated in superficial layers of the
  cortex, on the crests of gyri, in dendrites and deep
  structures or producing currents that are tangential to the
  skull.
 It is mathematically impossible to reconstruct a unique
  intracranial current source for a given eeg signal, as some
  currents produce potentials that cancel each other out.
  This is referred to as the inverse problem.

Electroencephalography

  • 1.
  • 2.
    Introduction  A medicalimaging technique  A measurement of the electrical activity of the brain.  The recording of the brain's spontaneous electrical activity over a short period of time, usually 20–40 minutes, as recorded from multiple electrodes placed on the scalp. An early EEG recording, obtained by Hans Berger in 1924. The upper tracing is EEG, and the lower is a 10 Hz timing signal.
  • 3.
    Principle  The brain'selectrical charge is maintained by billions of neurons.  Neurons pass signals via action potential created by exchange between sodium and potassium ions in and out of the cell - Volume conduction.  When the wave of ions reaches the electrodes on the scalp, they can push or pull electrons on the metal on the electrodes, the difference in push, or voltage, between any two electrodes can be measured by a voltmeter. Recording these voltages over time gives us the EEG.  Scalp EEG activity shows oscillations at a variety of frequencies. Several of these oscillations have characteristic frequency ranges, spatial distributions and are associated with different states of brain functioning.
  • 4.
    Brain Wave Classification Brain patterns form wave shapes that are commonly sinusoidal.  Measured from peak to peak and normally range from 0.5 to 100 μV in amplitude.  Signal is derived by means of Fourier transform power spectrum from the raw.  Brain waves have been categorized into four basic groups; - Beta (>13 hz) - Alpha (8-13 hz) - theta (4-8 hz) - Delta (0.5-4 Hz)
  • 5.
    Type Frequency (Hz) Location Normally Pathologically Delta Upto 4 frontally in adults, adults slow wave sleep, subcortical lesions, posteriorly in children; high in babies, diffuse lesions, amplitude waves Has been found during metabolic encephalopathy some continuous attention hydrocephalus, tasks deep midline lesions Theta 4-8 Found in locations not young children, focal subcortical lesions, related to task at hand drowsiness or arousal in metabolic encephalopathy, older children and adults, deep midline disorders, idling, some instances of Associated with inhibition of hydrocephalus elicited responses Alpha 8-13 posterior regions of head, relaxed/reflecting, coma both sides, higher in closing the eyes, amplitude on dominant Also associated with inhibition control, seemingly side. Central sites (c3-c4) at with the purpose of timing rest inhibitory activity in different locations across the brain Beta 13-30 both sides, symmetrical alert/working, benzodiazepines distribution, most evident active, busy or anxious, frontally; low amplitude thinking, active concentration waves Gamma 30-100+ Somatosensory cortex Displays during cross-modal A decrease in gamma band sensory processing, activity may be associated Also is shown during short with cognitive decline, term memory matching of especially when related the recognized objects, sounds, theta band; however, this or tactile sensations has not been proven for use as a clinical diagnostic Mu 8-13 Sensorimotor cortex Shows rest state motor Mu suppression could be neurons indicative for motor mirror neurons working, and deficits in Mu suppression, and thus in mirror neurons, might play a role in autism
  • 6.
    Applications  Monitor alertness,coma and brain death  Locate areas of damage following head injury, stroke, tumour, etc.  Test afferent pathways (by evoked potentials)  Monitor cognitive engagement (alpha rhythm)  Produce biofeedback situations, alpha, etc.  Control anaesthesia depth  Investigate epilepsy and locate seizure origin  Test epilepsy drug effects  Assist in experimental cortical excision of epileptic focus  Monitor human and animal brain development  Test drugs for convulsive effects  Investigate sleep disorder and physiology
  • 7.
    Methodology  Non-invasive andpainless  To study the brain organization of cognitive processes such as perception, memory, attention, language and emotion in normal adults and children.  Major components; 1. Electrodes with conductive media 2. Amplifiers with filters 3. A/D converter 4. Recording device  Electrodes read the signal from the head surface, amplifiers bring the microvolt signals into the range where they can be digitalized accurately, converter changes signals from analog to digital form and personal computer stores and displays obtained data.
  • 8.
    Recording electrodes • Typesof electrodes: 1. Disposable (gel-less, and pre-gelled types) 2. Reusable disc electrodes (gold, silver, s.s. or tin) 3. Headbands and electrode caps 4. Saline-based electrodes 5. Needle electrodes • Electrode caps are preferred, with certain number of electrodes installed on its surface. • Commonly used scalp electrodes consist of Ag-AgCl disks, 1 to 3 mm in diameter, with long flexible leads that can be plugged into an amplifier. • Needle electrodes are used for long recordings and are invasively inserted under the scalp.
  • 9.
     Electrode locations and names are specified by the International 10–20 system for most clinical and research applications  Label 10-20 designates proportional distance in percents between ears and nose where points for electrodes are chosen.  Electrode placements are labeled according adjacent brain areas: F (frontal), C (central), T (temporal), P (posterior), and O (occipital).  The letters are accompanied by odd numbers at the left side of the head and with even numbers on the right side.
  • 10.
    Electrode caps Labels for points according to 10-20 electrode placement system
  • 11.
     Display ofthe EEG may be set up in one of several ways. The representation of the EEG channels is referred to as a montage. 1. Bipolar montage Each channel (i.e., waveform) represents the difference between two adjacent electrodes. The entire montage consists of a series of these channels. 2. Referential montage Each channel represents the difference between a certain electrode and a designated reference electrode. 3. Average reference montage The outputs of all of the amplifiers are summed and averaged, and this averaged signal is used as the common reference for each channel. 4. Laplacian montage Each channel represents the difference between an electrode and a weighted average of the surrounding electrodes.
  • 12.
    Amplifiers and filters The input signal to the amplifier consists of five components: 1.Desired biopotential 2.Undesired biopotential 3.A power line interference signal of 50/60 Hz and its harmonics 4.Interference signals generated by the tissue/electrode interface 5.Noise  The A/D converter is interfaced to a computer system so that channels of analog signal are converted into a digital representation.  Analog low-pass filters prevent distortion of the signal by interference effects with sampling rate, called aliasing, which would occur if frequencies greater than one half of the sampling rate survive.
  • 14.
    Artefacts  Among basicevaluation of the EEG traces belongs scanning for signal distortions called Artefacts.  The Artefact in the recorded EEG may be either patient- related or technical. Patient related: Technical: - Any minor body movements - 50/60 hz - EMG - Impedance fluctuation - ECG (pulse, pace-maker) - Cable movements - Eye movements - Broken wire contacts - Sweating - Too much electrode paste/jelly - Low battery
  • 15.
    Alternative Neuroimaging Techniques Positron emission technique (PET) - Picture image of brain giving information about glucose and oxygen structures in the brain, blood flow, and blood volume in the brain - Advantage: compare cross-sections of brain regions simultaneously - Disadvantage: findings may be caused by inhibitory neurons  Functional magnetic resonance imaging (ғmri) - Picture image of anatomical structures, derived from magnetic imaging - Allows for measurement of blood oxygen concentration, blood flow, and blood volume - Advantage: see ongoing changes as well as strong spatial resolution, and quick/effective data collection
  • 16.
     Biomagnetism - Measures magnetic activity given off by the brain - Super conductive quantum interfering device (SQUID) - Disadvantage: very difficult to pick up these small magnetic measures due to environmental magnetic forces  Magnetoencephalogram (MEG) - Similar to EEG in that it combines the activities of millions of neurons - Advantages: no reference electrode, some currents can only be found magnetically, scans field patterns of brain allowing for simultaneous area activity - Disadvantage: data not as clear and device is very susceptible to noise
  • 17.
    Limitations  Poor spatialresolution  Most sensitive to a particular set of post-synaptic potentials, those generated in superficial layers of the cortex, on the crests of gyri, in dendrites and deep structures or producing currents that are tangential to the skull.  It is mathematically impossible to reconstruct a unique intracranial current source for a given eeg signal, as some currents produce potentials that cancel each other out. This is referred to as the inverse problem.