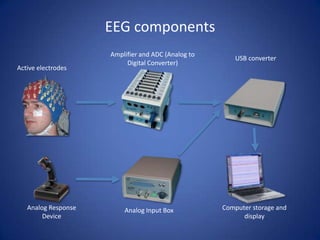
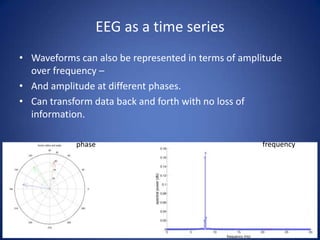
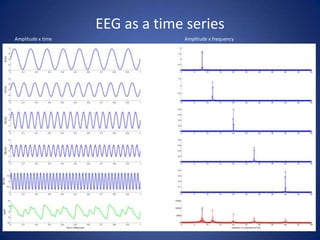
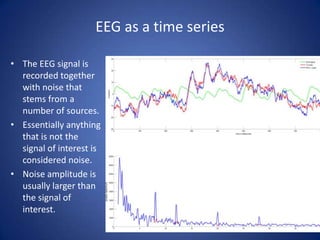
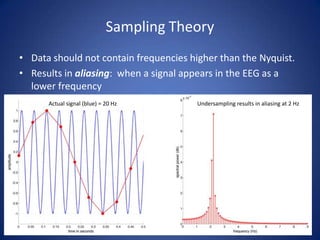
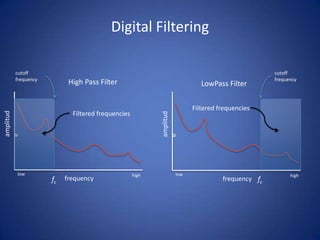
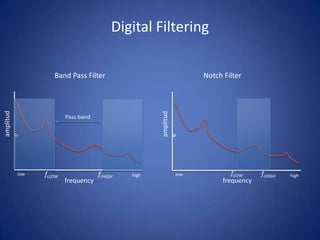
EEG equipment and signal acquisition
       Human Cognition and Neural Dynamics Lab
           Western Washington University
EEG components
                     Amplifier and ADC (Analog to
                                                        USB converter
                          Digital Converter)
Active electrodes


   Analog Response       Analog Input Box           Computer storage and
        Device                                            display
Basic Acquisition
• Signals on scalp are very small - microvolt range
  (1/1,000,000 volts).
• Presents some challenges for acquisition
• Acquisition involves
   –   Amplification
   –   Filtering
   –   Digitizing (sampling)
   –   Storage
• Results in one time series per channel (64 in our lab).
Basic Acquisition
• EEG signals are a measure the potential difference
  between two electrodes.
• Just like the voltage at a battery is the difference
  between positive and negative poles.
• Thus you always need at least 2 recording electrodes
  to get a signal.
• In practice we use many electrodes but each EEG
  signal is always the difference between the signal
  from 2 or more electrodes.
Electrode placement
• Typically adopt an accepted placement scheme for applying electrodes to
  the scalp.
• The International 1020 placement system is the most widely adopted.
• It uses a set of measurements relative to landmarks on the head.
• Name reflects the fact that electrodes are placed at intervals that are 10%
  or 20% of the distance between landmarks.
Electrode placement
• Requires distance from front
  to back of head and distance
  from left to right.

• Front to back defined as
  distance from nasion to inion.

• Nasion - intersection of the
  frontal bone and two nasal
  bones

• Inion - the most prominent
  projection of the occipital
  bone at the posterioinferior
  (lower rear) part of the skull
Electrode placement
• Requires distance from
  front to back of head and
  distance from left to
  right.

• Left right defined as
  distance between pre-
  auricular points.

• Pre-auricular point- root
  of the zygomatic arch
  anterior to the tragus
Electrode placement
•   Electrode placement begins at 10% from these landmarks.
•   Electrodes are placed at 20% intervals.
•   Allows for 19 recording electrodes
•   Electrode names reflect location.
     – Even number right/ odd left; z = midline
     – C = central; F = frontal; P = parietal; T = temporal; O = occipital
     – Larger numbers are farther from the midline


                                                                             The 10-20
                                                                             placement
                                                                             system.
Electrode Placement

• Extensions of this placement
  system include greater
  numbers of electrodes.

• 10/10 electrode placement
  places electrodes at 10%
  intervals.

• 10/5 electrode placement
  put electrodes at 5%
  intervals.

• Most labs are using some
  variant of this system and use
  the associated electrode
  names.
                                   The 10-10 placement system
EEG as a time series
• EEG can be considered as a signal that changes over
  time.
• A simple example is a sine wave that oscillates at a
  single rate.
• Below are 3 sine waves oscillating at 8 times / sec
  (Hz).
EEG as a time series
• Waveforms can also be represented in terms of amplitude
  over frequency –
• And amplitude at different phases.
• Can transform data back and forth with no loss of
  information.

            phase                                   frequency
EEG as a time series

• EEG is a more complex signal than a simple
  sine wave
• In theory, any time series – no matter how
  complex - can be decomposed into individual
  sine waves of specific frequency and
  amplitude.
• EEG can be treated in the same way
EEG as a time series
Amplitude x time                Amplitude x frequency
EEG as a time series

• The EEG signal is
  recorded together
  with noise that
  stems from a
  number of sources.
• Essentially anything
  that is not the
  signal of interest is
  considered noise.
• Noise amplitude is
  usually larger than
  the signal of
  interest.
Sampling theory
• Digital recording of EEG requires sampling brain signals at
  discrete time points.
• The sample interval (T) is the time between samples
  expressed in seconds.
• The sample frequency or rate (fs) is the number of samples
  collected each second expressed in hertz (Hz.)
• fs = 1/T; T = 1/fs
• fs(500 Hz) = T(.002 s)
Sampling Theory
• The sampling theory must be adequate for
  representing the signal of interest.
• Too low results in aliasing
• Too high results in redundancy and unnecessarily
  large data files.
• If you have to err – always choose to oversample
  rather than undersample.
• You can always downsample later (lower the
  sample rate of the digital signal) but you cannot
  increase the sample rate of a digital signal.
Sampling Theory
8 Hz sine wave sampled at different rates
Sampling Theory

• Nyquist–Shannon sampling theorem:
  – A signal with maximum frequency f can be
    reconstructed using a minimum sampling rate of
    1/(2f).
  – Given a sampling rate fs, the highest frequency (f)
    that can be represented is f = fs/2 also known as
    the Nyquist frequency.
  – In practice the sample rate is usually at least 4
    times the highest frequency of interest.
Sampling Theory
• Data should not contain frequencies higher than the Nyquist.
• Results in aliasing: when a signal appears in the EEG as a
  lower frequency
      Actual signal (blue) = 20 Hz       Undersampling results in aliasing at 2 Hz
Sampling Theory

• Filters must be set to reduce contribution of
  signal above the Nyquist frequency.
    – Sample Rate = 250 Hz
    – Nyquist frequency = 125 Hz
    – Must low pass filter at 125 Hz.
•   High pass filter – allows high frequencies to pass
•   Low pass filter – allows low frequencies to pass
•   Notch filter – filters specific range of frequencies
•   Band Pass – filters all but a range of frequencies
Digital Filtering

     cutoff                                                                                 cutoff
     frequency                                                                              frequency
                       High Pass Filter                               LowPass Filter


                                                                   Filtered frequencies
                        Filtered frequencies
amplitud


                                                      amplitud
e


      low                                      high   e      low                                  high
                 fc   frequency                                              frequency fc
Digital Filtering

               Band Pass Filter                              Notch Filter
amplitud


                                                amplitud
                    Pass band
e


      low   fcLOW               fcHIGH   high   e      low           fcLOW     fcHIGH   high
                    frequency                                      frequency
Sources of Noise In EEG
• Capacitive coupling
   – the electrodes and cables are coupled to signals such as lights,
     computers, cell phones, etc. can induce voltage in the leads.
   – Theoretically this is the same for all leads so should be removed by
     common mode rejection.
   – In practice, however, this is not always the case so it is best to keep
     distance between leads and electrical sources.
• Induction
   – Loop created between body and equipment allows for the formation
     of a magnetic field that can induce current flow in wires.
   – The best solution is to wrap the cables around each other so that
     opposing magnetic fields will cancel each other.
Reducing Noise with Biosemi
• Driven Right Left Circuit
   – Biosemi uses a driven right leg circuit to reduce common mode
     signals.
   – Uses two electrodes (CMS & DRL) in a feedback loop to drive the
     voltage of the patient to be the same as the common mode voltage -
     thereby reducing the effect of external noise.
   – CMS used to detect to common mode signal or background noise
   – DRL used as part of feedback circuit to eliminate difference between
     participant and common mode.
   – Other systems have only a single ground electrode that grounds the
     participant for safety reasons.
Reducing Noise with Biosemi
• Active Electrodes
   – Each electrode has an amplifier attached.
   – Amplify recorded signals at the electrode where transduction is
     occurring.
   – Increases size of signal traveling down leads
   – Reduces susceptibility to noise in the environment.

Introduction to EEG: Instrument and Acquisition

  • 1.
    EEG equipment andsignal acquisition Human Cognition and Neural Dynamics Lab Western Washington University
  • 2.
    EEG components Amplifier and ADC (Analog to USB converter Digital Converter) Active electrodes Analog Response Analog Input Box Computer storage and Device display
  • 3.
    Basic Acquisition • Signalson scalp are very small - microvolt range (1/1,000,000 volts). • Presents some challenges for acquisition • Acquisition involves – Amplification – Filtering – Digitizing (sampling) – Storage • Results in one time series per channel (64 in our lab).
  • 4.
    Basic Acquisition • EEGsignals are a measure the potential difference between two electrodes. • Just like the voltage at a battery is the difference between positive and negative poles. • Thus you always need at least 2 recording electrodes to get a signal. • In practice we use many electrodes but each EEG signal is always the difference between the signal from 2 or more electrodes.
  • 5.
    Electrode placement • Typicallyadopt an accepted placement scheme for applying electrodes to the scalp. • The International 1020 placement system is the most widely adopted. • It uses a set of measurements relative to landmarks on the head. • Name reflects the fact that electrodes are placed at intervals that are 10% or 20% of the distance between landmarks.
  • 6.
    Electrode placement • Requiresdistance from front to back of head and distance from left to right. • Front to back defined as distance from nasion to inion. • Nasion - intersection of the frontal bone and two nasal bones • Inion - the most prominent projection of the occipital bone at the posterioinferior (lower rear) part of the skull
  • 7.
    Electrode placement • Requiresdistance from front to back of head and distance from left to right. • Left right defined as distance between pre- auricular points. • Pre-auricular point- root of the zygomatic arch anterior to the tragus
  • 8.
    Electrode placement • Electrode placement begins at 10% from these landmarks. • Electrodes are placed at 20% intervals. • Allows for 19 recording electrodes • Electrode names reflect location. – Even number right/ odd left; z = midline – C = central; F = frontal; P = parietal; T = temporal; O = occipital – Larger numbers are farther from the midline The 10-20 placement system.
  • 9.
    Electrode Placement • Extensionsof this placement system include greater numbers of electrodes. • 10/10 electrode placement places electrodes at 10% intervals. • 10/5 electrode placement put electrodes at 5% intervals. • Most labs are using some variant of this system and use the associated electrode names. The 10-10 placement system
  • 10.
    EEG as atime series • EEG can be considered as a signal that changes over time. • A simple example is a sine wave that oscillates at a single rate. • Below are 3 sine waves oscillating at 8 times / sec (Hz).
  • 11.
    EEG as atime series • Waveforms can also be represented in terms of amplitude over frequency – • And amplitude at different phases. • Can transform data back and forth with no loss of information. phase frequency
  • 12.
    EEG as atime series • EEG is a more complex signal than a simple sine wave • In theory, any time series – no matter how complex - can be decomposed into individual sine waves of specific frequency and amplitude. • EEG can be treated in the same way
  • 13.
    EEG as atime series Amplitude x time Amplitude x frequency
  • 14.
    EEG as atime series • The EEG signal is recorded together with noise that stems from a number of sources. • Essentially anything that is not the signal of interest is considered noise. • Noise amplitude is usually larger than the signal of interest.
  • 15.
    Sampling theory • Digitalrecording of EEG requires sampling brain signals at discrete time points. • The sample interval (T) is the time between samples expressed in seconds. • The sample frequency or rate (fs) is the number of samples collected each second expressed in hertz (Hz.) • fs = 1/T; T = 1/fs • fs(500 Hz) = T(.002 s)
  • 16.
    Sampling Theory • Thesampling theory must be adequate for representing the signal of interest. • Too low results in aliasing • Too high results in redundancy and unnecessarily large data files. • If you have to err – always choose to oversample rather than undersample. • You can always downsample later (lower the sample rate of the digital signal) but you cannot increase the sample rate of a digital signal.
  • 17.
    Sampling Theory 8 Hzsine wave sampled at different rates
  • 18.
    Sampling Theory • Nyquist–Shannonsampling theorem: – A signal with maximum frequency f can be reconstructed using a minimum sampling rate of 1/(2f). – Given a sampling rate fs, the highest frequency (f) that can be represented is f = fs/2 also known as the Nyquist frequency. – In practice the sample rate is usually at least 4 times the highest frequency of interest.
  • 19.
    Sampling Theory • Datashould not contain frequencies higher than the Nyquist. • Results in aliasing: when a signal appears in the EEG as a lower frequency Actual signal (blue) = 20 Hz Undersampling results in aliasing at 2 Hz
  • 20.
    Sampling Theory • Filtersmust be set to reduce contribution of signal above the Nyquist frequency. – Sample Rate = 250 Hz – Nyquist frequency = 125 Hz – Must low pass filter at 125 Hz. • High pass filter – allows high frequencies to pass • Low pass filter – allows low frequencies to pass • Notch filter – filters specific range of frequencies • Band Pass – filters all but a range of frequencies
  • 21.
    Digital Filtering cutoff cutoff frequency frequency High Pass Filter LowPass Filter Filtered frequencies Filtered frequencies amplitud amplitud e low high e low high fc frequency frequency fc
  • 22.
    Digital Filtering Band Pass Filter Notch Filter amplitud amplitud Pass band e low fcLOW fcHIGH high e low fcLOW fcHIGH high frequency frequency
  • 23.
    Sources of NoiseIn EEG • Capacitive coupling – the electrodes and cables are coupled to signals such as lights, computers, cell phones, etc. can induce voltage in the leads. – Theoretically this is the same for all leads so should be removed by common mode rejection. – In practice, however, this is not always the case so it is best to keep distance between leads and electrical sources. • Induction – Loop created between body and equipment allows for the formation of a magnetic field that can induce current flow in wires. – The best solution is to wrap the cables around each other so that opposing magnetic fields will cancel each other.
  • 24.
    Reducing Noise withBiosemi • Driven Right Left Circuit – Biosemi uses a driven right leg circuit to reduce common mode signals. – Uses two electrodes (CMS & DRL) in a feedback loop to drive the voltage of the patient to be the same as the common mode voltage - thereby reducing the effect of external noise. – CMS used to detect to common mode signal or background noise – DRL used as part of feedback circuit to eliminate difference between participant and common mode. – Other systems have only a single ground electrode that grounds the participant for safety reasons.
  • 25.
    Reducing Noise withBiosemi • Active Electrodes – Each electrode has an amplifier attached. – Amplify recorded signals at the electrode where transduction is occurring. – Increases size of signal traveling down leads – Reduces susceptibility to noise in the environment.