The document discusses electroencephalography (EEG) and summarizes an experiment on EEG waveforms. Key points:
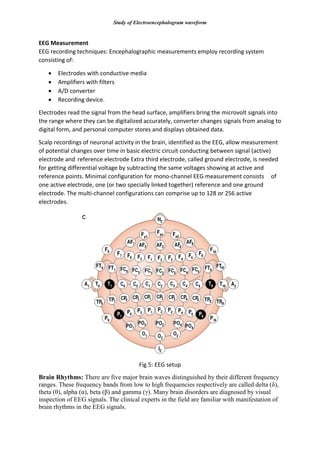
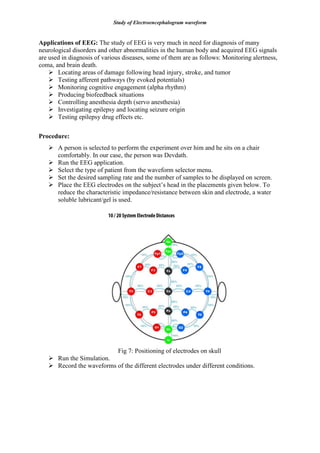
1. An EEG measures electrical activity in the brain using electrodes placed on the scalp. It can detect abnormalities and monitor brain states.
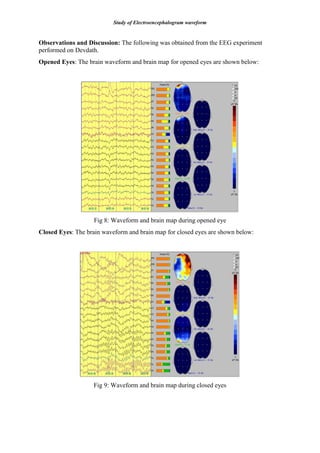
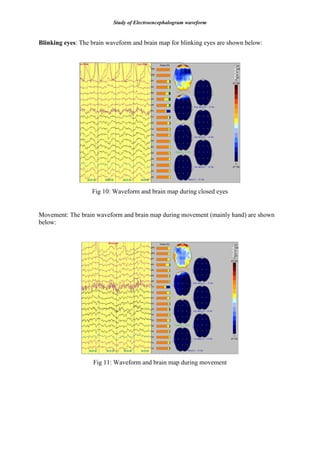
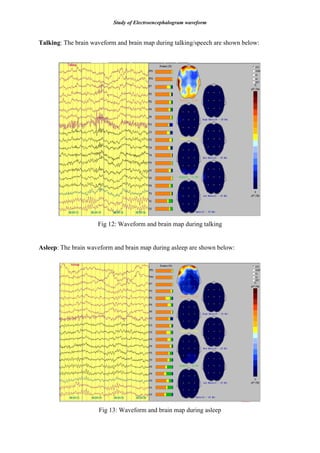
2. The experiment stimulated EEG patterns on a subject under different conditions like eyes open/closed, blinking, movement, talking and sleep.
3. The EEG recordings showed different waveform patterns and brain activations depending on the subject's activity level and state. This demonstrated how EEG can interpret brain activity in real-time.

![Study of Electroencephalogram waveform
Result:
The EEG of deva dath was simulated and recorded. The actions performed by the
patient was also accurately interpreted at real-time using EEG
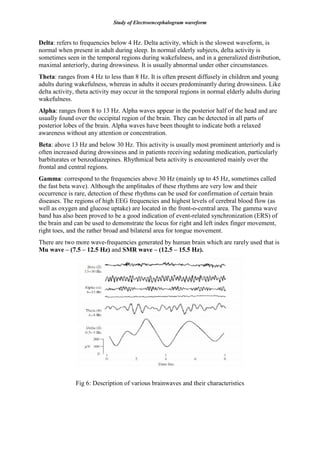
The magnitude and frequency of brainwave depend upon the activity we carry out.
Portable EEG machines are relatively low sensitivity and specificity, which results in
errors.
References:
[1] Lab Manual
[2] https://en.wikipedia.org/wiki/Neural_oscillation
[3] http://www.spectrumhealth.biz/services/brain-mapping-know-more.php
[4] http://www.brainwavecollege.com/what-are-brainwaves.html
[5] www.hopkinsmedicine.org › Health Library
[6] https://www.epilepsysociety.org.uk/eeg-electroencephalogram](https://image.slidesharecdn.com/eeg-160914161848/85/Eeg-11-320.jpg)


