SlideShare a Scribd company logo
1 of 12
Download to read offline
Nonlinear Analysis: Modelling and Control, 2011, Vol. 16, No. 4, 375–386 375
EEG analysis – automatic spike detection
Algimantas Juozapaviˇciusa
, Gytis Baceviˇciusa
, Dmitrijus Bugelskisa
,
R¯uta Samaitien˙eb
a
Faculty of Mathematics and Informatics, Vilnius University
Naugarduko str. 24, LT-03225 Vilnius, Lithuania
algimantas.juozapavicius@mif.vu.lt; gytis.bacevicius@mif.stud.vu.lt
b
Vilnius University Children Hospital, Centre of Pediatrics
Santariškiu˛ str. 7, LT-08406 Vilnius, Lithuania
samaitiene@yahoo.com
Received: 21 January 2011 / Revised: 24 November 2011 / Published online: 7 December 2011
Abstract. In the diagnosis and treatment of epilepsy, an electroencephalography (EEG) is one of
the main tools. However visual inspection of EEG is very time consuming. Automatic extraction of
important EEG features saves not only a lot of time for neurologist, but also enables a whole new
level for EEG analysis, by using data mining methods. In this work we present and analyse methods
to extract some of these features of EEG – drowsiness score and centrotemporal spikes. For spike
detection, a method based on morphological filters is used. Also a database design is proposed
in order to allow easy EEG analysis and provide data accessibility for data mining algorithms
developed in the future.
Keywords: electroencephalogram, rolandic epilepsy, epileptic spikes, morphological filters,
analysis.
1 Introduction
Electroencephalography (EEG) is a widely used medical technique, for monitoring elec-
trical brain’s activity produced by neurons. Technically an EEG consists of multiple
channels that monitor neurons’ activities in a region, each channel represent an electrode
on a patient’s scalp.
Epilepsy is a neurological disorder manifesting in uncontrolled seizures. These sei-
zures lead to a discharge in the brain, generating a disturbance in the EEG. The analysis
of EEG looking for these spikes over background activity is the main method of epilepsy
diagnosis and treatment. A regular EEG can have from up to 20 electrodes and last more
than an hour [1]. Currently visual methods are used for this analysis, qualified doctors
visually inspect the whole EEG. This is a very time consuming task. To improve EEG
analysis automatic tools are required.
The most time consuming task in EEG analysis is spike detection. For this purpose
many algorithms were suggested. The most recent overview of such algorithms is given
c Vilnius University, 2011
376 A. Juozapaviˇcius et al.
in [2], providing numerous list of most essential approaches to spike detection and to anal-
ysis of their performance. However the author concentrates on algorithms performance
measurement and comparison, by using combination of statistical parameters, however
he gives almost no mathematical formulations. According to performance reported in
this article as well as results of review in the article [3], we decided to experiment with
mimetic algorithms, combining with template matching. Therefore an automatic method
based on morphological filter is presented in this work. Main purpose of this investigation
is to develop and evaluate the mathematical/logical architecture of such approach. The
filter developed was used on data provided by Vilnius University Children’s Hospital.
The filter was found to be susceptible to high frequency noise. To solve this problem
a finite response filter was used. Also two filters based on spike definition are introduced
to improve the results: spike rejection based on length as well as on neighbourhood.
The resulting filter detect all known spikes in the provided data, but it turned out to be
susceptible to events of noise such as eye movement.
Epileptic spikes are precipitated by sleep. Therefore an important factor in EEG analy-
sis is a person drowsiness. A method widely used for measuring drowsiness is Karolinska
drowsiness score (KDS) [4]. This score is usually calculated by hand, however can be
easily implemented for computer detection. This method is described in this work. Un-
fortunately KDS is not always accurate.
These and a lot of other EEG feature extraction methods can be combined to provide
additional data in epilepsy diagnosis. Moreover they can be used with data mining al-
gorithms to extract additional information, for example a new more accurate drowsiness
score. For this reason a system to access and store EEG features is required. In this work
we present a document based database design. It provides storage with the possibility to
add additional extracted EEG features as they become available as well as ease of access
to them.
2 Electroencephalography (EEG)
EEG is the recording of electrical activity along the scalp produced by the firing of
neurons within the brain [5].
EEG was discovered by the German psychiatrist, Hans Berger, in 1929. Electrical
activity recorded by electrodes placed on the scalp mostly reflects summation of excita-
tory and inhibitory postsynaptic potentials in apical dendrites of pyramidal neurons in the
more superficial layers of the cortex. Quite large areas of cortex – in the order of a few
square centimeters – have to be activated synchronously to generate enough potential for
changes to be registered at electrodes placed on the scalp [6] EEG plays a central role in
diagnosis and management of patients with seizure disorders.
Routine EEG is used in the following clinical circumstances:
• Epilepsy (to determine epileptic activity, epileptic focus, to diagnose epileptic syn-
drome).
• To distinguish epileptic seizures from other types of spells.
www.mii.lt/NA
EEG analysis – automatic spike detection 377
• To differentiate encephalopathy, neurodegenerative disorders, to evaluate comatose
patients.
• To serve as an adjunct test of brain death.
2.1 Brain rhythms
The frequency of brain waves can differ based on the state of the person being monitored.
These brain waves are categorised into 5 brain rhythms based on their frequency [5]:
• Delta rhythm. 3.5 Hz or lower. Detected during deep sleep.
• Alfa rhythm. 8–12 Hz. Detected during relaxation, especially with eyes closed.
• Beta rhythm. 12–30 Hz. Detected during active thinking or high concentration.
• Teta rhythm. 3–7.5 Hz. Correlates with drowsiness and agitation.
• Gama rhythm. 30 Hz or higher. Rare occurence.
2.2 Electrode location by the international 10–20 system
This system ensures that the naming of electrodes is consistent across EEG laboratories.
In most clinical applications, 19 recording electrodes (plus ground and system reference)
are used. The modified combined nomenclature derived from the 10–20 system should be
used for electrode location [5].
Before recording electrodes are placed on the scalp with a conductive gel or paste,
usually after preparing the scalp area by light abrasion to reduce impedance. A routine
EEG should (at least) include bipolar montages with longitudinal and transverse chains.
These chains should be used with equal electrode distances and side-to-side symmetry to
avoid the artifact of false amplitude asymmetry [7].
3 Epilepsy
Epilepsy is the tendency to experience repeated seizures, which stem from activity orig-
inating in the brain [8]. The seizures happen because of abnormal, excessive or syn-
chronous neuronal activity in the brain. People may have strange sensations and emo-
tions or behave strangely. They may have violent muscle spasms or lose consciousness.
Epilepsy has many possible causes. It could be illness, brain injury and abnormal brain
development. In many cases, the cause is unknown. There are over 40 different types of
epilepsy.
3.1 Benign epilepsy of childhood with centrotemporal spikes (rolandic epilepsy)
Benign epilepsy of childhood with centrotemporal spikes is the most common focal epi-
lepsy in childhood. This disorder is also called rolandic epilepsy.
Loiseau and Duche provided five criteria for the diagnosis of benign childhood epi-
lepsy with centrotemporal spikes: 1) onset between the ages of 2 and 13; 2) absence of
Nonlinear Anal. Model. Control, 2011, Vol. 16, No. 4, 375–386
378 A. Juozapaviˇcius et al.
neurologic or intellectual deficit before the onset; 3) partial seizures with motor signs,
frequently associated with somatosensory symptoms or precipitated by sleep; 4) a spike
focus located in the centrotemporal (rolandic) area with normal background activity on
the interictal EEG; and 5) spontaneous remission during adolescence [7].
Rolandic epilepsy can start as early as 1 year of age or as late as 15 years of age, but
mostly it have onset of seizure between 7 and 10 years. Boys are more often affected,
with a ratio of 3:2.
3.2 Centrotemporal spikes
The cornerstone of the diagnosis of benign childhood epilepsy with centrotemporal spikes
lies in the characteristic interictal EEG pattern: centrotemporal spikes on normal back-
ground activity. The centrotemporal spikes are typically seen independently on both sides
of the head. Despite their name, these are usually high amplitude sharp and slow wave
complexes localized to the central (C3/C4) electrodes or midway between the central and
temporal electrodes (C5/C6). They are broad, diphasic, high-voltage (100-microvolts to
300-microvolts) spikes, with a transverse dipole, and they are often followed by a slow
wave. The spikes may occur isolated or in clusters, with a rhythm of about 1.5 Hz to
3 Hz [7] Sharp and slow wave complexes in areas outside the centrotemporal regions,
such as occipital, parietal, frontal, and midline regions, may occur concurrently with
centrotemporal spikes. They are of similar morphology to centrotemporal spikes. Normal
sleep architecture is preserved. Sometimes the generalized spikes could be found [9].
The spikes retain the same morphology in spite of change in state of vigilance but the
number of spikes is highly activated by sleep. So it is a good model for automatic spike
detection.
The main characteristics of centrotemporal spikes in rolandic epilepsy are:
• Length of 40–200 ms.
• Amplitude two times higher then that of the base line.
• Usually in C4/C3 or C5/C6 electrodes.
• Must be detected in at least two neighbouring electrodes.
4 Database design
To reduce time needed to develop EEG analysis algorithms and to allow large scale data
processing, an efficient database was needed. The main requirements for this database
are:
• Store EEG signals and allow fast access to them.
• Allow algorithms to store data related to an EEG signal (KDS, spikes, etc.), which
might later be used in advanced analysis such as data mining algorithms.
• Should be very scalable, since the number of EEG signals can be quite large.
www.mii.lt/NA
EEG analysis – automatic spike detection 379
4.1 Database management system
Traditional relational database management systems (RDBMS) were found to be slow and
not flexible enough for the given task. The analysis of EEG requires the ability for new
data types to be added as they become available (such as KDS, spike locations and etc.).
RDBMS systems require a scheme to be defined and altering it is very costly. Therefore
schema-less object databases were used. Schema-less allow more flexible ways to define
data types and require almost no time needed for the setup. MongoDB1
was found most
fit for the given task.
MongoDB’s MapReduce framework also provides an efficient way to distribute data
processing over a large amount of computer nodes, which does shorten the time needed
to process large amounts of EEG data.
4.2 Data
Our datasets are EEG records, approximately 1 hour long each. Each record contains
recorded data over 20 or even more EEG and non-EEG channels, such as EKG. It was
chosen to subdivide the EEG records to 30 s intervals. This length was chosen since it is
the time interval usually analyzed by doctors, also it provides enough data for simple
analysis (KDS, spike detection, etc.) while still being small enough to be processed
efficiently.
Each interval is stored in a document. Along with the signal itself meta-data, such as
sampling rate, length and patient information is stored. A tag property is used to identify
which algorithms have been applied to this EEG.
Each database element is a document, therefore it is very easy to add additional
data such as spike information or KDS. The analysis algorithm only needs to add a new
property representing the data to the document and add its name to the tag property. By
using the tag property it can be easily distinguished which documents have additional
data calculated by analysis algorithms. During the analysis of KDS and spike detection
algorithms this database design proved it self to be very efficient and flexible to work with.
5 EEG data analysis
In this section a method to calculate Karolinska drowsiness scale will be discussed.
5.1 Brain rhythm calculation
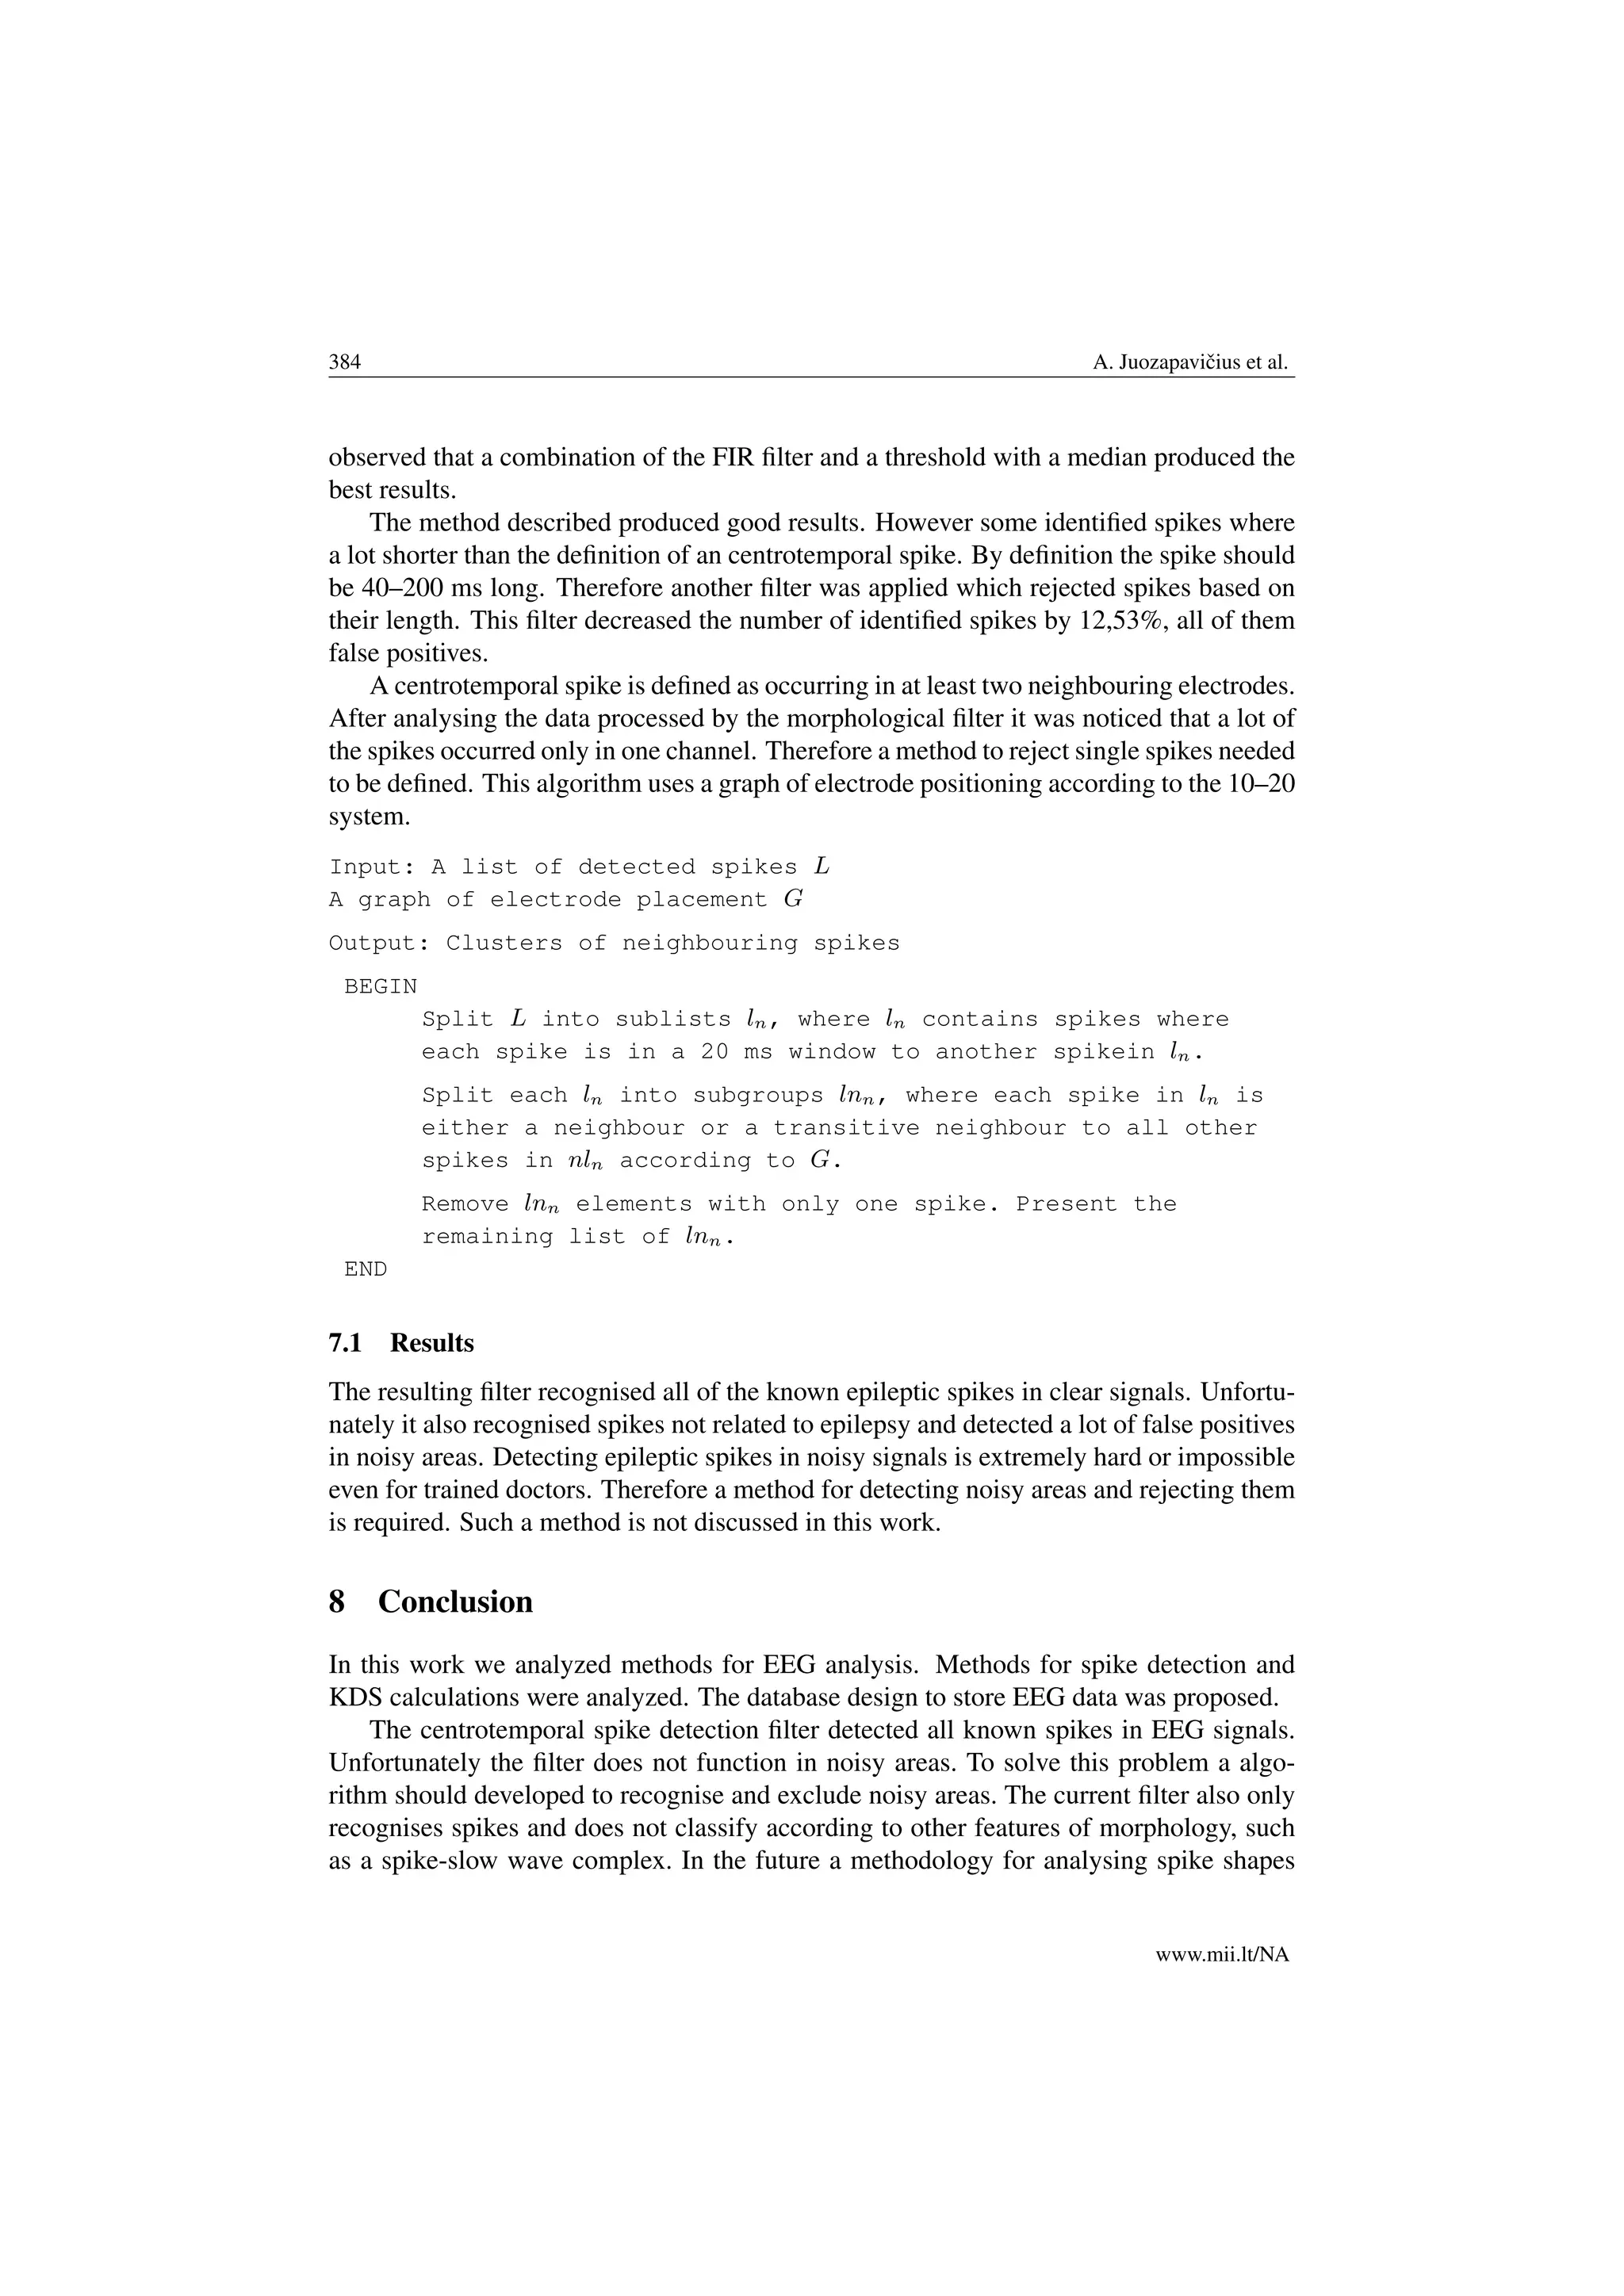
To calculate brain rhythms a discrete Fourier (DFT) transformation is used:
N−1
n=0
xn sin −
2π
N
kn + i cos −
2π
N
kn k = 0, . . . , N − 1.
1MongoDB – http://www.mongodb.org/
Nonlinear Anal. Model. Control, 2011, Vol. 16, No. 4, 375–386
380 A. Juozapaviˇcius et al.
as well as the inverse discrete Fourier transformation (IDFT):
xn =
1
N
N−1
k=0
Xke(2πi/N)kn
n = 0, . . . , N − 1.
To calculate the required brain rhythm DFT is applied over the signal. All the frequencies
not corresponding to the required rhythm are set to zero. IDFT is applied over the resulting
data.
After filtering out all the waves except the required rhythm we can calculate its power.
To do this we use a statistical value – root mean square. Which is defined as:
RMS =
x2
0 + x2
1 + . . . = y2
N−1
N
Here x is value of the signal at a discrete time. For every interval of EEG all of the brain
rhythms and their powers are calculated. Out of these a rhythm is said to be dominant in
an interval if its power is the highest.
5.2 Karolinska drowsiness scale
Karolinska drowsiness scale (KDS) [4] is an objective method to calculate the drowsiness
of a person based on an 20–30 s EEG interval. The scale assigns a score from 1 (com-
pletely awake) to 9 (very drowsy) to a EEG interval according to a persons drowsiness.
The score is calculated as follows:
Input: an EEG interval I
Output: KDS score
BEGIN
Split I into 10 subintervals in.
Calculate the dominant brain rhythm for every in.
If 3 or more in have theta as the dominant rhythm the person
is asleep, return 10. Else return the number of times
alpha is the dominant rhythm in in.
END
6 Automatic spike detection
Due to the need of an automatic spike detection method in electroencephalograms there
are a few algorithms [3] proposed. One of the most reliable of these is an algorithm
based on mathematical morphology. This method is shown to be accurate on 91.62%
of centrotemporal spikes [10]. Due to this high reliability morphological filtering was
chosen for automatic spike detection.
www.mii.lt/NA
EEG analysis – automatic spike detection 381
6.1 Morphological operations
In this section we give a short explanation of mathematical morphology used in the filter.
In the filter two main operations are used erosion and dilation. These two operations
are also called Minkowski addition and subtraction respectively [10]. Let’s say f(t) is a
time series of time t (i.e. a single EEG channel) and g(t) is a function defining a structural
element. Then gs
(t) is defined as a reflection of g(t), gs
(t) = g(−t). D is the domain of
f(t). Then we can define:
Erosion
f gs
(t) = min
τ∈D
f(τ) − g − (t − τ) ;
Dilation:
f ⊕ gs
(t) = max
τ∈D
f(τ) + g − (t − τ) .
Using these operations we can define two new operators [10].
Opening operation:
(f ◦ g)(t) = f gs
⊕ g (t);
Closing operation:
(f • g)(t) = f ⊕ gs
g (t).
The opening operation smoothes f(t) from below by cutting of its spikes, while
closing smoothes the function from above by filling up valleys between spikes. Therefore
opening and closing can be used to detect spikes and valleys in function f(t).
6.2 Morphological operation combination
Centrotemporal spikes can have both positive and negative amplitudes. Since the closing
and opening operations can detect spikes of only positive or negative amplitude, two
additional operators need to be defined:
Close-opening [10]:
CO f(t) = f(t) • g1(t) ◦ g2(t);
Open-closing:
OC f(t) = f(t) • g1(t) ◦ g2(t).
Here g1(t) and g2(t) are two distinct structural elements.
Both of these operations distort the amplitude of the function. Open-closing has a lower
amplitude while close-opening has a higher amplitude. These distortions can cause false
positive identifications or hide centrotemporal spikes. The effect of these operations is
opposite to each other. Therefore their average can be used instead [10]:
OCCO (f)t =
OC(f(t)) + CO(f(t))
2
.
Nonlinear Anal. Model. Control, 2011, Vol. 16, No. 4, 375–386
382 A. Juozapaviˇcius et al.
6.3 Structural element
In order to distinguish between background activity and centrotemporal spikes a structur-
ing element is needed. This element needs to fit in regular EEG waves but not into spikes.
An element that matches the morphology of a single EEG wave is a parabola. Therefore
the two parabola shaped structuring elements are defined [11]:
gi(t) = ait2
+ bi, i = 1, 2.
Parameters a and b control the width and amplitude of the parabola. Since the width
and amplitude of an EEG signal varies depending on a variety of factors, it is impossible
to select a set of values that match every interval of a patient’s EEG. Therefore each
structuring element must be fitted to a small time frame of a single EEG channel. Another
reason for this approach is that doctors detect centrotemporal spikes by their neighbouring
data.
Let us define widths as an array where the width of arcs is defined. The width of
an arc is the distance between two extrema (min or max) in f(t). |f| – an array of
amplitudes of the signal f(t). Then the width wi and height hi of structural elements gi
can be calculated as:
h1 = median |f| ,
h2 = 2 ∗ median |f| ,
w1 = 0.5 ∗ median(widths),
w2 = 1.5 ∗ median(widths).
The structuring element g1(t) is applied to the original signal and needs to fit the waves
of the original. The second structuring element g2(t) is applied over a signal modified by
a closing or opening operation therefore the values need to be increased. When the width
and height of the parabolas is known, parameters ai and bi can be calculated as:
b1 = median |f| ,
b2 = median |f| ,
a1 =
median(|f|)
0.5 ∗ median(widths)
,
a2 =
median(|f|)
1.5 ∗ median(widths)
.
6.4 Application
After fitting the structural element, the morphological filter can be applied:
x(t) = f(t) − OCCO f(t) .
The resulting signal x(t) will have its background activity diminished, while the spikes
will be exposed. To identify the centrotemporal spikes, a threshold needs to be defined.
www.mii.lt/NA
EEG analysis – automatic spike detection 383
This threshold is the limit which needs to be exceeded in order for a spike to be considered
a sign of epilepsy [11]:
Thr = 8 ∗ median extrema x(t) .
Here the function extrema(x(t)) is defined as the amplitude of x(t) extrema.
6.5 Finite impulse response filter
After applying the morphological filter over real life data it can be seen that it is very
susceptible to high frequency noise. To remedy this problem a finite impulse response
filter (FIR), based on finite impulse response, can be applied over the EEG signal.
FIR is a discrete time filter whose impulse response is finite – it settles to zero in a
finite number of steps. It is low-pass filter, which means that it only adjusts signals higher
than the cut off frequency. FIR is defined by a difference equation [12]:
y[n] = b0[n] + b1[n − 1] + . . . + bN x[n − N]
where x[n] is the input signal, y[n] is the output signal, bi are the filter coefficients and N
is the order of the filter g.
7 Filter tests on real life data
The morphological filter was applied on data provided by Vilnius University Children’s
Hospital. The data included 15 EEGs of children with Rolandic epilepsy. Each EEG was
around an hour long and included signals gatthered by electrodes placed in the 10–20
system.
For the tests the previously described threshold was used. While the filter worked on
some of data, on other it returned spikes on every extrema. This was due to a 35 Hz noise
distorting the orignal signal. The 35 Hz noise is of neurophysiological origin. Due to
noise the threshold would be set very close to 0. This problem was solved by applying a
FIR filter with a cutoff frequency of 35 Hz. Since the length of a centrotemporal spike is
40–200 ms it did not affect the detection of spikes in any other way. Test results showed
that a 64th degree FIR filter was enough to process the signal while not incurring a large
performance penalty. Unfortunately the FIR filter also caused the morphological filter to
identify false positive spikes in noisy regions. Especially electrodes F7 and F8 during eye
movement. The morphological filter can not handle noisy signals therefore a different
algorithm should be used to identify or correct these intervals.
Another approach to filter out the 35 Hz noise is to change the threshold to:
Thr = 8 ∗ average |extrema| .
While this does solve the problem it also causes a lot of false negatives. After testing the
threshold with average and median as well as adjusting the multiplication constant it was
Nonlinear Anal. Model. Control, 2011, Vol. 16, No. 4, 375–386
384 A. Juozapaviˇcius et al.
observed that a combination of the FIR filter and a threshold with a median produced the
best results.
The method described produced good results. However some identified spikes where
a lot shorter than the definition of an centrotemporal spike. By definition the spike should
be 40–200 ms long. Therefore another filter was applied which rejected spikes based on
their length. This filter decreased the number of identified spikes by 12,53%, all of them
false positives.
A centrotemporal spike is defined as occurring in at least two neighbouring electrodes.
After analysing the data processed by the morphological filter it was noticed that a lot of
the spikes occurred only in one channel. Therefore a method to reject single spikes needed
to be defined. This algorithm uses a graph of electrode positioning according to the 10–20
system.
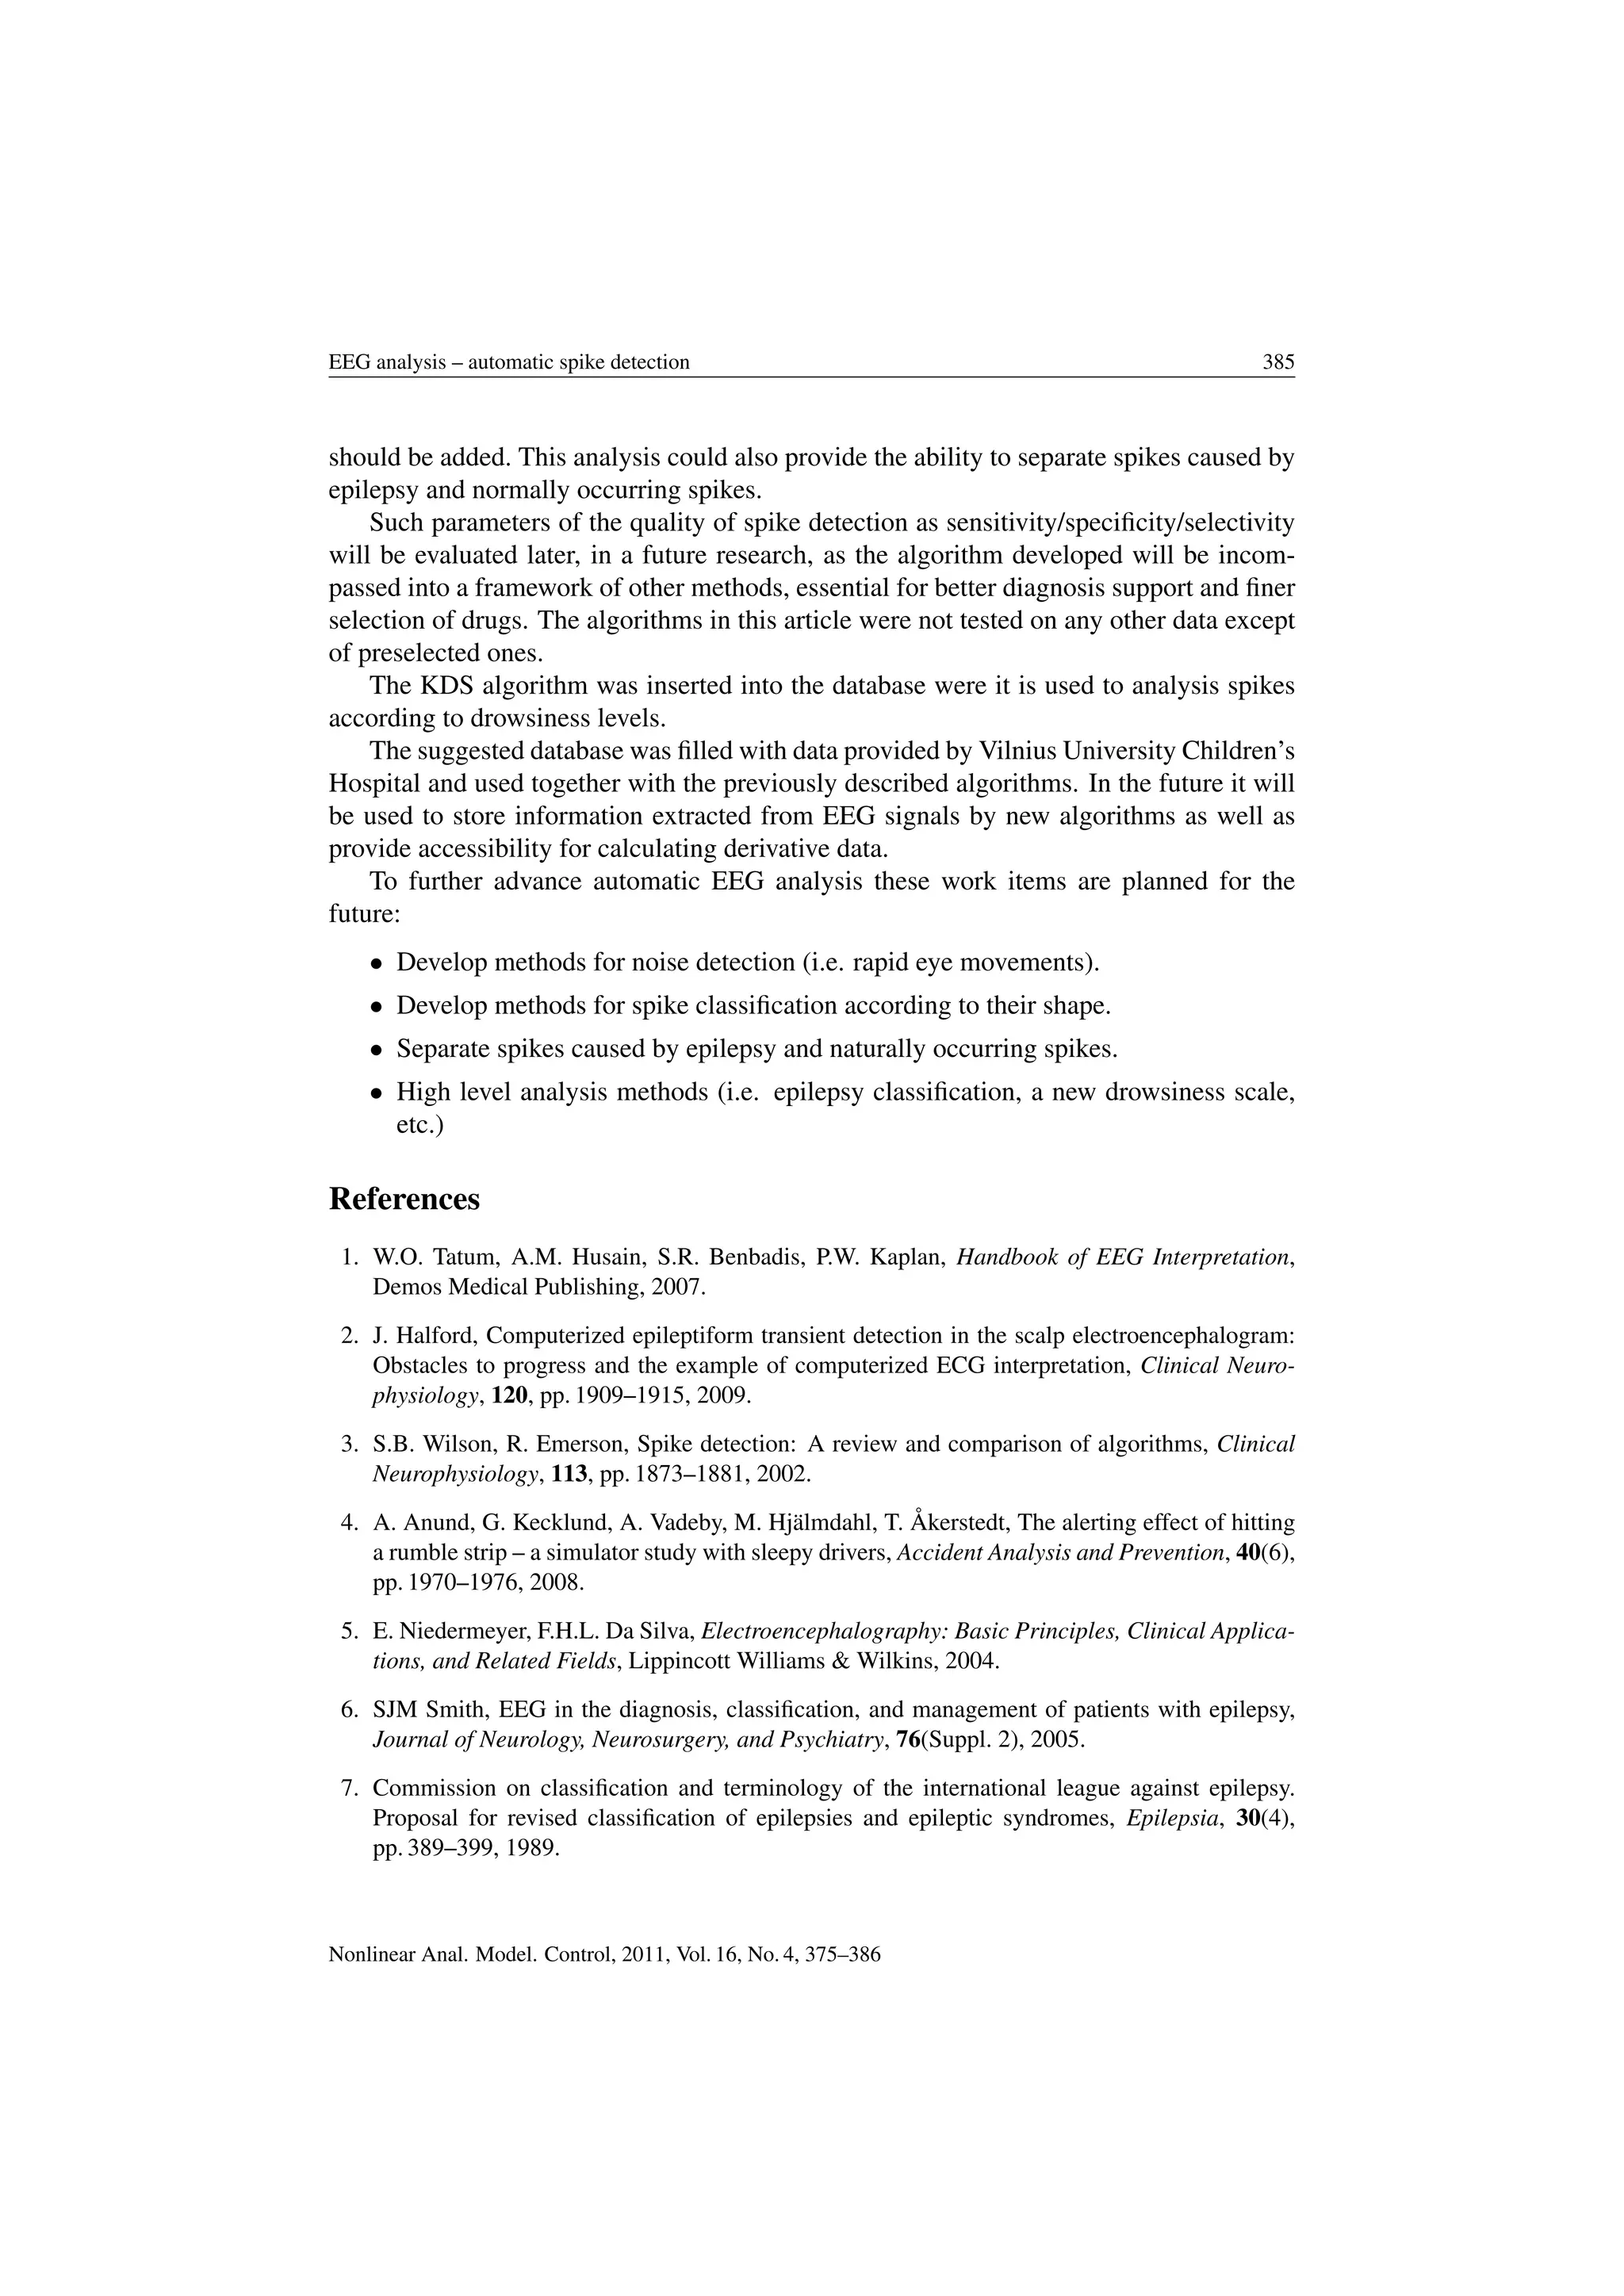
Input: A list of detected spikes L
A graph of electrode placement G
Output: Clusters of neighbouring spikes
BEGIN
Split L into sublists ln, where ln contains spikes where
each spike is in a 20 ms window to another spikein ln.
Split each ln into subgroups lnn, where each spike in ln is
either a neighbour or a transitive neighbour to all other
spikes in nln according to G.
Remove lnn elements with only one spike. Present the
remaining list of lnn.
END
7.1 Results
The resulting filter recognised all of the known epileptic spikes in clear signals. Unfortu-
nately it also recognised spikes not related to epilepsy and detected a lot of false positives
in noisy areas. Detecting epileptic spikes in noisy signals is extremely hard or impossible
even for trained doctors. Therefore a method for detecting noisy areas and rejecting them
is required. Such a method is not discussed in this work.
8 Conclusion
In this work we analyzed methods for EEG analysis. Methods for spike detection and
KDS calculations were analyzed. The database design to store EEG data was proposed.
The centrotemporal spike detection filter detected all known spikes in EEG signals.
Unfortunately the filter does not function in noisy areas. To solve this problem a algo-
rithm should developed to recognise and exclude noisy areas. The current filter also only
recognises spikes and does not classify according to other features of morphology, such
as a spike-slow wave complex. In the future a methodology for analysing spike shapes
www.mii.lt/NA
EEG analysis – automatic spike detection 385
should be added. This analysis could also provide the ability to separate spikes caused by
epilepsy and normally occurring spikes.
Such parameters of the quality of spike detection as sensitivity/specificity/selectivity
will be evaluated later, in a future research, as the algorithm developed will be incom-
passed into a framework of other methods, essential for better diagnosis support and finer
selection of drugs. The algorithms in this article were not tested on any other data except
of preselected ones.
The KDS algorithm was inserted into the database were it is used to analysis spikes
according to drowsiness levels.
The suggested database was filled with data provided by Vilnius University Children’s
Hospital and used together with the previously described algorithms. In the future it will
be used to store information extracted from EEG signals by new algorithms as well as
provide accessibility for calculating derivative data.
To further advance automatic EEG analysis these work items are planned for the
future:
• Develop methods for noise detection (i.e. rapid eye movements).
• Develop methods for spike classification according to their shape.
• Separate spikes caused by epilepsy and naturally occurring spikes.
• High level analysis methods (i.e. epilepsy classification, a new drowsiness scale,
etc.)
References
1. W.O. Tatum, A.M. Husain, S.R. Benbadis, P.W. Kaplan, Handbook of EEG Interpretation,
Demos Medical Publishing, 2007.
2. J. Halford, Computerized epileptiform transient detection in the scalp electroencephalogram:
Obstacles to progress and the example of computerized ECG interpretation, Clinical Neuro-
physiology, 120, pp. 1909–1915, 2009.
3. S.B. Wilson, R. Emerson, Spike detection: A review and comparison of algorithms, Clinical
Neurophysiology, 113, pp. 1873–1881, 2002.
4. A. Anund, G. Kecklund, A. Vadeby, M. Hjälmdahl, T. Åkerstedt, The alerting effect of hitting
a rumble strip – a simulator study with sleepy drivers, Accident Analysis and Prevention, 40(6),
pp. 1970–1976, 2008.
5. E. Niedermeyer, F.H.L. Da Silva, Electroencephalography: Basic Principles, Clinical Applica-
tions, and Related Fields, Lippincott Williams & Wilkins, 2004.
6. SJM Smith, EEG in the diagnosis, classification, and management of patients with epilepsy,
Journal of Neurology, Neurosurgery, and Psychiatry, 76(Suppl. 2), 2005.
7. Commission on classification and terminology of the international league against epilepsy.
Proposal for revised classification of epilepsies and epileptic syndromes, Epilepsia, 30(4),
pp. 389–399, 1989.
Nonlinear Anal. Model. Control, 2011, Vol. 16, No. 4, 375–386
386 A. Juozapaviˇcius et al.
8. A.T. Berg et al., Revised terminology and concepts for organization of seizures and epilepsies:
Report of the ILAE Commission on Classification and Terminology, Epilepsia, 51(4), pp. 676–
685, 2010.
9. J.M. Pellock, W.E. Dodson, B.F.D. Bourgeois, Pediatric Epilepsy: Diagnosis and Therapy,
Demos Medical Publishing, 2008.
10. G. Xu, J. Wang, Q. Zhang, J. Zhu, An automatic EEG spike detection algorithm using
morphological filter, in: Proceeding of the 2006 IEEE International Conference on Automation
Science and Engineering Shanghai, China, October 7–10, 2006, pp. 170–175.
11. M. Kazakeviˇciut˙e, A. Juozapaviˇcius, R. Samaitien˙e, Morphological filtering of eeg, Materials
Physics and Mechanics, 9, pp. 185–193, 2010.
12. S.J. Orfanidis, Introduction to Signal Processing, Prentice Hall, 1996.
www.mii.lt/NA

More Related Content

What's hot

POWER SPECTRAL ANALYSIS OF EEG AS A POTENTIAL MARKER IN THE DIAGNOSIS OF SPAS...
POWER SPECTRAL ANALYSIS OF EEG AS A POTENTIAL MARKER IN THE DIAGNOSIS OF SPAS...POWER SPECTRAL ANALYSIS OF EEG AS A POTENTIAL MARKER IN THE DIAGNOSIS OF SPAS...
POWER SPECTRAL ANALYSIS OF EEG AS A POTENTIAL MARKER IN THE DIAGNOSIS OF SPAS...ijbesjournal
 
Methods of examining functions of CNS
Methods of examining functions of CNSMethods of examining functions of CNS
Methods of examining functions of CNSAayupta Mohanty
 
Development of portable eeg for treatment & diagnosis of disorders
Development of portable eeg for treatment & diagnosis of disordersDevelopment of portable eeg for treatment & diagnosis of disorders
Development of portable eeg for treatment & diagnosis of disordersandfaulkner
 
ANALYSIS OF BRAIN COGNITIVE STATE FOR ARITHMETIC TASK AND MOTOR TASK USING EL...
ANALYSIS OF BRAIN COGNITIVE STATE FOR ARITHMETIC TASK AND MOTOR TASK USING EL...ANALYSIS OF BRAIN COGNITIVE STATE FOR ARITHMETIC TASK AND MOTOR TASK USING EL...
ANALYSIS OF BRAIN COGNITIVE STATE FOR ARITHMETIC TASK AND MOTOR TASK USING EL...sipij
 
Critical care eeg monitoring
Critical care eeg monitoringCritical care eeg monitoring
Critical care eeg monitoringTeik Beng Khoo
 
Issues in brainmapping...EEG in dementias and hereditary encephalopathies
Issues in brainmapping...EEG in dementias and hereditary encephalopathiesIssues in brainmapping...EEG in dementias and hereditary encephalopathies
Issues in brainmapping...EEG in dementias and hereditary encephalopathiesProfessor Yasser Metwally
 
Evoked potentials, clinical importance & physiological basis of consciousness...
Evoked potentials, clinical importance & physiological basis of consciousness...Evoked potentials, clinical importance & physiological basis of consciousness...
Evoked potentials, clinical importance & physiological basis of consciousness...Rajesh Goit
 
Clinical teaching on electroencephelography
Clinical teaching on electroencephelographyClinical teaching on electroencephelography
Clinical teaching on electroencephelographyAquiflal KM
 
Eeg with image - Medical Electronics - Hints for Slow Learner
Eeg with image - Medical Electronics - Hints for Slow LearnerEeg with image - Medical Electronics - Hints for Slow Learner
Eeg with image - Medical Electronics - Hints for Slow LearnerMathavan N
 
Magnetoencephalography
MagnetoencephalographyMagnetoencephalography
MagnetoencephalographyNeurologyKota
 
Cognitive and Emotional Neuro-Prostheses
Cognitive and Emotional Neuro-ProsthesesCognitive and Emotional Neuro-Prostheses
Cognitive and Emotional Neuro-ProsthesesOmer Ali
 

What's hot (20)

POWER SPECTRAL ANALYSIS OF EEG AS A POTENTIAL MARKER IN THE DIAGNOSIS OF SPAS...
POWER SPECTRAL ANALYSIS OF EEG AS A POTENTIAL MARKER IN THE DIAGNOSIS OF SPAS...POWER SPECTRAL ANALYSIS OF EEG AS A POTENTIAL MARKER IN THE DIAGNOSIS OF SPAS...
POWER SPECTRAL ANALYSIS OF EEG AS A POTENTIAL MARKER IN THE DIAGNOSIS OF SPAS...
 
EEG
EEGEEG
EEG
 
IJET-V2I6P20
IJET-V2I6P20IJET-V2I6P20
IJET-V2I6P20
 
A0510107
A0510107A0510107
A0510107
 
Methods of examining functions of CNS
Methods of examining functions of CNSMethods of examining functions of CNS
Methods of examining functions of CNS
 
Development of portable eeg for treatment & diagnosis of disorders
Development of portable eeg for treatment & diagnosis of disordersDevelopment of portable eeg for treatment & diagnosis of disorders
Development of portable eeg for treatment & diagnosis of disorders
 
ANALYSIS OF BRAIN COGNITIVE STATE FOR ARITHMETIC TASK AND MOTOR TASK USING EL...
ANALYSIS OF BRAIN COGNITIVE STATE FOR ARITHMETIC TASK AND MOTOR TASK USING EL...ANALYSIS OF BRAIN COGNITIVE STATE FOR ARITHMETIC TASK AND MOTOR TASK USING EL...
ANALYSIS OF BRAIN COGNITIVE STATE FOR ARITHMETIC TASK AND MOTOR TASK USING EL...
 
Critical care eeg monitoring
Critical care eeg monitoringCritical care eeg monitoring
Critical care eeg monitoring
 
Issues in brainmapping...EEG in dementias and hereditary encephalopathies
Issues in brainmapping...EEG in dementias and hereditary encephalopathiesIssues in brainmapping...EEG in dementias and hereditary encephalopathies
Issues in brainmapping...EEG in dementias and hereditary encephalopathies
 
Evoked potentials, clinical importance & physiological basis of consciousness...
Evoked potentials, clinical importance & physiological basis of consciousness...Evoked potentials, clinical importance & physiological basis of consciousness...
Evoked potentials, clinical importance & physiological basis of consciousness...
 
Clinical teaching on electroencephelography
Clinical teaching on electroencephelographyClinical teaching on electroencephelography
Clinical teaching on electroencephelography
 
Eeg with image - Medical Electronics - Hints for Slow Learner
Eeg with image - Medical Electronics - Hints for Slow LearnerEeg with image - Medical Electronics - Hints for Slow Learner
Eeg with image - Medical Electronics - Hints for Slow Learner
 
Magnetoencephalography
MagnetoencephalographyMagnetoencephalography
Magnetoencephalography
 
EEG INTERPRETATION
EEG INTERPRETATIONEEG INTERPRETATION
EEG INTERPRETATION
 
Recognition of abnormal EEG.
Recognition of abnormal EEG.Recognition of abnormal EEG.
Recognition of abnormal EEG.
 
Presentation(lokesh)
Presentation(lokesh)Presentation(lokesh)
Presentation(lokesh)
 
Eeg basics.drjma
Eeg basics.drjmaEeg basics.drjma
Eeg basics.drjma
 
EEG & Evoked potentials
EEG & Evoked potentialsEEG & Evoked potentials
EEG & Evoked potentials
 
Int journal 04
Int journal 04Int journal 04
Int journal 04
 
Cognitive and Emotional Neuro-Prostheses
Cognitive and Emotional Neuro-ProsthesesCognitive and Emotional Neuro-Prostheses
Cognitive and Emotional Neuro-Prostheses
 

Viewers also liked

Cross cultural communication
Cross cultural communicationCross cultural communication
Cross cultural communicationjagrutibbhatt
 
Kiat kiat membuat
Kiat kiat membuatKiat kiat membuat
Kiat kiat membuatJamal Psw
 
Membuat karya tulis
Membuat karya tulisMembuat karya tulis
Membuat karya tulisJamal Psw
 
NIEHS2016_ERCC_Agilent_RUO_Final
NIEHS2016_ERCC_Agilent_RUO_FinalNIEHS2016_ERCC_Agilent_RUO_Final
NIEHS2016_ERCC_Agilent_RUO_FinalNamrata Joglekar
 
The importance of controls and novel solutions for successful real-time qPCR
The importance of controls and novel solutions for successful real-time qPCRThe importance of controls and novel solutions for successful real-time qPCR
The importance of controls and novel solutions for successful real-time qPCRQIAGEN
 
Genome in a Bottle Consortium Workshop Welcome Aug. 16
Genome in a Bottle Consortium Workshop Welcome Aug. 16Genome in a Bottle Consortium Workshop Welcome Aug. 16
Genome in a Bottle Consortium Workshop Welcome Aug. 16GenomeInABottle
 
Quality Control of Sequencing Data
Quality Control of Sequencing DataQuality Control of Sequencing Data
Quality Control of Sequencing DataSurya Saha
 
Aug2013 reference material selection and design working group
Aug2013 reference material selection and design working groupAug2013 reference material selection and design working group
Aug2013 reference material selection and design working groupGenomeInABottle
 
Sept2016 plenary mercer_sequins
Sept2016 plenary mercer_sequinsSept2016 plenary mercer_sequins
Sept2016 plenary mercer_sequinsGenomeInABottle
 
Next-generation sequencing and quality control: An Introduction (2016)
Next-generation sequencing and quality control: An Introduction (2016)Next-generation sequencing and quality control: An Introduction (2016)
Next-generation sequencing and quality control: An Introduction (2016)Sebastian Schmeier
 
RNA Integrity and Quality – Standardize RNA Quality Control
RNA Integrity and Quality – Standardize RNA Quality Control RNA Integrity and Quality – Standardize RNA Quality Control
RNA Integrity and Quality – Standardize RNA Quality Control QIAGEN
 
GIAB-GRC workshop oct2015 giab introduction 151005
GIAB-GRC workshop oct2015 giab introduction 151005GIAB-GRC workshop oct2015 giab introduction 151005
GIAB-GRC workshop oct2015 giab introduction 151005GenomeInABottle
 

Viewers also liked (18)

Cross cultural communication
Cross cultural communicationCross cultural communication
Cross cultural communication
 
Kiat kiat membuat
Kiat kiat membuatKiat kiat membuat
Kiat kiat membuat
 
Tool Book March - June 2016
Tool Book March - June 2016Tool Book March - June 2016
Tool Book March - June 2016
 
Membuat karya tulis
Membuat karya tulisMembuat karya tulis
Membuat karya tulis
 
Biomedical research published
Biomedical research publishedBiomedical research published
Biomedical research published
 
Do it Best Outdoor Living Catalog
Do it Best Outdoor Living CatalogDo it Best Outdoor Living Catalog
Do it Best Outdoor Living Catalog
 
NIEHS2016_ERCC_Agilent_RUO_Final
NIEHS2016_ERCC_Agilent_RUO_FinalNIEHS2016_ERCC_Agilent_RUO_Final
NIEHS2016_ERCC_Agilent_RUO_Final
 
The importance of controls and novel solutions for successful real-time qPCR
The importance of controls and novel solutions for successful real-time qPCRThe importance of controls and novel solutions for successful real-time qPCR
The importance of controls and novel solutions for successful real-time qPCR
 
Genome in a Bottle Consortium Workshop Welcome Aug. 16
Genome in a Bottle Consortium Workshop Welcome Aug. 16Genome in a Bottle Consortium Workshop Welcome Aug. 16
Genome in a Bottle Consortium Workshop Welcome Aug. 16
 
Quality Control of Sequencing Data
Quality Control of Sequencing DataQuality Control of Sequencing Data
Quality Control of Sequencing Data
 
Aug2013 reference material selection and design working group
Aug2013 reference material selection and design working groupAug2013 reference material selection and design working group
Aug2013 reference material selection and design working group
 
Sept2016 plenary mercer_sequins
Sept2016 plenary mercer_sequinsSept2016 plenary mercer_sequins
Sept2016 plenary mercer_sequins
 
Next-generation sequencing and quality control: An Introduction (2016)
Next-generation sequencing and quality control: An Introduction (2016)Next-generation sequencing and quality control: An Introduction (2016)
Next-generation sequencing and quality control: An Introduction (2016)
 
RNA Integrity and Quality – Standardize RNA Quality Control
RNA Integrity and Quality – Standardize RNA Quality Control RNA Integrity and Quality – Standardize RNA Quality Control
RNA Integrity and Quality – Standardize RNA Quality Control
 
20140710 1 day1_nist_ercc2.0workshop
20140710 1 day1_nist_ercc2.0workshop20140710 1 day1_nist_ercc2.0workshop
20140710 1 day1_nist_ercc2.0workshop
 
20140710 5 k_thompson_ercc2.0_workshop
20140710 5 k_thompson_ercc2.0_workshop20140710 5 k_thompson_ercc2.0_workshop
20140710 5 k_thompson_ercc2.0_workshop
 
20140710 3 l_paul_ercc2.0_workshop
20140710 3 l_paul_ercc2.0_workshop20140710 3 l_paul_ercc2.0_workshop
20140710 3 l_paul_ercc2.0_workshop
 
GIAB-GRC workshop oct2015 giab introduction 151005
GIAB-GRC workshop oct2015 giab introduction 151005GIAB-GRC workshop oct2015 giab introduction 151005
GIAB-GRC workshop oct2015 giab introduction 151005
 

Similar to Algamantas juozapavcius

Biomarker and human cognition.pdf
Biomarker and human cognition.pdfBiomarker and human cognition.pdf
Biomarker and human cognition.pdfArundhutiNaskar
 
Alotaiby2014 article eeg_seizure_detectionandpredicti
Alotaiby2014 article eeg_seizure_detectionandpredictiAlotaiby2014 article eeg_seizure_detectionandpredicti
Alotaiby2014 article eeg_seizure_detectionandpredictiMuhammad Rizwan
 
IRJET- Deep Learning Technique for Feature Classification of Eeg to Acces...
IRJET-  	  Deep Learning Technique for Feature Classification of Eeg to Acces...IRJET-  	  Deep Learning Technique for Feature Classification of Eeg to Acces...
IRJET- Deep Learning Technique for Feature Classification of Eeg to Acces...IRJET Journal
 
Chapter (1) Introduction to EEG
Chapter (1) Introduction to EEGChapter (1) Introduction to EEG
Chapter (1) Introduction to EEGkamal2011
 
Feature Extraction Techniques and Classification Algorithms for EEG Signals t...
Feature Extraction Techniques and Classification Algorithms for EEG Signals t...Feature Extraction Techniques and Classification Algorithms for EEG Signals t...
Feature Extraction Techniques and Classification Algorithms for EEG Signals t...Editor IJCATR
 
A Novel Approach For Detection of Neurological Disorders through Electrical P...
A Novel Approach For Detection of Neurological Disorders through Electrical P...A Novel Approach For Detection of Neurological Disorders through Electrical P...
A Novel Approach For Detection of Neurological Disorders through Electrical P...IJECEIAES
 
NEUROPHYSIOLOGY technique.pptx
NEUROPHYSIOLOGY technique.pptxNEUROPHYSIOLOGY technique.pptx
NEUROPHYSIOLOGY technique.pptxMr SACHIN
 
MHEALTH APPLICATIONS DEVELOPED BY THE MINISTRY OF HEALTH FOR PUBLIC USERS INK...
MHEALTH APPLICATIONS DEVELOPED BY THE MINISTRY OF HEALTH FOR PUBLIC USERS INK...MHEALTH APPLICATIONS DEVELOPED BY THE MINISTRY OF HEALTH FOR PUBLIC USERS INK...
MHEALTH APPLICATIONS DEVELOPED BY THE MINISTRY OF HEALTH FOR PUBLIC USERS INK...hiij
 
neonatal cerebral function monitoring
neonatal cerebral function monitoringneonatal cerebral function monitoring
neonatal cerebral function monitoringAhmed Okasha
 
EEG Signal Classification using Deep Neural Network
EEG Signal Classification using Deep Neural NetworkEEG Signal Classification using Deep Neural Network
EEG Signal Classification using Deep Neural NetworkIRJET Journal
 
Neurofeedback as Treatment of Autism Spectrum Disorder-
Neurofeedback as Treatment of Autism Spectrum Disorder-Neurofeedback as Treatment of Autism Spectrum Disorder-
Neurofeedback as Treatment of Autism Spectrum Disorder-MOK wahedi
 
EEG & Epilepsy syndromes report [Autosaved]
EEG & Epilepsy syndromes report [Autosaved]EEG & Epilepsy syndromes report [Autosaved]
EEG & Epilepsy syndromes report [Autosaved]Margaret Mendez
 
Presentation EEG (1).pptx
Presentation EEG (1).pptxPresentation EEG (1).pptx
Presentation EEG (1).pptxAjaySingh686444
 
Electroencephalogram(EEG)
Electroencephalogram(EEG)Electroencephalogram(EEG)
Electroencephalogram(EEG)ashikh
 

Similar to Algamantas juozapavcius (20)

Electroencephal ogram (eeg)
Electroencephal ogram (eeg)Electroencephal ogram (eeg)
Electroencephal ogram (eeg)
 
Eeg
EegEeg
Eeg
 
Biomarker and human cognition.pdf
Biomarker and human cognition.pdfBiomarker and human cognition.pdf
Biomarker and human cognition.pdf
 
Alotaiby2014 article eeg_seizure_detectionandpredicti
Alotaiby2014 article eeg_seizure_detectionandpredictiAlotaiby2014 article eeg_seizure_detectionandpredicti
Alotaiby2014 article eeg_seizure_detectionandpredicti
 
IRJET- Deep Learning Technique for Feature Classification of Eeg to Acces...
IRJET-  	  Deep Learning Technique for Feature Classification of Eeg to Acces...IRJET-  	  Deep Learning Technique for Feature Classification of Eeg to Acces...
IRJET- Deep Learning Technique for Feature Classification of Eeg to Acces...
 
Chapter (1) Introduction to EEG
Chapter (1) Introduction to EEGChapter (1) Introduction to EEG
Chapter (1) Introduction to EEG
 
Feature Extraction Techniques and Classification Algorithms for EEG Signals t...
Feature Extraction Techniques and Classification Algorithms for EEG Signals t...Feature Extraction Techniques and Classification Algorithms for EEG Signals t...
Feature Extraction Techniques and Classification Algorithms for EEG Signals t...
 
EEG and epilepsy
EEG and epilepsyEEG and epilepsy
EEG and epilepsy
 
Electroencephalogram
ElectroencephalogramElectroencephalogram
Electroencephalogram
 
Deep Learning Analysis for Estimating Sleep Syndrome Detection Utilizing the ...
Deep Learning Analysis for Estimating Sleep Syndrome Detection Utilizing the ...Deep Learning Analysis for Estimating Sleep Syndrome Detection Utilizing the ...
Deep Learning Analysis for Estimating Sleep Syndrome Detection Utilizing the ...
 
A Novel Approach For Detection of Neurological Disorders through Electrical P...
A Novel Approach For Detection of Neurological Disorders through Electrical P...A Novel Approach For Detection of Neurological Disorders through Electrical P...
A Novel Approach For Detection of Neurological Disorders through Electrical P...
 
NEUROPHYSIOLOGY technique.pptx
NEUROPHYSIOLOGY technique.pptxNEUROPHYSIOLOGY technique.pptx
NEUROPHYSIOLOGY technique.pptx
 
MHEALTH APPLICATIONS DEVELOPED BY THE MINISTRY OF HEALTH FOR PUBLIC USERS INK...
MHEALTH APPLICATIONS DEVELOPED BY THE MINISTRY OF HEALTH FOR PUBLIC USERS INK...MHEALTH APPLICATIONS DEVELOPED BY THE MINISTRY OF HEALTH FOR PUBLIC USERS INK...
MHEALTH APPLICATIONS DEVELOPED BY THE MINISTRY OF HEALTH FOR PUBLIC USERS INK...
 
Eeg presentation
Eeg presentationEeg presentation
Eeg presentation
 
neonatal cerebral function monitoring
neonatal cerebral function monitoringneonatal cerebral function monitoring
neonatal cerebral function monitoring
 
EEG Signal Classification using Deep Neural Network
EEG Signal Classification using Deep Neural NetworkEEG Signal Classification using Deep Neural Network
EEG Signal Classification using Deep Neural Network
 
Neurofeedback as Treatment of Autism Spectrum Disorder-
Neurofeedback as Treatment of Autism Spectrum Disorder-Neurofeedback as Treatment of Autism Spectrum Disorder-
Neurofeedback as Treatment of Autism Spectrum Disorder-
 
EEG & Epilepsy syndromes report [Autosaved]
EEG & Epilepsy syndromes report [Autosaved]EEG & Epilepsy syndromes report [Autosaved]
EEG & Epilepsy syndromes report [Autosaved]
 
Presentation EEG (1).pptx
Presentation EEG (1).pptxPresentation EEG (1).pptx
Presentation EEG (1).pptx
 
Electroencephalogram(EEG)
Electroencephalogram(EEG)Electroencephalogram(EEG)
Electroencephalogram(EEG)
 

Recently uploaded

Advanced Views - Calendar View in Odoo 17
Advanced Views - Calendar View in Odoo 17Advanced Views - Calendar View in Odoo 17
Advanced Views - Calendar View in Odoo 17Celine George
 
Measures of Dispersion and Variability: Range, QD, AD and SD
Measures of Dispersion and Variability: Range, QD, AD and SDMeasures of Dispersion and Variability: Range, QD, AD and SD
Measures of Dispersion and Variability: Range, QD, AD and SDThiyagu K
 
A Critique of the Proposed National Education Policy Reform
A Critique of the Proposed National Education Policy ReformA Critique of the Proposed National Education Policy Reform
A Critique of the Proposed National Education Policy ReformChameera Dedduwage
 
social pharmacy d-pharm 1st year by Pragati K. Mahajan
social pharmacy d-pharm 1st year by Pragati K. Mahajansocial pharmacy d-pharm 1st year by Pragati K. Mahajan
social pharmacy d-pharm 1st year by Pragati K. Mahajanpragatimahajan3
 
Sports & Fitness Value Added Course FY..
Sports & Fitness Value Added Course FY..Sports & Fitness Value Added Course FY..
Sports & Fitness Value Added Course FY..Disha Kariya
 
Separation of Lanthanides/ Lanthanides and Actinides
Separation of Lanthanides/ Lanthanides and ActinidesSeparation of Lanthanides/ Lanthanides and Actinides
Separation of Lanthanides/ Lanthanides and ActinidesFatimaKhan178732
 
BAG TECHNIQUE Bag technique-a tool making use of public health bag through wh...
BAG TECHNIQUE Bag technique-a tool making use of public health bag through wh...BAG TECHNIQUE Bag technique-a tool making use of public health bag through wh...
BAG TECHNIQUE Bag technique-a tool making use of public health bag through wh...Sapna Thakur
 
Z Score,T Score, Percential Rank and Box Plot Graph
Z Score,T Score, Percential Rank and Box Plot GraphZ Score,T Score, Percential Rank and Box Plot Graph
Z Score,T Score, Percential Rank and Box Plot GraphThiyagu K
 
9548086042 for call girls in Indira Nagar with room service
9548086042  for call girls in Indira Nagar  with room service9548086042  for call girls in Indira Nagar  with room service
9548086042 for call girls in Indira Nagar with room servicediscovermytutordmt
 
Organic Name Reactions for the students and aspirants of Chemistry12th.pptx
Organic Name Reactions  for the students and aspirants of Chemistry12th.pptxOrganic Name Reactions  for the students and aspirants of Chemistry12th.pptx
Organic Name Reactions for the students and aspirants of Chemistry12th.pptxVS Mahajan Coaching Centre
 
Arihant handbook biology for class 11 .pdf
Arihant handbook biology for class 11 .pdfArihant handbook biology for class 11 .pdf
Arihant handbook biology for class 11 .pdfchloefrazer622
 
Disha NEET Physics Guide for classes 11 and 12.pdf
Disha NEET Physics Guide for classes 11 and 12.pdfDisha NEET Physics Guide for classes 11 and 12.pdf
Disha NEET Physics Guide for classes 11 and 12.pdfchloefrazer622
 
The byproduct of sericulture in different industries.pptx
The byproduct of sericulture in different industries.pptxThe byproduct of sericulture in different industries.pptx
The byproduct of sericulture in different industries.pptxShobhayan Kirtania
 
Mastering the Unannounced Regulatory Inspection
Mastering the Unannounced Regulatory InspectionMastering the Unannounced Regulatory Inspection
Mastering the Unannounced Regulatory InspectionSafetyChain Software
 
Activity 01 - Artificial Culture (1).pdf
Activity 01 - Artificial Culture (1).pdfActivity 01 - Artificial Culture (1).pdf
Activity 01 - Artificial Culture (1).pdfciinovamais
 
Beyond the EU: DORA and NIS 2 Directive's Global Impact
Beyond the EU: DORA and NIS 2 Directive's Global ImpactBeyond the EU: DORA and NIS 2 Directive's Global Impact
Beyond the EU: DORA and NIS 2 Directive's Global ImpactPECB
 
Student login on Anyboli platform.helpin
Student login on Anyboli platform.helpinStudent login on Anyboli platform.helpin
Student login on Anyboli platform.helpinRaunakKeshri1
 

Recently uploaded (20)

Advanced Views - Calendar View in Odoo 17
Advanced Views - Calendar View in Odoo 17Advanced Views - Calendar View in Odoo 17
Advanced Views - Calendar View in Odoo 17
 
Measures of Dispersion and Variability: Range, QD, AD and SD
Measures of Dispersion and Variability: Range, QD, AD and SDMeasures of Dispersion and Variability: Range, QD, AD and SD
Measures of Dispersion and Variability: Range, QD, AD and SD
 
Mattingly "AI & Prompt Design: The Basics of Prompt Design"
Mattingly "AI & Prompt Design: The Basics of Prompt Design"Mattingly "AI & Prompt Design: The Basics of Prompt Design"
Mattingly "AI & Prompt Design: The Basics of Prompt Design"
 
A Critique of the Proposed National Education Policy Reform
A Critique of the Proposed National Education Policy ReformA Critique of the Proposed National Education Policy Reform
A Critique of the Proposed National Education Policy Reform
 
social pharmacy d-pharm 1st year by Pragati K. Mahajan
social pharmacy d-pharm 1st year by Pragati K. Mahajansocial pharmacy d-pharm 1st year by Pragati K. Mahajan
social pharmacy d-pharm 1st year by Pragati K. Mahajan
 
Sports & Fitness Value Added Course FY..
Sports & Fitness Value Added Course FY..Sports & Fitness Value Added Course FY..
Sports & Fitness Value Added Course FY..
 
Separation of Lanthanides/ Lanthanides and Actinides
Separation of Lanthanides/ Lanthanides and ActinidesSeparation of Lanthanides/ Lanthanides and Actinides
Separation of Lanthanides/ Lanthanides and Actinides
 
Advance Mobile Application Development class 07
Advance Mobile Application Development class 07Advance Mobile Application Development class 07
Advance Mobile Application Development class 07
 
BAG TECHNIQUE Bag technique-a tool making use of public health bag through wh...
BAG TECHNIQUE Bag technique-a tool making use of public health bag through wh...BAG TECHNIQUE Bag technique-a tool making use of public health bag through wh...
BAG TECHNIQUE Bag technique-a tool making use of public health bag through wh...
 
Z Score,T Score, Percential Rank and Box Plot Graph
Z Score,T Score, Percential Rank and Box Plot GraphZ Score,T Score, Percential Rank and Box Plot Graph
Z Score,T Score, Percential Rank and Box Plot Graph
 
9548086042 for call girls in Indira Nagar with room service
9548086042  for call girls in Indira Nagar  with room service9548086042  for call girls in Indira Nagar  with room service
9548086042 for call girls in Indira Nagar with room service
 
Organic Name Reactions for the students and aspirants of Chemistry12th.pptx
Organic Name Reactions  for the students and aspirants of Chemistry12th.pptxOrganic Name Reactions  for the students and aspirants of Chemistry12th.pptx
Organic Name Reactions for the students and aspirants of Chemistry12th.pptx
 
Arihant handbook biology for class 11 .pdf
Arihant handbook biology for class 11 .pdfArihant handbook biology for class 11 .pdf
Arihant handbook biology for class 11 .pdf
 
Disha NEET Physics Guide for classes 11 and 12.pdf
Disha NEET Physics Guide for classes 11 and 12.pdfDisha NEET Physics Guide for classes 11 and 12.pdf
Disha NEET Physics Guide for classes 11 and 12.pdf
 
INDIA QUIZ 2024 RLAC DELHI UNIVERSITY.pptx
INDIA QUIZ 2024 RLAC DELHI UNIVERSITY.pptxINDIA QUIZ 2024 RLAC DELHI UNIVERSITY.pptx
INDIA QUIZ 2024 RLAC DELHI UNIVERSITY.pptx
 
The byproduct of sericulture in different industries.pptx
The byproduct of sericulture in different industries.pptxThe byproduct of sericulture in different industries.pptx
The byproduct of sericulture in different industries.pptx
 
Mastering the Unannounced Regulatory Inspection
Mastering the Unannounced Regulatory InspectionMastering the Unannounced Regulatory Inspection
Mastering the Unannounced Regulatory Inspection
 
Activity 01 - Artificial Culture (1).pdf
Activity 01 - Artificial Culture (1).pdfActivity 01 - Artificial Culture (1).pdf
Activity 01 - Artificial Culture (1).pdf
 
Beyond the EU: DORA and NIS 2 Directive's Global Impact
Beyond the EU: DORA and NIS 2 Directive's Global ImpactBeyond the EU: DORA and NIS 2 Directive's Global Impact
Beyond the EU: DORA and NIS 2 Directive's Global Impact
 
Student login on Anyboli platform.helpin
Student login on Anyboli platform.helpinStudent login on Anyboli platform.helpin
Student login on Anyboli platform.helpin
 

Algamantas juozapavcius

  • 1. Nonlinear Analysis: Modelling and Control, 2011, Vol. 16, No. 4, 375–386 375 EEG analysis – automatic spike detection Algimantas Juozapaviˇciusa , Gytis Baceviˇciusa , Dmitrijus Bugelskisa , R¯uta Samaitien˙eb a Faculty of Mathematics and Informatics, Vilnius University Naugarduko str. 24, LT-03225 Vilnius, Lithuania algimantas.juozapavicius@mif.vu.lt; gytis.bacevicius@mif.stud.vu.lt b Vilnius University Children Hospital, Centre of Pediatrics Santariškiu˛ str. 7, LT-08406 Vilnius, Lithuania samaitiene@yahoo.com Received: 21 January 2011 / Revised: 24 November 2011 / Published online: 7 December 2011 Abstract. In the diagnosis and treatment of epilepsy, an electroencephalography (EEG) is one of the main tools. However visual inspection of EEG is very time consuming. Automatic extraction of important EEG features saves not only a lot of time for neurologist, but also enables a whole new level for EEG analysis, by using data mining methods. In this work we present and analyse methods to extract some of these features of EEG – drowsiness score and centrotemporal spikes. For spike detection, a method based on morphological filters is used. Also a database design is proposed in order to allow easy EEG analysis and provide data accessibility for data mining algorithms developed in the future. Keywords: electroencephalogram, rolandic epilepsy, epileptic spikes, morphological filters, analysis. 1 Introduction Electroencephalography (EEG) is a widely used medical technique, for monitoring elec- trical brain’s activity produced by neurons. Technically an EEG consists of multiple channels that monitor neurons’ activities in a region, each channel represent an electrode on a patient’s scalp. Epilepsy is a neurological disorder manifesting in uncontrolled seizures. These sei- zures lead to a discharge in the brain, generating a disturbance in the EEG. The analysis of EEG looking for these spikes over background activity is the main method of epilepsy diagnosis and treatment. A regular EEG can have from up to 20 electrodes and last more than an hour [1]. Currently visual methods are used for this analysis, qualified doctors visually inspect the whole EEG. This is a very time consuming task. To improve EEG analysis automatic tools are required. The most time consuming task in EEG analysis is spike detection. For this purpose many algorithms were suggested. The most recent overview of such algorithms is given c Vilnius University, 2011
  • 2. 376 A. Juozapaviˇcius et al. in [2], providing numerous list of most essential approaches to spike detection and to anal- ysis of their performance. However the author concentrates on algorithms performance measurement and comparison, by using combination of statistical parameters, however he gives almost no mathematical formulations. According to performance reported in this article as well as results of review in the article [3], we decided to experiment with mimetic algorithms, combining with template matching. Therefore an automatic method based on morphological filter is presented in this work. Main purpose of this investigation is to develop and evaluate the mathematical/logical architecture of such approach. The filter developed was used on data provided by Vilnius University Children’s Hospital. The filter was found to be susceptible to high frequency noise. To solve this problem a finite response filter was used. Also two filters based on spike definition are introduced to improve the results: spike rejection based on length as well as on neighbourhood. The resulting filter detect all known spikes in the provided data, but it turned out to be susceptible to events of noise such as eye movement. Epileptic spikes are precipitated by sleep. Therefore an important factor in EEG analy- sis is a person drowsiness. A method widely used for measuring drowsiness is Karolinska drowsiness score (KDS) [4]. This score is usually calculated by hand, however can be easily implemented for computer detection. This method is described in this work. Un- fortunately KDS is not always accurate. These and a lot of other EEG feature extraction methods can be combined to provide additional data in epilepsy diagnosis. Moreover they can be used with data mining al- gorithms to extract additional information, for example a new more accurate drowsiness score. For this reason a system to access and store EEG features is required. In this work we present a document based database design. It provides storage with the possibility to add additional extracted EEG features as they become available as well as ease of access to them. 2 Electroencephalography (EEG) EEG is the recording of electrical activity along the scalp produced by the firing of neurons within the brain [5]. EEG was discovered by the German psychiatrist, Hans Berger, in 1929. Electrical activity recorded by electrodes placed on the scalp mostly reflects summation of excita- tory and inhibitory postsynaptic potentials in apical dendrites of pyramidal neurons in the more superficial layers of the cortex. Quite large areas of cortex – in the order of a few square centimeters – have to be activated synchronously to generate enough potential for changes to be registered at electrodes placed on the scalp [6] EEG plays a central role in diagnosis and management of patients with seizure disorders. Routine EEG is used in the following clinical circumstances: • Epilepsy (to determine epileptic activity, epileptic focus, to diagnose epileptic syn- drome). • To distinguish epileptic seizures from other types of spells. www.mii.lt/NA
  • 3. EEG analysis – automatic spike detection 377 • To differentiate encephalopathy, neurodegenerative disorders, to evaluate comatose patients. • To serve as an adjunct test of brain death. 2.1 Brain rhythms The frequency of brain waves can differ based on the state of the person being monitored. These brain waves are categorised into 5 brain rhythms based on their frequency [5]: • Delta rhythm. 3.5 Hz or lower. Detected during deep sleep. • Alfa rhythm. 8–12 Hz. Detected during relaxation, especially with eyes closed. • Beta rhythm. 12–30 Hz. Detected during active thinking or high concentration. • Teta rhythm. 3–7.5 Hz. Correlates with drowsiness and agitation. • Gama rhythm. 30 Hz or higher. Rare occurence. 2.2 Electrode location by the international 10–20 system This system ensures that the naming of electrodes is consistent across EEG laboratories. In most clinical applications, 19 recording electrodes (plus ground and system reference) are used. The modified combined nomenclature derived from the 10–20 system should be used for electrode location [5]. Before recording electrodes are placed on the scalp with a conductive gel or paste, usually after preparing the scalp area by light abrasion to reduce impedance. A routine EEG should (at least) include bipolar montages with longitudinal and transverse chains. These chains should be used with equal electrode distances and side-to-side symmetry to avoid the artifact of false amplitude asymmetry [7]. 3 Epilepsy Epilepsy is the tendency to experience repeated seizures, which stem from activity orig- inating in the brain [8]. The seizures happen because of abnormal, excessive or syn- chronous neuronal activity in the brain. People may have strange sensations and emo- tions or behave strangely. They may have violent muscle spasms or lose consciousness. Epilepsy has many possible causes. It could be illness, brain injury and abnormal brain development. In many cases, the cause is unknown. There are over 40 different types of epilepsy. 3.1 Benign epilepsy of childhood with centrotemporal spikes (rolandic epilepsy) Benign epilepsy of childhood with centrotemporal spikes is the most common focal epi- lepsy in childhood. This disorder is also called rolandic epilepsy. Loiseau and Duche provided five criteria for the diagnosis of benign childhood epi- lepsy with centrotemporal spikes: 1) onset between the ages of 2 and 13; 2) absence of Nonlinear Anal. Model. Control, 2011, Vol. 16, No. 4, 375–386
  • 4. 378 A. Juozapaviˇcius et al. neurologic or intellectual deficit before the onset; 3) partial seizures with motor signs, frequently associated with somatosensory symptoms or precipitated by sleep; 4) a spike focus located in the centrotemporal (rolandic) area with normal background activity on the interictal EEG; and 5) spontaneous remission during adolescence [7]. Rolandic epilepsy can start as early as 1 year of age or as late as 15 years of age, but mostly it have onset of seizure between 7 and 10 years. Boys are more often affected, with a ratio of 3:2. 3.2 Centrotemporal spikes The cornerstone of the diagnosis of benign childhood epilepsy with centrotemporal spikes lies in the characteristic interictal EEG pattern: centrotemporal spikes on normal back- ground activity. The centrotemporal spikes are typically seen independently on both sides of the head. Despite their name, these are usually high amplitude sharp and slow wave complexes localized to the central (C3/C4) electrodes or midway between the central and temporal electrodes (C5/C6). They are broad, diphasic, high-voltage (100-microvolts to 300-microvolts) spikes, with a transverse dipole, and they are often followed by a slow wave. The spikes may occur isolated or in clusters, with a rhythm of about 1.5 Hz to 3 Hz [7] Sharp and slow wave complexes in areas outside the centrotemporal regions, such as occipital, parietal, frontal, and midline regions, may occur concurrently with centrotemporal spikes. They are of similar morphology to centrotemporal spikes. Normal sleep architecture is preserved. Sometimes the generalized spikes could be found [9]. The spikes retain the same morphology in spite of change in state of vigilance but the number of spikes is highly activated by sleep. So it is a good model for automatic spike detection. The main characteristics of centrotemporal spikes in rolandic epilepsy are: • Length of 40–200 ms. • Amplitude two times higher then that of the base line. • Usually in C4/C3 or C5/C6 electrodes. • Must be detected in at least two neighbouring electrodes. 4 Database design To reduce time needed to develop EEG analysis algorithms and to allow large scale data processing, an efficient database was needed. The main requirements for this database are: • Store EEG signals and allow fast access to them. • Allow algorithms to store data related to an EEG signal (KDS, spikes, etc.), which might later be used in advanced analysis such as data mining algorithms. • Should be very scalable, since the number of EEG signals can be quite large. www.mii.lt/NA
  • 5. EEG analysis – automatic spike detection 379 4.1 Database management system Traditional relational database management systems (RDBMS) were found to be slow and not flexible enough for the given task. The analysis of EEG requires the ability for new data types to be added as they become available (such as KDS, spike locations and etc.). RDBMS systems require a scheme to be defined and altering it is very costly. Therefore schema-less object databases were used. Schema-less allow more flexible ways to define data types and require almost no time needed for the setup. MongoDB1 was found most fit for the given task. MongoDB’s MapReduce framework also provides an efficient way to distribute data processing over a large amount of computer nodes, which does shorten the time needed to process large amounts of EEG data. 4.2 Data Our datasets are EEG records, approximately 1 hour long each. Each record contains recorded data over 20 or even more EEG and non-EEG channels, such as EKG. It was chosen to subdivide the EEG records to 30 s intervals. This length was chosen since it is the time interval usually analyzed by doctors, also it provides enough data for simple analysis (KDS, spike detection, etc.) while still being small enough to be processed efficiently. Each interval is stored in a document. Along with the signal itself meta-data, such as sampling rate, length and patient information is stored. A tag property is used to identify which algorithms have been applied to this EEG. Each database element is a document, therefore it is very easy to add additional data such as spike information or KDS. The analysis algorithm only needs to add a new property representing the data to the document and add its name to the tag property. By using the tag property it can be easily distinguished which documents have additional data calculated by analysis algorithms. During the analysis of KDS and spike detection algorithms this database design proved it self to be very efficient and flexible to work with. 5 EEG data analysis In this section a method to calculate Karolinska drowsiness scale will be discussed. 5.1 Brain rhythm calculation To calculate brain rhythms a discrete Fourier (DFT) transformation is used: N−1 n=0 xn sin − 2π N kn + i cos − 2π N kn k = 0, . . . , N − 1. 1MongoDB – http://www.mongodb.org/ Nonlinear Anal. Model. Control, 2011, Vol. 16, No. 4, 375–386
  • 6. 380 A. Juozapaviˇcius et al. as well as the inverse discrete Fourier transformation (IDFT): xn = 1 N N−1 k=0 Xke(2πi/N)kn n = 0, . . . , N − 1. To calculate the required brain rhythm DFT is applied over the signal. All the frequencies not corresponding to the required rhythm are set to zero. IDFT is applied over the resulting data. After filtering out all the waves except the required rhythm we can calculate its power. To do this we use a statistical value – root mean square. Which is defined as: RMS = x2 0 + x2 1 + . . . = y2 N−1 N Here x is value of the signal at a discrete time. For every interval of EEG all of the brain rhythms and their powers are calculated. Out of these a rhythm is said to be dominant in an interval if its power is the highest. 5.2 Karolinska drowsiness scale Karolinska drowsiness scale (KDS) [4] is an objective method to calculate the drowsiness of a person based on an 20–30 s EEG interval. The scale assigns a score from 1 (com- pletely awake) to 9 (very drowsy) to a EEG interval according to a persons drowsiness. The score is calculated as follows: Input: an EEG interval I Output: KDS score BEGIN Split I into 10 subintervals in. Calculate the dominant brain rhythm for every in. If 3 or more in have theta as the dominant rhythm the person is asleep, return 10. Else return the number of times alpha is the dominant rhythm in in. END 6 Automatic spike detection Due to the need of an automatic spike detection method in electroencephalograms there are a few algorithms [3] proposed. One of the most reliable of these is an algorithm based on mathematical morphology. This method is shown to be accurate on 91.62% of centrotemporal spikes [10]. Due to this high reliability morphological filtering was chosen for automatic spike detection. www.mii.lt/NA
  • 7. EEG analysis – automatic spike detection 381 6.1 Morphological operations In this section we give a short explanation of mathematical morphology used in the filter. In the filter two main operations are used erosion and dilation. These two operations are also called Minkowski addition and subtraction respectively [10]. Let’s say f(t) is a time series of time t (i.e. a single EEG channel) and g(t) is a function defining a structural element. Then gs (t) is defined as a reflection of g(t), gs (t) = g(−t). D is the domain of f(t). Then we can define: Erosion f gs (t) = min τ∈D f(τ) − g − (t − τ) ; Dilation: f ⊕ gs (t) = max τ∈D f(τ) + g − (t − τ) . Using these operations we can define two new operators [10]. Opening operation: (f ◦ g)(t) = f gs ⊕ g (t); Closing operation: (f • g)(t) = f ⊕ gs g (t). The opening operation smoothes f(t) from below by cutting of its spikes, while closing smoothes the function from above by filling up valleys between spikes. Therefore opening and closing can be used to detect spikes and valleys in function f(t). 6.2 Morphological operation combination Centrotemporal spikes can have both positive and negative amplitudes. Since the closing and opening operations can detect spikes of only positive or negative amplitude, two additional operators need to be defined: Close-opening [10]: CO f(t) = f(t) • g1(t) ◦ g2(t); Open-closing: OC f(t) = f(t) • g1(t) ◦ g2(t). Here g1(t) and g2(t) are two distinct structural elements. Both of these operations distort the amplitude of the function. Open-closing has a lower amplitude while close-opening has a higher amplitude. These distortions can cause false positive identifications or hide centrotemporal spikes. The effect of these operations is opposite to each other. Therefore their average can be used instead [10]: OCCO (f)t = OC(f(t)) + CO(f(t)) 2 . Nonlinear Anal. Model. Control, 2011, Vol. 16, No. 4, 375–386
  • 8. 382 A. Juozapaviˇcius et al. 6.3 Structural element In order to distinguish between background activity and centrotemporal spikes a structur- ing element is needed. This element needs to fit in regular EEG waves but not into spikes. An element that matches the morphology of a single EEG wave is a parabola. Therefore the two parabola shaped structuring elements are defined [11]: gi(t) = ait2 + bi, i = 1, 2. Parameters a and b control the width and amplitude of the parabola. Since the width and amplitude of an EEG signal varies depending on a variety of factors, it is impossible to select a set of values that match every interval of a patient’s EEG. Therefore each structuring element must be fitted to a small time frame of a single EEG channel. Another reason for this approach is that doctors detect centrotemporal spikes by their neighbouring data. Let us define widths as an array where the width of arcs is defined. The width of an arc is the distance between two extrema (min or max) in f(t). |f| – an array of amplitudes of the signal f(t). Then the width wi and height hi of structural elements gi can be calculated as: h1 = median |f| , h2 = 2 ∗ median |f| , w1 = 0.5 ∗ median(widths), w2 = 1.5 ∗ median(widths). The structuring element g1(t) is applied to the original signal and needs to fit the waves of the original. The second structuring element g2(t) is applied over a signal modified by a closing or opening operation therefore the values need to be increased. When the width and height of the parabolas is known, parameters ai and bi can be calculated as: b1 = median |f| , b2 = median |f| , a1 = median(|f|) 0.5 ∗ median(widths) , a2 = median(|f|) 1.5 ∗ median(widths) . 6.4 Application After fitting the structural element, the morphological filter can be applied: x(t) = f(t) − OCCO f(t) . The resulting signal x(t) will have its background activity diminished, while the spikes will be exposed. To identify the centrotemporal spikes, a threshold needs to be defined. www.mii.lt/NA
  • 9. EEG analysis – automatic spike detection 383 This threshold is the limit which needs to be exceeded in order for a spike to be considered a sign of epilepsy [11]: Thr = 8 ∗ median extrema x(t) . Here the function extrema(x(t)) is defined as the amplitude of x(t) extrema. 6.5 Finite impulse response filter After applying the morphological filter over real life data it can be seen that it is very susceptible to high frequency noise. To remedy this problem a finite impulse response filter (FIR), based on finite impulse response, can be applied over the EEG signal. FIR is a discrete time filter whose impulse response is finite – it settles to zero in a finite number of steps. It is low-pass filter, which means that it only adjusts signals higher than the cut off frequency. FIR is defined by a difference equation [12]: y[n] = b0[n] + b1[n − 1] + . . . + bN x[n − N] where x[n] is the input signal, y[n] is the output signal, bi are the filter coefficients and N is the order of the filter g. 7 Filter tests on real life data The morphological filter was applied on data provided by Vilnius University Children’s Hospital. The data included 15 EEGs of children with Rolandic epilepsy. Each EEG was around an hour long and included signals gatthered by electrodes placed in the 10–20 system. For the tests the previously described threshold was used. While the filter worked on some of data, on other it returned spikes on every extrema. This was due to a 35 Hz noise distorting the orignal signal. The 35 Hz noise is of neurophysiological origin. Due to noise the threshold would be set very close to 0. This problem was solved by applying a FIR filter with a cutoff frequency of 35 Hz. Since the length of a centrotemporal spike is 40–200 ms it did not affect the detection of spikes in any other way. Test results showed that a 64th degree FIR filter was enough to process the signal while not incurring a large performance penalty. Unfortunately the FIR filter also caused the morphological filter to identify false positive spikes in noisy regions. Especially electrodes F7 and F8 during eye movement. The morphological filter can not handle noisy signals therefore a different algorithm should be used to identify or correct these intervals. Another approach to filter out the 35 Hz noise is to change the threshold to: Thr = 8 ∗ average |extrema| . While this does solve the problem it also causes a lot of false negatives. After testing the threshold with average and median as well as adjusting the multiplication constant it was Nonlinear Anal. Model. Control, 2011, Vol. 16, No. 4, 375–386
  • 10. 384 A. Juozapaviˇcius et al. observed that a combination of the FIR filter and a threshold with a median produced the best results. The method described produced good results. However some identified spikes where a lot shorter than the definition of an centrotemporal spike. By definition the spike should be 40–200 ms long. Therefore another filter was applied which rejected spikes based on their length. This filter decreased the number of identified spikes by 12,53%, all of them false positives. A centrotemporal spike is defined as occurring in at least two neighbouring electrodes. After analysing the data processed by the morphological filter it was noticed that a lot of the spikes occurred only in one channel. Therefore a method to reject single spikes needed to be defined. This algorithm uses a graph of electrode positioning according to the 10–20 system. Input: A list of detected spikes L A graph of electrode placement G Output: Clusters of neighbouring spikes BEGIN Split L into sublists ln, where ln contains spikes where each spike is in a 20 ms window to another spikein ln. Split each ln into subgroups lnn, where each spike in ln is either a neighbour or a transitive neighbour to all other spikes in nln according to G. Remove lnn elements with only one spike. Present the remaining list of lnn. END 7.1 Results The resulting filter recognised all of the known epileptic spikes in clear signals. Unfortu- nately it also recognised spikes not related to epilepsy and detected a lot of false positives in noisy areas. Detecting epileptic spikes in noisy signals is extremely hard or impossible even for trained doctors. Therefore a method for detecting noisy areas and rejecting them is required. Such a method is not discussed in this work. 8 Conclusion In this work we analyzed methods for EEG analysis. Methods for spike detection and KDS calculations were analyzed. The database design to store EEG data was proposed. The centrotemporal spike detection filter detected all known spikes in EEG signals. Unfortunately the filter does not function in noisy areas. To solve this problem a algo- rithm should developed to recognise and exclude noisy areas. The current filter also only recognises spikes and does not classify according to other features of morphology, such as a spike-slow wave complex. In the future a methodology for analysing spike shapes www.mii.lt/NA
  • 11. EEG analysis – automatic spike detection 385 should be added. This analysis could also provide the ability to separate spikes caused by epilepsy and normally occurring spikes. Such parameters of the quality of spike detection as sensitivity/specificity/selectivity will be evaluated later, in a future research, as the algorithm developed will be incom- passed into a framework of other methods, essential for better diagnosis support and finer selection of drugs. The algorithms in this article were not tested on any other data except of preselected ones. The KDS algorithm was inserted into the database were it is used to analysis spikes according to drowsiness levels. The suggested database was filled with data provided by Vilnius University Children’s Hospital and used together with the previously described algorithms. In the future it will be used to store information extracted from EEG signals by new algorithms as well as provide accessibility for calculating derivative data. To further advance automatic EEG analysis these work items are planned for the future: • Develop methods for noise detection (i.e. rapid eye movements). • Develop methods for spike classification according to their shape. • Separate spikes caused by epilepsy and naturally occurring spikes. • High level analysis methods (i.e. epilepsy classification, a new drowsiness scale, etc.) References 1. W.O. Tatum, A.M. Husain, S.R. Benbadis, P.W. Kaplan, Handbook of EEG Interpretation, Demos Medical Publishing, 2007. 2. J. Halford, Computerized epileptiform transient detection in the scalp electroencephalogram: Obstacles to progress and the example of computerized ECG interpretation, Clinical Neuro- physiology, 120, pp. 1909–1915, 2009. 3. S.B. Wilson, R. Emerson, Spike detection: A review and comparison of algorithms, Clinical Neurophysiology, 113, pp. 1873–1881, 2002. 4. A. Anund, G. Kecklund, A. Vadeby, M. Hjälmdahl, T. Åkerstedt, The alerting effect of hitting a rumble strip – a simulator study with sleepy drivers, Accident Analysis and Prevention, 40(6), pp. 1970–1976, 2008. 5. E. Niedermeyer, F.H.L. Da Silva, Electroencephalography: Basic Principles, Clinical Applica- tions, and Related Fields, Lippincott Williams & Wilkins, 2004. 6. SJM Smith, EEG in the diagnosis, classification, and management of patients with epilepsy, Journal of Neurology, Neurosurgery, and Psychiatry, 76(Suppl. 2), 2005. 7. Commission on classification and terminology of the international league against epilepsy. Proposal for revised classification of epilepsies and epileptic syndromes, Epilepsia, 30(4), pp. 389–399, 1989. Nonlinear Anal. Model. Control, 2011, Vol. 16, No. 4, 375–386
  • 12. 386 A. Juozapaviˇcius et al. 8. A.T. Berg et al., Revised terminology and concepts for organization of seizures and epilepsies: Report of the ILAE Commission on Classification and Terminology, Epilepsia, 51(4), pp. 676– 685, 2010. 9. J.M. Pellock, W.E. Dodson, B.F.D. Bourgeois, Pediatric Epilepsy: Diagnosis and Therapy, Demos Medical Publishing, 2008. 10. G. Xu, J. Wang, Q. Zhang, J. Zhu, An automatic EEG spike detection algorithm using morphological filter, in: Proceeding of the 2006 IEEE International Conference on Automation Science and Engineering Shanghai, China, October 7–10, 2006, pp. 170–175. 11. M. Kazakeviˇciut˙e, A. Juozapaviˇcius, R. Samaitien˙e, Morphological filtering of eeg, Materials Physics and Mechanics, 9, pp. 185–193, 2010. 12. S.J. Orfanidis, Introduction to Signal Processing, Prentice Hall, 1996. www.mii.lt/NA