SlideShare a Scribd company logo
Anna University, Chennai 600 025
ANNA UNIVERSITY: CHENNAI -600 025
B.E/B.TECH DEGREE EXAMINATIONS NOV/DEC 2014
(B.E. ELECTRICAL AND ELECTRONICS ENGINEERING)
SEVENTH SEMESTER
REGULATIONS : R-2008
EE2404- Power System Simulation Laboratory
Time 3 Hours Max: 100 Marks
1. A three phase transmission line has a per phase series impedance of 0.05 0.7 Ω
km
and per phase shunt admittance of 7 10 siemens
km. The line is 250 km long.
Obtain ABCD parameters of the transmission line. The line is sending 400 and 8
at 350 kV. Use medium T model.
a) Determine the value of .
b) Determine the voltage and current at receiving end and also compute voltage regulation and
efficiency
c) Verify the results using available program.
Aim & Circuit
diagram of T model
(15)
Manual
Calculation
(35)
Program
(30)
Results
(10)
Viva-
voce
(10)
Total
(100)
2. A three phase transposed line composed of one ACSR, 143000 , 47 7⁄ Bobolink
conductors per phase with flat horizontal spacing of 11 between phases A and B, between
phases B and C. The conductors have a diameter of 4 cm and a geometric mean radius of 2
. The line is to be replaced by a three conductor bundle of ACSR, 477000
, 26 7⁄ Hawk conductors having the same cross sectional area of aluminum as the single
conductor line. The conductors have a diameter of 2.3 cm and a geometric mean radius of 1
cm. The new line will also have flat horizontal configuration, but it is to be operated at a
higher voltage and therefore the spacing is increased to 13 as measured from the center of
the bundles. The spacing between the conductors in the bundle is 40 .
a) Determine the capacitance and inductance per phase per km of the above two lines.
b) Determine the percentage change in inductance and capacitance in the bundle conductor
system
c) Verify the results using available program.
Aim & Circuit diagram
(15)
Manual
Calculation (30)
Program
(35)
Results
(10)
Viva-voce
(10)
Total
(100)
1  2
3  4
100 km
120 km
100 km 110 km  150 km
3. A Four bus system is shown in figure 3.1.
Figure 3.1 Four Bus System
All transmission lines are characterized by a series impedance of 0.1 0.7 Ω
km and a shunt
admittance of 0.35 10 mho
km. Lines are rated at 220 kV. Use the values of 220 kV and
100 as base values.
a) Express impedances and admittances in per unit.
b) Compute the bus admittance matrix.
c) Verify the results with the available program.
Aim
(10)
Manual
Calculation (35)
Program
(35)
Results
(10)
Viva-voce
(10)
Total
(100)
1  2
3  4
4. The figure 4.1 shows the one line diagram of a four bus system. Table 4.1 gives the
transmission line data of the system shown in figure 4.1.
Figure 4.1 Four bus System
Table 4.1 Transmission line data for the four bus system
Line ID Sending
Bus
Receiving
Bus
Resistance
in per unit
Reactance
in per unit
Half line charging
susceptance in per
unit
Rating
MVA
1 1 3 0.05 0.15 0 55
2 1 4 0.10 0.30 0 65
3 3 4 0.15 0.45 0 45
4 2 4 0.10 0.30 0 40
5 1 2 0.05 0.15 0 55
a) Compute bus admittance matrix assuming the line shown dotted is not connected.
b) What modification needs to be carried out to bus admittance matrix if the line shown dotted is
connected?
c) Verify the results with the available program.
Aim
(10)
Manual
Calculation (35)
Program
(35)
Results
(10)
Viva-voce
(10)
Total
(100)
5) For the system shown in figure 5.1 compute the bus impedance matrix using Z-bus building
algorithm. Neglect the resistance of the lines and the reactances of the lines are indicated in
per unit in figure 5.1 on a 100 MVA base.
Figure 5.1. Three bus system
Aim
(10)
Manual
Calculation (35)
Program
(35)
Results
(10)
Viva-voce
(10)
Total
(100)
1  2
3 
0.1j 
0.1j  0.1j 
0.25j 0.25j 
6) For the three bus system shown in figure 6.1 the relevant per unit line admittances on 100
MVA base are indicated on the diagram. Form bus admittance matrix and determine the
voltage at bus 2 and bus 3 after the second iteration using Gauss Siedel method. Assume
acceleration factor as 1.6. Use available software and print the output of the load flow
problem. Using the voltage solution of the converged power flow obtained from the available
program compute the sending end and receiving end line flow in each of the transmission line.
Solve the power flow problem using the available program for different value of acceleration
factors and plot the convergence characteristics.
Fig 6.1 Three bus System
Aim
(10)
Manual
Calculation (35)
Program
(35)
Convergence
Plot (5)
Results
(5)
Viva-voce
(10)
Total
(100)
Slack 
Generator  ‐j5 mho
‐j3 mho
‐j4 mho
1  2
3
60MW+j30MVAR
50MW+j25MVAR 
25MW+j15MVAR
V1=1.02 p.u 
7. For the three bus system shown in figure 7.1 the relevant per unit line admittances on 100
MVA base are indicated on the diagram. Form bus admittance matrix and determine the
voltage at bus 2 and bus 3 after the second iteration using Gauss Siedel method. Assume
acceleration factor as 1.6. Use available software and print the output of the load flow
problem. Using the voltage solution of the converged power flow obtained from the available
program compute the sending end and receiving end line flow in each of the transmission line.
Solve the power flow problem using the available program for different value of acceleration
factors and plot the convergence characteristics.
Fig 7.1 Three bus System
Aim
(10)
Manual
Calculation (35)
Program
(35)
Convergence
Plot (5)
Results
(5)
Viva-voce
(10)
Total
(100)
Slack 
Generator  ‐j3 mho
‐j4 mho
‐j5 mho
1  2
3
50MW+j20MVAR
30MW+j5MVAR 
25MW+j15MVAR
V1=1.03 p.u
8. For the power system shown in figure 8.1
(i) Perform two iteration of N-R method using flat start and obtain the complex voltage
at bus 2.
(ii) Using the solution determine the real and reactive power mismatch at bus 2
(iii) Compute real and reactive power flow in the transmission line
(iv) Compute the line losses
(v) Obtain the slack bus generation
(vi) Verify the results with available software.
Figure 8.1 Two bus system
Aim
(10)
Manual
Calculation (35)
Program
(35)
Results
(10)
Viva-voce
(10)
Total
(100)
2
0.02+j0.06 p.u Slack 
Generator 
1 
V1=1.02 p.u 
50 MW 
+j30 MVAR 
150 MW+ 
j90 MVAR 
75 MW 
+j30 MVAR 
j0.03 p.u j0.03 p.u 
9. For the power system shown in figure 9.1
(i) Perform two iteration of N-R method using flat start and obtain the complex voltage
at bus 2.
(ii) Using the solution determine the real and reactive power mismatch at bus 2
(iii) Compute real and reactive power flow in the transmission line
(iv) Compute the line losses
(v) Obtain the slack bus generation
(vi) Verify the results with available software.
Figure 9.1 Two bus system
Aim
(10)
Manual
Calculation (35)
Program
(35)
Results
(10)
Viva-voce
(10)
Total
(100)
2
0.01+j0.05 p.u Slack 
Generator 
1 
V1=1.03 p.u 
50 MW 
+j30 MVAR 
100 MW+ 
J60 MVAR 
75 MW 
+j30 MVAR 
j0.02 p.u j0.02 p.u 
10. For the power system shown in figure 10.1
(i) Perform two iteration of Fast Decoupled Power Flow using flat start and obtain the
complex voltage at bus 2.
(ii) Using the solution determine the real and reactive power mismatch at bus 2
(iii) Compute real and reactive power flow in the transmission line
(iv) Compute the line losses
(v) Obtain the slack bus generation
(vi) Verify the results with available software.
Figure 10.1 Two bus system
Aim
(10)
Manual
Calculation (35)
Program
(35)
Results
(10)
Viva-voce
(10)
Total
(100)
2
0.02+j0.06 p.u Slack 
Generator 
1 
V1=1.02 p.u 
50 MW 
+j30 MVAR 
150 MW+ 
j90 MVAR 
75 MW 
+j30 MVAR 
j0.03 p.u j0.03 p.u 
11. Consider the power system shown in figure 11.1 in which a synchronous generator supplies
a synchronous motor. The motor is operating at rated voltage and rated MVA while drawing
a load current at a power factor of 0.9 (lag) when a three phase symmetrical fault occurs at
its terminals. Calculate the fault current that flow both from the generator and the motor.
Verify the results with the available software.
Figure 11.1 A generator supplying a motor load through a transmission line
Aim
(10)
Manual
Calculation (35)
Program
(35)
Results
(10)
Viva-voce
(10)
Total
(100)
X’’=0.2 p.u. 
50 MVA 
20 kV 
X=0.1 p.u. 
50 MVA 
20 kV/66kV 
X=0.1 p.u. 
50 MVA 
20 kV/66kV 
X’’=0.2 p.u. 
25 MVA 
18 kV 
j10 ohms 
12. Consider the network shown in figure 12.1. For a line to ground fault at bus 2, determine the
fault current and MVA at faulted bus, post fault voltages, fault current distribution in
different elements of the network. Draw a single line diagram showing the above results.
Check the results obtained using available software.
Figure 12.1 Four bus system
: 100 , 20 , ′′
20%; 4%
, : 100 ,
20
345
; 8%
: 15%; 50% 100
: 100 , 20 , ′′
20%; 4%; 5%
Aim
(10)
Manual
Calculation (35)
Program
(35)
Single line
diagram (5)
Results
(5)
Viva-voce
(10)
Total
(100)
13. Consider the system in which generator is connected to an infinite bus through a double
circuit transmission line as shown in figure 13.1. The per unit system reactances that are
converted in a common base, are also shown in figure 13.1. Assume the infinite bus voltage
as 1 0 . . The generator is delivering 1.0 p.u. real power at a lagging power factor of
0.98 to the infinite bus. While the generator is operating in steady state, a three phase bolted
short circuit occurs in the transmission line as shown in figure 13.1 very near to bus 4.
Assume 3.5 ⁄ . The fault is cleared by opening the circuit breakers at
the two ends of the line. Find the critical clearing time.
Figure 13.1 Four bus System
Aim
(10)
Manual
Calculation (35)
Program
(35)
Critical
Clearing time (5)
Results
(5)
Viva-voce
(10)
Total
(100)
14. Consider the system in which generator is connected to an infinite bus through a double
circuit transmission line as shown in figure 14.1. The per unit system reactances that are
converted in a common base, are also shown in figure 14.1. Assume the infinite bus voltage
as 1 0 . . The generator is delivering 1.0 p.u. real power at a lagging power factor of
0.95 to the infinite bus. While the generator is operating in steady state, a three phase bolted
short circuit occurs in the transmission line as shown in figure 14.1 very near to bus 4.
Assume 4 ⁄ . The fault is cleared by opening the circuit breakers at the
two ends of the line. Find the critical clearing time.
Figure 14.1 Four bus System
Aim
(10)
Manual
Calculation (35)
Program
(35)
Critical
Clearing time (5)
Results
(5)
Viva-voce
(10)
Total
(100)
15. It is proposed to simulate using the software available the load frequency dynamics of a
single area power system whose data are given below:
Rated capacity of the area=2000MW
Normal operating load=1000 MW
Nominal Frequency=50Hertz
Inertia constant of the area=5 seconds
Governor droop= 4%
Governor time constant =0.08 Seconds
Turbine time constant=0.3 seconds
Assume linear load frequency characteristics. The area has a governor control but not a load
frequency controller. The area is subjected to a load increase of 20 MW.
a) Simulate the load-frequency dynamics of this area using available software and check the
following
i) Steady State frequency deviation in Hertz. Compare with the manual calculation
ii) Plot the time response of frequency deviation in hertz and change in turbine power in
p.u. MW.
iii) Implement a suitable control to minimize the error.
Aim
(10)
Manual
Calculation (35)
Simulation
(35)
Results
(10)
Viva-voce
(10)
Total
(100)
16. Simulate a load frequency dynamics of a two area power system. Both the areas are identical
and the system parameters are given below.
Rated capacity of the area=2000MW
Normal operating load=1000 MW
Nominal Frequency=50Hertz
Inertia constant of the area=5 seconds
Governor droop= 4%
Governor time constant =0.08 Seconds
Turbine time constant=0.3 seconds
Assume that the tie line has a capacity of 200 MW and is operating at a power angle of thirty
degrees. Assume that both the areas do not have load frequency controller. Area 2 is subjected to
a load increase of 20 MW.
a) Simulate the load-frequency dynamics of this area using available software and check the
following
i) Steady State frequency deviation in Hertz and tie line flow deviation in p.u.MW.
Compare with the manual calculation
ii) Plot the time response of frequency deviation in hertz.
iii) Implement a suitable control to minimize the error.
Aim
(10)
Manual
Calculation (35)
Simulation
(35)
Results
(10)
Viva-voce
(10)
Total
(100)
17. In a four bus system the generating units connected at buses 1 and 2 are supplying a total
demand of 500MW connected at buses 3 and 4. The generating unit 1 and 2 have an
incremental fuel cost in dollars per megawatt hour as given below
0.008 8.0; 0.0096 6.4
Generation limits:
50 500
40 400
Calculate the economic loading of each unit to meet a total customer load of 500 MW. What
is the system and what is the transmission loss of the system? Determine the penalty factor
for each unit and incremental fuel cost at each generating bus. Verify the results with
available software. Also calculate the decrease in production costs of the two plants when the
system load is reduced from 500MW to 430 MW. Assume that the loss coefficients at the
specified load level of 500 MW in per unit on a 100 MVA base are given below
2
2
2 2
8.383 0.049 0.375
0.049 5.963 0.195
0.375 0.195 0.090
10
Aim
(10)
Manual
Calculation (35)
Program
(35)
Results
(10)
Viva-voce
(10)
Total
(100)
18. Determine the economic generation schedule of three generating units in a power system to
meet the system load of 850 MW. The data of the generating units are given below:
Operating limits:
150 600
100 400
50 200
Production cost function in 10 RS/h
0.00128 6.48 459
0.00194 7.85 310
0.00428 7.97 78
Neglect transmission loss.
Aim
(10)
Manual
Calculation (35)
Program
(35)
Results
(10)
Viva-voce
(10)
Total
(100)
19. Determine the economic generation schedule of three generating units in a power system to
meet the system load of 450 MW. The data of the generating units are given below:
Operating limits:
150 600
100 400
50 200
Production cost function in 10 RS/h
0.00128 6.48 459
0.00194 7.85 310
0.00428 7.97 78
Neglect transmission loss.
Aim
(10)
Manual
Calculation (35)
Program
(35)
Results
(10)
Viva-voce
(10)
Total
(100)
20. Prepare the data for the network given in figure 20.1 and run EMTP. Obtain the plots of
source voltage, load bus voltage and load current following the energisation of a single phase
load. Double the source inductance and obtain the plots of the variables mentioned earlier.
Figure 20.1: Energisation of 0.95 power factor load
Aim
(10)
Data
Preparation (35)
Simulation
(35)
Results
(10)
Viva-voce
(10)
Total
(100)
56.34  
cos wt 
SRC  BUS 1  BUS 12  BUS 13S  BUS 13L 
19.72mH 
22ohm 
6mH 2mH 6mH  0.05ohm 
0.81 
micro 
farad 
0.81 
micro 
farad

More Related Content

What's hot

CFOA based Integrator Suitable for Analog Signal Processing_ Crimson Publishers
CFOA based Integrator Suitable for Analog Signal Processing_ Crimson PublishersCFOA based Integrator Suitable for Analog Signal Processing_ Crimson Publishers
CFOA based Integrator Suitable for Analog Signal Processing_ Crimson Publishers
Crimsonpublishers-Electronics
 
CFOA based Integrator Suitable for Analog Signal Processing: Crimson Publishers
CFOA based Integrator Suitable for Analog Signal Processing: Crimson PublishersCFOA based Integrator Suitable for Analog Signal Processing: Crimson Publishers
CFOA based Integrator Suitable for Analog Signal Processing: Crimson Publishers
Crimsonpublishers-Electronics
 
Gate ee 2006 with solutions
Gate ee 2006 with solutionsGate ee 2006 with solutions
Gate ee 2006 with solutions
khemraj298
 
Smart Bin – Advanced Control System Design Project
Smart Bin – Advanced Control System Design ProjectSmart Bin – Advanced Control System Design Project
Smart Bin – Advanced Control System Design Project
Surya Chandra
 
Stability Enhancement in Nine Bus System with STATCOM
Stability Enhancement in Nine Bus System with STATCOMStability Enhancement in Nine Bus System with STATCOM
Stability Enhancement in Nine Bus System with STATCOM
IOSR Journals
 
Modeling and simulation of vehicle windshield wiper system using h infinity l...
Modeling and simulation of vehicle windshield wiper system using h infinity l...Modeling and simulation of vehicle windshield wiper system using h infinity l...
Modeling and simulation of vehicle windshield wiper system using h infinity l...
Mustefa Jibril
 
Ijtra141124
Ijtra141124Ijtra141124
Design And Implementation Of Arithmetic Logic Unit Using Modified Quasi Stati...
Design And Implementation Of Arithmetic Logic Unit Using Modified Quasi Stati...Design And Implementation Of Arithmetic Logic Unit Using Modified Quasi Stati...
Design And Implementation Of Arithmetic Logic Unit Using Modified Quasi Stati...
IOSRJVSP
 
Two-port network model of fixed-speed wind turbine generator for distribution...
Two-port network model of fixed-speed wind turbine generator for distribution...Two-port network model of fixed-speed wind turbine generator for distribution...
Two-port network model of fixed-speed wind turbine generator for distribution...
TELKOMNIKA JOURNAL
 
A Novel Distribution System Power Flow Algorithm using Forward Backward Matri...
A Novel Distribution System Power Flow Algorithm using Forward Backward Matri...A Novel Distribution System Power Flow Algorithm using Forward Backward Matri...
A Novel Distribution System Power Flow Algorithm using Forward Backward Matri...
iosrjce
 
Modelling design and control of an electromechanical mass lifting system usin...
Modelling design and control of an electromechanical mass lifting system usin...Modelling design and control of an electromechanical mass lifting system usin...
Modelling design and control of an electromechanical mass lifting system usin...
Mustefa Jibril
 
DEFECT ANALYSIS OF QUANTUM-DOT CELLULAR AUTOMATA COMBINATIONAL CIRCUIT USING ...
DEFECT ANALYSIS OF QUANTUM-DOT CELLULAR AUTOMATA COMBINATIONAL CIRCUIT USING ...DEFECT ANALYSIS OF QUANTUM-DOT CELLULAR AUTOMATA COMBINATIONAL CIRCUIT USING ...
DEFECT ANALYSIS OF QUANTUM-DOT CELLULAR AUTOMATA COMBINATIONAL CIRCUIT USING ...
IAEME Publication
 
A Three-Phase Grid-Connected PV System Based on SAPF for Power Quality Improv...
A Three-Phase Grid-Connected PV System Based on SAPF for Power Quality Improv...A Three-Phase Grid-Connected PV System Based on SAPF for Power Quality Improv...
A Three-Phase Grid-Connected PV System Based on SAPF for Power Quality Improv...
TELKOMNIKA JOURNAL
 
Load flow analysis of 10 bus loop distribution network excited by a generator...
Load flow analysis of 10 bus loop distribution network excited by a generator...Load flow analysis of 10 bus loop distribution network excited by a generator...
Load flow analysis of 10 bus loop distribution network excited by a generator...
International Journal of Power Electronics and Drive Systems
 
Development of an adaptive and a switched beam
Development of an adaptive and a switched beamDevelopment of an adaptive and a switched beam
Development of an adaptive and a switched beam
marwaeng
 
Psoc qp
Psoc qpPsoc qp
Psoc qp
aruna_eee
 
Fuzzy logic controller for synchronous generators in a stand-alone multi-mac...
Fuzzy logic controller for  synchronous generators in a stand-alone multi-mac...Fuzzy logic controller for  synchronous generators in a stand-alone multi-mac...
Fuzzy logic controller for synchronous generators in a stand-alone multi-mac...
IRJET Journal
 
SHE Control for PV System Connected to the Grid
SHE Control for PV System Connected to the GridSHE Control for PV System Connected to the Grid
SHE Control for PV System Connected to the Grid
TELKOMNIKA JOURNAL
 

What's hot (20)

CFOA based Integrator Suitable for Analog Signal Processing_ Crimson Publishers
CFOA based Integrator Suitable for Analog Signal Processing_ Crimson PublishersCFOA based Integrator Suitable for Analog Signal Processing_ Crimson Publishers
CFOA based Integrator Suitable for Analog Signal Processing_ Crimson Publishers
 
CFOA based Integrator Suitable for Analog Signal Processing: Crimson Publishers
CFOA based Integrator Suitable for Analog Signal Processing: Crimson PublishersCFOA based Integrator Suitable for Analog Signal Processing: Crimson Publishers
CFOA based Integrator Suitable for Analog Signal Processing: Crimson Publishers
 
Gate ee 2006 with solutions
Gate ee 2006 with solutionsGate ee 2006 with solutions
Gate ee 2006 with solutions
 
Smart Bin – Advanced Control System Design Project
Smart Bin – Advanced Control System Design ProjectSmart Bin – Advanced Control System Design Project
Smart Bin – Advanced Control System Design Project
 
Stability Enhancement in Nine Bus System with STATCOM
Stability Enhancement in Nine Bus System with STATCOMStability Enhancement in Nine Bus System with STATCOM
Stability Enhancement in Nine Bus System with STATCOM
 
Modeling and simulation of vehicle windshield wiper system using h infinity l...
Modeling and simulation of vehicle windshield wiper system using h infinity l...Modeling and simulation of vehicle windshield wiper system using h infinity l...
Modeling and simulation of vehicle windshield wiper system using h infinity l...
 
Ijtra141124
Ijtra141124Ijtra141124
Ijtra141124
 
Design And Implementation Of Arithmetic Logic Unit Using Modified Quasi Stati...
Design And Implementation Of Arithmetic Logic Unit Using Modified Quasi Stati...Design And Implementation Of Arithmetic Logic Unit Using Modified Quasi Stati...
Design And Implementation Of Arithmetic Logic Unit Using Modified Quasi Stati...
 
Two-port network model of fixed-speed wind turbine generator for distribution...
Two-port network model of fixed-speed wind turbine generator for distribution...Two-port network model of fixed-speed wind turbine generator for distribution...
Two-port network model of fixed-speed wind turbine generator for distribution...
 
A Novel Distribution System Power Flow Algorithm using Forward Backward Matri...
A Novel Distribution System Power Flow Algorithm using Forward Backward Matri...A Novel Distribution System Power Flow Algorithm using Forward Backward Matri...
A Novel Distribution System Power Flow Algorithm using Forward Backward Matri...
 
Modelling design and control of an electromechanical mass lifting system usin...
Modelling design and control of an electromechanical mass lifting system usin...Modelling design and control of an electromechanical mass lifting system usin...
Modelling design and control of an electromechanical mass lifting system usin...
 
DEFECT ANALYSIS OF QUANTUM-DOT CELLULAR AUTOMATA COMBINATIONAL CIRCUIT USING ...
DEFECT ANALYSIS OF QUANTUM-DOT CELLULAR AUTOMATA COMBINATIONAL CIRCUIT USING ...DEFECT ANALYSIS OF QUANTUM-DOT CELLULAR AUTOMATA COMBINATIONAL CIRCUIT USING ...
DEFECT ANALYSIS OF QUANTUM-DOT CELLULAR AUTOMATA COMBINATIONAL CIRCUIT USING ...
 
A Three-Phase Grid-Connected PV System Based on SAPF for Power Quality Improv...
A Three-Phase Grid-Connected PV System Based on SAPF for Power Quality Improv...A Three-Phase Grid-Connected PV System Based on SAPF for Power Quality Improv...
A Three-Phase Grid-Connected PV System Based on SAPF for Power Quality Improv...
 
Load flow analysis of 10 bus loop distribution network excited by a generator...
Load flow analysis of 10 bus loop distribution network excited by a generator...Load flow analysis of 10 bus loop distribution network excited by a generator...
Load flow analysis of 10 bus loop distribution network excited by a generator...
 
55 cr banu_ioan
55 cr banu_ioan55 cr banu_ioan
55 cr banu_ioan
 
Ai4301188192
Ai4301188192Ai4301188192
Ai4301188192
 
Development of an adaptive and a switched beam
Development of an adaptive and a switched beamDevelopment of an adaptive and a switched beam
Development of an adaptive and a switched beam
 
Psoc qp
Psoc qpPsoc qp
Psoc qp
 
Fuzzy logic controller for synchronous generators in a stand-alone multi-mac...
Fuzzy logic controller for  synchronous generators in a stand-alone multi-mac...Fuzzy logic controller for  synchronous generators in a stand-alone multi-mac...
Fuzzy logic controller for synchronous generators in a stand-alone multi-mac...
 
SHE Control for PV System Connected to the Grid
SHE Control for PV System Connected to the GridSHE Control for PV System Connected to the Grid
SHE Control for PV System Connected to the Grid
 

Similar to Ee2404.set2

EE6501 Power System Analysis Rejinpaul_Important_Questions
EE6501 Power System Analysis Rejinpaul_Important_QuestionsEE6501 Power System Analysis Rejinpaul_Important_Questions
EE6501 Power System Analysis Rejinpaul_Important_Questions
Santhosh Kumar
 
Ies conventional-electrical-engineering-2012
Ies conventional-electrical-engineering-2012Ies conventional-electrical-engineering-2012
Ies conventional-electrical-engineering-2012
arunkumarmurugesan88
 
1. A 5 to 20 bar reverse acting proportional pressure controll.docx
1. A 5 to 20 bar reverse acting proportional pressure controll.docx1. A 5 to 20 bar reverse acting proportional pressure controll.docx
1. A 5 to 20 bar reverse acting proportional pressure controll.docx
dorishigh
 
Three phase diode.pdf
Three phase diode.pdfThree phase diode.pdf
Three phase diode.pdf
RajatRaj47
 
Distance Algorithm for Transmission Line with Mid-Point Connected STATCOM
Distance Algorithm for Transmission Line with Mid-Point Connected STATCOMDistance Algorithm for Transmission Line with Mid-Point Connected STATCOM
Distance Algorithm for Transmission Line with Mid-Point Connected STATCOM
IRJET Journal
 
electronic.ppt
electronic.pptelectronic.ppt
electronic.ppt
MONEERTHAMEER
 
Uv CBPSD lab
Uv CBPSD labUv CBPSD lab
Uv CBPSD lab
Yuvraj Singh
 
Practice questions
Practice questionsPractice questions
Practice questions
Abha Tripathi
 
Voltage sags evaluation studies
Voltage sags evaluation studiesVoltage sags evaluation studies
Voltage sags evaluation studies
Web Design & Development
 
A New Proposal for OFCC-based Instrumentation Amplifier
A New Proposal for OFCC-based Instrumentation AmplifierA New Proposal for OFCC-based Instrumentation Amplifier
A New Proposal for OFCC-based Instrumentation Amplifier
IJECEIAES
 
A New Proposal for OFCC-based Instrumentation Amplifier
A New Proposal for OFCC-based Instrumentation AmplifierA New Proposal for OFCC-based Instrumentation Amplifier
A New Proposal for OFCC-based Instrumentation Amplifier
Yayah Zakaria
 
Application of SVM Technique for Three Phase Three Leg Ac/Ac Converter Topology
Application of SVM Technique for Three Phase Three Leg Ac/Ac Converter TopologyApplication of SVM Technique for Three Phase Three Leg Ac/Ac Converter Topology
Application of SVM Technique for Three Phase Three Leg Ac/Ac Converter Topology
IOSR Journals
 
199833536 ee2404-lab-manual
199833536 ee2404-lab-manual199833536 ee2404-lab-manual
199833536 ee2404-lab-manual
homeworkping4
 
A NEW FUZZY LOGIC BASED SPACE VECTOR MODULATION APPROACH ON DIRECT TORQUE CON...
A NEW FUZZY LOGIC BASED SPACE VECTOR MODULATION APPROACH ON DIRECT TORQUE CON...A NEW FUZZY LOGIC BASED SPACE VECTOR MODULATION APPROACH ON DIRECT TORQUE CON...
A NEW FUZZY LOGIC BASED SPACE VECTOR MODULATION APPROACH ON DIRECT TORQUE CON...
csandit
 
PEQPAU.pdf
PEQPAU.pdfPEQPAU.pdf
PEQPAU.pdf
thamizmani s
 
Implementation for Controller to Unified Single Phase Power Flow Using Digita...
Implementation for Controller to Unified Single Phase Power Flow Using Digita...Implementation for Controller to Unified Single Phase Power Flow Using Digita...
Implementation for Controller to Unified Single Phase Power Flow Using Digita...
IJERA Editor
 
Design and simulation of voltage amplidyne system using robust control technique
Design and simulation of voltage amplidyne system using robust control techniqueDesign and simulation of voltage amplidyne system using robust control technique
Design and simulation of voltage amplidyne system using robust control technique
Mustefa Jibril
 
How to Design and spec harmonic filter.pdf
How to Design and spec harmonic filter.pdfHow to Design and spec harmonic filter.pdf
How to Design and spec harmonic filter.pdf
tawat puangthong
 
Ec204 qp
Ec204 qpEc204 qp
Ec204 qp
Archana Thomas
 
Source current harmonic mitigation of distorted voltage source by using shunt...
Source current harmonic mitigation of distorted voltage source by using shunt...Source current harmonic mitigation of distorted voltage source by using shunt...
Source current harmonic mitigation of distorted voltage source by using shunt...
IJECEIAES
 

Similar to Ee2404.set2 (20)

EE6501 Power System Analysis Rejinpaul_Important_Questions
EE6501 Power System Analysis Rejinpaul_Important_QuestionsEE6501 Power System Analysis Rejinpaul_Important_Questions
EE6501 Power System Analysis Rejinpaul_Important_Questions
 
Ies conventional-electrical-engineering-2012
Ies conventional-electrical-engineering-2012Ies conventional-electrical-engineering-2012
Ies conventional-electrical-engineering-2012
 
1. A 5 to 20 bar reverse acting proportional pressure controll.docx
1. A 5 to 20 bar reverse acting proportional pressure controll.docx1. A 5 to 20 bar reverse acting proportional pressure controll.docx
1. A 5 to 20 bar reverse acting proportional pressure controll.docx
 
Three phase diode.pdf
Three phase diode.pdfThree phase diode.pdf
Three phase diode.pdf
 
Distance Algorithm for Transmission Line with Mid-Point Connected STATCOM
Distance Algorithm for Transmission Line with Mid-Point Connected STATCOMDistance Algorithm for Transmission Line with Mid-Point Connected STATCOM
Distance Algorithm for Transmission Line with Mid-Point Connected STATCOM
 
electronic.ppt
electronic.pptelectronic.ppt
electronic.ppt
 
Uv CBPSD lab
Uv CBPSD labUv CBPSD lab
Uv CBPSD lab
 
Practice questions
Practice questionsPractice questions
Practice questions
 
Voltage sags evaluation studies
Voltage sags evaluation studiesVoltage sags evaluation studies
Voltage sags evaluation studies
 
A New Proposal for OFCC-based Instrumentation Amplifier
A New Proposal for OFCC-based Instrumentation AmplifierA New Proposal for OFCC-based Instrumentation Amplifier
A New Proposal for OFCC-based Instrumentation Amplifier
 
A New Proposal for OFCC-based Instrumentation Amplifier
A New Proposal for OFCC-based Instrumentation AmplifierA New Proposal for OFCC-based Instrumentation Amplifier
A New Proposal for OFCC-based Instrumentation Amplifier
 
Application of SVM Technique for Three Phase Three Leg Ac/Ac Converter Topology
Application of SVM Technique for Three Phase Three Leg Ac/Ac Converter TopologyApplication of SVM Technique for Three Phase Three Leg Ac/Ac Converter Topology
Application of SVM Technique for Three Phase Three Leg Ac/Ac Converter Topology
 
199833536 ee2404-lab-manual
199833536 ee2404-lab-manual199833536 ee2404-lab-manual
199833536 ee2404-lab-manual
 
A NEW FUZZY LOGIC BASED SPACE VECTOR MODULATION APPROACH ON DIRECT TORQUE CON...
A NEW FUZZY LOGIC BASED SPACE VECTOR MODULATION APPROACH ON DIRECT TORQUE CON...A NEW FUZZY LOGIC BASED SPACE VECTOR MODULATION APPROACH ON DIRECT TORQUE CON...
A NEW FUZZY LOGIC BASED SPACE VECTOR MODULATION APPROACH ON DIRECT TORQUE CON...
 
PEQPAU.pdf
PEQPAU.pdfPEQPAU.pdf
PEQPAU.pdf
 
Implementation for Controller to Unified Single Phase Power Flow Using Digita...
Implementation for Controller to Unified Single Phase Power Flow Using Digita...Implementation for Controller to Unified Single Phase Power Flow Using Digita...
Implementation for Controller to Unified Single Phase Power Flow Using Digita...
 
Design and simulation of voltage amplidyne system using robust control technique
Design and simulation of voltage amplidyne system using robust control techniqueDesign and simulation of voltage amplidyne system using robust control technique
Design and simulation of voltage amplidyne system using robust control technique
 
How to Design and spec harmonic filter.pdf
How to Design and spec harmonic filter.pdfHow to Design and spec harmonic filter.pdf
How to Design and spec harmonic filter.pdf
 
Ec204 qp
Ec204 qpEc204 qp
Ec204 qp
 
Source current harmonic mitigation of distorted voltage source by using shunt...
Source current harmonic mitigation of distorted voltage source by using shunt...Source current harmonic mitigation of distorted voltage source by using shunt...
Source current harmonic mitigation of distorted voltage source by using shunt...
 

More from vlkumashankardeekshi th

SANDEEP KUMAR S.pptx
SANDEEP KUMAR S.pptxSANDEEP KUMAR S.pptx
SANDEEP KUMAR S.pptx
vlkumashankardeekshi th
 
Introduction_to_Management_and_Organizat.ppt
Introduction_to_Management_and_Organizat.pptIntroduction_to_Management_and_Organizat.ppt
Introduction_to_Management_and_Organizat.ppt
vlkumashankardeekshi th
 
my Matlab onramp certificate.pdf
my Matlab onramp certificate.pdfmy Matlab onramp certificate.pdf
my Matlab onramp certificate.pdf
vlkumashankardeekshi th
 
Residential wiring PPT.pptx
Residential wiring PPT.pptxResidential wiring PPT.pptx
Residential wiring PPT.pptx
vlkumashankardeekshi th
 
Transducers_sensors.ppt
Transducers_sensors.pptTransducers_sensors.ppt
Transducers_sensors.ppt
vlkumashankardeekshi th
 
SolarRadiation 29.06.23.pptx
SolarRadiation 29.06.23.pptxSolarRadiation 29.06.23.pptx
SolarRadiation 29.06.23.pptx
vlkumashankardeekshi th
 
interview.ppt
interview.pptinterview.ppt
intro- C.ppt
intro- C.pptintro- C.ppt
DC-circuit-theory.ppt
DC-circuit-theory.pptDC-circuit-theory.ppt
DC-circuit-theory.ppt
vlkumashankardeekshi th
 
Ee6008 mcbsd notes
Ee6008 mcbsd notesEe6008 mcbsd notes
Ee6008 mcbsd notes
vlkumashankardeekshi th
 
I02095257
I02095257I02095257
Etap 14
Etap 14Etap 14
Uma ee2355 design of electrical machines
Uma ee2355 design of electrical machinesUma ee2355 design of electrical machines
Uma ee2355 design of electrical machines
vlkumashankardeekshi th
 
Electrical Machines-1
Electrical Machines-1Electrical Machines-1
Electrical Machines-1
vlkumashankardeekshi th
 
Dazzler1 1
Dazzler1 1Dazzler1 1
2013 regulation Annauniversity syllabus
2013 regulation Annauniversity syllabus2013 regulation Annauniversity syllabus
2013 regulation Annauniversity syllabus
vlkumashankardeekshi th
 

More from vlkumashankardeekshi th (19)

SANDEEP KUMAR S.pptx
SANDEEP KUMAR S.pptxSANDEEP KUMAR S.pptx
SANDEEP KUMAR S.pptx
 
Introduction_to_Management_and_Organizat.ppt
Introduction_to_Management_and_Organizat.pptIntroduction_to_Management_and_Organizat.ppt
Introduction_to_Management_and_Organizat.ppt
 
my Matlab onramp certificate.pdf
my Matlab onramp certificate.pdfmy Matlab onramp certificate.pdf
my Matlab onramp certificate.pdf
 
Residential wiring PPT.pptx
Residential wiring PPT.pptxResidential wiring PPT.pptx
Residential wiring PPT.pptx
 
Transducers_sensors.ppt
Transducers_sensors.pptTransducers_sensors.ppt
Transducers_sensors.ppt
 
SolarRadiation 29.06.23.pptx
SolarRadiation 29.06.23.pptxSolarRadiation 29.06.23.pptx
SolarRadiation 29.06.23.pptx
 
interview.ppt
interview.pptinterview.ppt
interview.ppt
 
intro- C.ppt
intro- C.pptintro- C.ppt
intro- C.ppt
 
DC-circuit-theory.ppt
DC-circuit-theory.pptDC-circuit-theory.ppt
DC-circuit-theory.ppt
 
Ee6008 mcbsd notes
Ee6008 mcbsd notesEe6008 mcbsd notes
Ee6008 mcbsd notes
 
I02095257
I02095257I02095257
I02095257
 
himalaya
himalayahimalaya
himalaya
 
Etap 14
Etap 14Etap 14
Etap 14
 
Uma ee2355 design of electrical machines
Uma ee2355 design of electrical machinesUma ee2355 design of electrical machines
Uma ee2355 design of electrical machines
 
Electrical Machines-1
Electrical Machines-1Electrical Machines-1
Electrical Machines-1
 
siva kudambam
siva kudambamsiva kudambam
siva kudambam
 
Dazzler1 1
Dazzler1 1Dazzler1 1
Dazzler1 1
 
2013 regulation Annauniversity syllabus
2013 regulation Annauniversity syllabus2013 regulation Annauniversity syllabus
2013 regulation Annauniversity syllabus
 
Chapter9
Chapter9Chapter9
Chapter9
 

Recently uploaded

LIGA(E)11111111111111111111111111111111111111111.ppt
LIGA(E)11111111111111111111111111111111111111111.pptLIGA(E)11111111111111111111111111111111111111111.ppt
LIGA(E)11111111111111111111111111111111111111111.ppt
ssuser9bd3ba
 
Vaccine management system project report documentation..pdf
Vaccine management system project report documentation..pdfVaccine management system project report documentation..pdf
Vaccine management system project report documentation..pdf
Kamal Acharya
 
Event Management System Vb Net Project Report.pdf
Event Management System Vb Net  Project Report.pdfEvent Management System Vb Net  Project Report.pdf
Event Management System Vb Net Project Report.pdf
Kamal Acharya
 
H.Seo, ICLR 2024, MLILAB, KAIST AI.pdf
H.Seo,  ICLR 2024, MLILAB,  KAIST AI.pdfH.Seo,  ICLR 2024, MLILAB,  KAIST AI.pdf
H.Seo, ICLR 2024, MLILAB, KAIST AI.pdf
MLILAB
 
Railway Signalling Principles Edition 3.pdf
Railway Signalling Principles Edition 3.pdfRailway Signalling Principles Edition 3.pdf
Railway Signalling Principles Edition 3.pdf
TeeVichai
 
ethical hacking in wireless-hacking1.ppt
ethical hacking in wireless-hacking1.pptethical hacking in wireless-hacking1.ppt
ethical hacking in wireless-hacking1.ppt
Jayaprasanna4
 
ethical hacking-mobile hacking methods.ppt
ethical hacking-mobile hacking methods.pptethical hacking-mobile hacking methods.ppt
ethical hacking-mobile hacking methods.ppt
Jayaprasanna4
 
Planning Of Procurement o different goods and services
Planning Of Procurement o different goods and servicesPlanning Of Procurement o different goods and services
Planning Of Procurement o different goods and services
JoytuBarua2
 
Halogenation process of chemical process industries
Halogenation process of chemical process industriesHalogenation process of chemical process industries
Halogenation process of chemical process industries
MuhammadTufail242431
 
block diagram and signal flow graph representation
block diagram and signal flow graph representationblock diagram and signal flow graph representation
block diagram and signal flow graph representation
Divya Somashekar
 
Top 10 Oil and Gas Projects in Saudi Arabia 2024.pdf
Top 10 Oil and Gas Projects in Saudi Arabia 2024.pdfTop 10 Oil and Gas Projects in Saudi Arabia 2024.pdf
Top 10 Oil and Gas Projects in Saudi Arabia 2024.pdf
Teleport Manpower Consultant
 
一比一原版(SFU毕业证)西蒙菲莎大学毕业证成绩单如何办理
一比一原版(SFU毕业证)西蒙菲莎大学毕业证成绩单如何办理一比一原版(SFU毕业证)西蒙菲莎大学毕业证成绩单如何办理
一比一原版(SFU毕业证)西蒙菲莎大学毕业证成绩单如何办理
bakpo1
 
Courier management system project report.pdf
Courier management system project report.pdfCourier management system project report.pdf
Courier management system project report.pdf
Kamal Acharya
 
weather web application report.pdf
weather web application report.pdfweather web application report.pdf
weather web application report.pdf
Pratik Pawar
 
The role of big data in decision making.
The role of big data in decision making.The role of big data in decision making.
The role of big data in decision making.
ankuprajapati0525
 
HYDROPOWER - Hydroelectric power generation
HYDROPOWER - Hydroelectric power generationHYDROPOWER - Hydroelectric power generation
HYDROPOWER - Hydroelectric power generation
Robbie Edward Sayers
 
Gen AI Study Jams _ For the GDSC Leads in India.pdf
Gen AI Study Jams _ For the GDSC Leads in India.pdfGen AI Study Jams _ For the GDSC Leads in India.pdf
Gen AI Study Jams _ For the GDSC Leads in India.pdf
gdsczhcet
 
Nuclear Power Economics and Structuring 2024
Nuclear Power Economics and Structuring 2024Nuclear Power Economics and Structuring 2024
Nuclear Power Economics and Structuring 2024
Massimo Talia
 
power quality voltage fluctuation UNIT - I.pptx
power quality voltage fluctuation UNIT - I.pptxpower quality voltage fluctuation UNIT - I.pptx
power quality voltage fluctuation UNIT - I.pptx
ViniHema
 
在线办理(ANU毕业证书)澳洲国立大学毕业证录取通知书一模一样
在线办理(ANU毕业证书)澳洲国立大学毕业证录取通知书一模一样在线办理(ANU毕业证书)澳洲国立大学毕业证录取通知书一模一样
在线办理(ANU毕业证书)澳洲国立大学毕业证录取通知书一模一样
obonagu
 

Recently uploaded (20)

LIGA(E)11111111111111111111111111111111111111111.ppt
LIGA(E)11111111111111111111111111111111111111111.pptLIGA(E)11111111111111111111111111111111111111111.ppt
LIGA(E)11111111111111111111111111111111111111111.ppt
 
Vaccine management system project report documentation..pdf
Vaccine management system project report documentation..pdfVaccine management system project report documentation..pdf
Vaccine management system project report documentation..pdf
 
Event Management System Vb Net Project Report.pdf
Event Management System Vb Net  Project Report.pdfEvent Management System Vb Net  Project Report.pdf
Event Management System Vb Net Project Report.pdf
 
H.Seo, ICLR 2024, MLILAB, KAIST AI.pdf
H.Seo,  ICLR 2024, MLILAB,  KAIST AI.pdfH.Seo,  ICLR 2024, MLILAB,  KAIST AI.pdf
H.Seo, ICLR 2024, MLILAB, KAIST AI.pdf
 
Railway Signalling Principles Edition 3.pdf
Railway Signalling Principles Edition 3.pdfRailway Signalling Principles Edition 3.pdf
Railway Signalling Principles Edition 3.pdf
 
ethical hacking in wireless-hacking1.ppt
ethical hacking in wireless-hacking1.pptethical hacking in wireless-hacking1.ppt
ethical hacking in wireless-hacking1.ppt
 
ethical hacking-mobile hacking methods.ppt
ethical hacking-mobile hacking methods.pptethical hacking-mobile hacking methods.ppt
ethical hacking-mobile hacking methods.ppt
 
Planning Of Procurement o different goods and services
Planning Of Procurement o different goods and servicesPlanning Of Procurement o different goods and services
Planning Of Procurement o different goods and services
 
Halogenation process of chemical process industries
Halogenation process of chemical process industriesHalogenation process of chemical process industries
Halogenation process of chemical process industries
 
block diagram and signal flow graph representation
block diagram and signal flow graph representationblock diagram and signal flow graph representation
block diagram and signal flow graph representation
 
Top 10 Oil and Gas Projects in Saudi Arabia 2024.pdf
Top 10 Oil and Gas Projects in Saudi Arabia 2024.pdfTop 10 Oil and Gas Projects in Saudi Arabia 2024.pdf
Top 10 Oil and Gas Projects in Saudi Arabia 2024.pdf
 
一比一原版(SFU毕业证)西蒙菲莎大学毕业证成绩单如何办理
一比一原版(SFU毕业证)西蒙菲莎大学毕业证成绩单如何办理一比一原版(SFU毕业证)西蒙菲莎大学毕业证成绩单如何办理
一比一原版(SFU毕业证)西蒙菲莎大学毕业证成绩单如何办理
 
Courier management system project report.pdf
Courier management system project report.pdfCourier management system project report.pdf
Courier management system project report.pdf
 
weather web application report.pdf
weather web application report.pdfweather web application report.pdf
weather web application report.pdf
 
The role of big data in decision making.
The role of big data in decision making.The role of big data in decision making.
The role of big data in decision making.
 
HYDROPOWER - Hydroelectric power generation
HYDROPOWER - Hydroelectric power generationHYDROPOWER - Hydroelectric power generation
HYDROPOWER - Hydroelectric power generation
 
Gen AI Study Jams _ For the GDSC Leads in India.pdf
Gen AI Study Jams _ For the GDSC Leads in India.pdfGen AI Study Jams _ For the GDSC Leads in India.pdf
Gen AI Study Jams _ For the GDSC Leads in India.pdf
 
Nuclear Power Economics and Structuring 2024
Nuclear Power Economics and Structuring 2024Nuclear Power Economics and Structuring 2024
Nuclear Power Economics and Structuring 2024
 
power quality voltage fluctuation UNIT - I.pptx
power quality voltage fluctuation UNIT - I.pptxpower quality voltage fluctuation UNIT - I.pptx
power quality voltage fluctuation UNIT - I.pptx
 
在线办理(ANU毕业证书)澳洲国立大学毕业证录取通知书一模一样
在线办理(ANU毕业证书)澳洲国立大学毕业证录取通知书一模一样在线办理(ANU毕业证书)澳洲国立大学毕业证录取通知书一模一样
在线办理(ANU毕业证书)澳洲国立大学毕业证录取通知书一模一样
 

Ee2404.set2

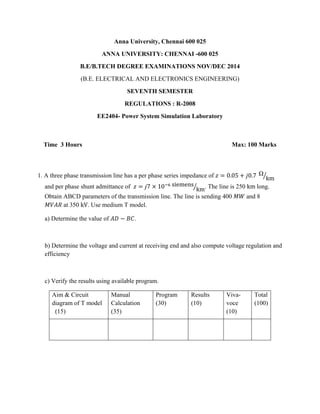
  • 1. Anna University, Chennai 600 025 ANNA UNIVERSITY: CHENNAI -600 025 B.E/B.TECH DEGREE EXAMINATIONS NOV/DEC 2014 (B.E. ELECTRICAL AND ELECTRONICS ENGINEERING) SEVENTH SEMESTER REGULATIONS : R-2008 EE2404- Power System Simulation Laboratory Time 3 Hours Max: 100 Marks 1. A three phase transmission line has a per phase series impedance of 0.05 0.7 Ω km and per phase shunt admittance of 7 10 siemens km. The line is 250 km long. Obtain ABCD parameters of the transmission line. The line is sending 400 and 8 at 350 kV. Use medium T model. a) Determine the value of . b) Determine the voltage and current at receiving end and also compute voltage regulation and efficiency c) Verify the results using available program. Aim & Circuit diagram of T model (15) Manual Calculation (35) Program (30) Results (10) Viva- voce (10) Total (100)
  • 2. 2. A three phase transposed line composed of one ACSR, 143000 , 47 7⁄ Bobolink conductors per phase with flat horizontal spacing of 11 between phases A and B, between phases B and C. The conductors have a diameter of 4 cm and a geometric mean radius of 2 . The line is to be replaced by a three conductor bundle of ACSR, 477000 , 26 7⁄ Hawk conductors having the same cross sectional area of aluminum as the single conductor line. The conductors have a diameter of 2.3 cm and a geometric mean radius of 1 cm. The new line will also have flat horizontal configuration, but it is to be operated at a higher voltage and therefore the spacing is increased to 13 as measured from the center of the bundles. The spacing between the conductors in the bundle is 40 . a) Determine the capacitance and inductance per phase per km of the above two lines. b) Determine the percentage change in inductance and capacitance in the bundle conductor system c) Verify the results using available program. Aim & Circuit diagram (15) Manual Calculation (30) Program (35) Results (10) Viva-voce (10) Total (100)
  • 3. 1  2 3  4 100 km 120 km 100 km 110 km  150 km 3. A Four bus system is shown in figure 3.1. Figure 3.1 Four Bus System All transmission lines are characterized by a series impedance of 0.1 0.7 Ω km and a shunt admittance of 0.35 10 mho km. Lines are rated at 220 kV. Use the values of 220 kV and 100 as base values. a) Express impedances and admittances in per unit. b) Compute the bus admittance matrix. c) Verify the results with the available program. Aim (10) Manual Calculation (35) Program (35) Results (10) Viva-voce (10) Total (100)
  • 4. 1  2 3  4 4. The figure 4.1 shows the one line diagram of a four bus system. Table 4.1 gives the transmission line data of the system shown in figure 4.1. Figure 4.1 Four bus System Table 4.1 Transmission line data for the four bus system Line ID Sending Bus Receiving Bus Resistance in per unit Reactance in per unit Half line charging susceptance in per unit Rating MVA 1 1 3 0.05 0.15 0 55 2 1 4 0.10 0.30 0 65 3 3 4 0.15 0.45 0 45 4 2 4 0.10 0.30 0 40 5 1 2 0.05 0.15 0 55 a) Compute bus admittance matrix assuming the line shown dotted is not connected. b) What modification needs to be carried out to bus admittance matrix if the line shown dotted is connected? c) Verify the results with the available program. Aim (10) Manual Calculation (35) Program (35) Results (10) Viva-voce (10) Total (100)
  • 5. 5) For the system shown in figure 5.1 compute the bus impedance matrix using Z-bus building algorithm. Neglect the resistance of the lines and the reactances of the lines are indicated in per unit in figure 5.1 on a 100 MVA base. Figure 5.1. Three bus system Aim (10) Manual Calculation (35) Program (35) Results (10) Viva-voce (10) Total (100) 1  2 3  0.1j  0.1j  0.1j  0.25j 0.25j 
  • 6. 6) For the three bus system shown in figure 6.1 the relevant per unit line admittances on 100 MVA base are indicated on the diagram. Form bus admittance matrix and determine the voltage at bus 2 and bus 3 after the second iteration using Gauss Siedel method. Assume acceleration factor as 1.6. Use available software and print the output of the load flow problem. Using the voltage solution of the converged power flow obtained from the available program compute the sending end and receiving end line flow in each of the transmission line. Solve the power flow problem using the available program for different value of acceleration factors and plot the convergence characteristics. Fig 6.1 Three bus System Aim (10) Manual Calculation (35) Program (35) Convergence Plot (5) Results (5) Viva-voce (10) Total (100) Slack  Generator  ‐j5 mho ‐j3 mho ‐j4 mho 1  2 3 60MW+j30MVAR 50MW+j25MVAR  25MW+j15MVAR V1=1.02 p.u 
  • 7. 7. For the three bus system shown in figure 7.1 the relevant per unit line admittances on 100 MVA base are indicated on the diagram. Form bus admittance matrix and determine the voltage at bus 2 and bus 3 after the second iteration using Gauss Siedel method. Assume acceleration factor as 1.6. Use available software and print the output of the load flow problem. Using the voltage solution of the converged power flow obtained from the available program compute the sending end and receiving end line flow in each of the transmission line. Solve the power flow problem using the available program for different value of acceleration factors and plot the convergence characteristics. Fig 7.1 Three bus System Aim (10) Manual Calculation (35) Program (35) Convergence Plot (5) Results (5) Viva-voce (10) Total (100) Slack  Generator  ‐j3 mho ‐j4 mho ‐j5 mho 1  2 3 50MW+j20MVAR 30MW+j5MVAR  25MW+j15MVAR V1=1.03 p.u
  • 8. 8. For the power system shown in figure 8.1 (i) Perform two iteration of N-R method using flat start and obtain the complex voltage at bus 2. (ii) Using the solution determine the real and reactive power mismatch at bus 2 (iii) Compute real and reactive power flow in the transmission line (iv) Compute the line losses (v) Obtain the slack bus generation (vi) Verify the results with available software. Figure 8.1 Two bus system Aim (10) Manual Calculation (35) Program (35) Results (10) Viva-voce (10) Total (100) 2 0.02+j0.06 p.u Slack  Generator  1  V1=1.02 p.u  50 MW  +j30 MVAR  150 MW+  j90 MVAR  75 MW  +j30 MVAR  j0.03 p.u j0.03 p.u 
  • 9. 9. For the power system shown in figure 9.1 (i) Perform two iteration of N-R method using flat start and obtain the complex voltage at bus 2. (ii) Using the solution determine the real and reactive power mismatch at bus 2 (iii) Compute real and reactive power flow in the transmission line (iv) Compute the line losses (v) Obtain the slack bus generation (vi) Verify the results with available software. Figure 9.1 Two bus system Aim (10) Manual Calculation (35) Program (35) Results (10) Viva-voce (10) Total (100) 2 0.01+j0.05 p.u Slack  Generator  1  V1=1.03 p.u  50 MW  +j30 MVAR  100 MW+  J60 MVAR  75 MW  +j30 MVAR  j0.02 p.u j0.02 p.u 
  • 10. 10. For the power system shown in figure 10.1 (i) Perform two iteration of Fast Decoupled Power Flow using flat start and obtain the complex voltage at bus 2. (ii) Using the solution determine the real and reactive power mismatch at bus 2 (iii) Compute real and reactive power flow in the transmission line (iv) Compute the line losses (v) Obtain the slack bus generation (vi) Verify the results with available software. Figure 10.1 Two bus system Aim (10) Manual Calculation (35) Program (35) Results (10) Viva-voce (10) Total (100) 2 0.02+j0.06 p.u Slack  Generator  1  V1=1.02 p.u  50 MW  +j30 MVAR  150 MW+  j90 MVAR  75 MW  +j30 MVAR  j0.03 p.u j0.03 p.u 
  • 11. 11. Consider the power system shown in figure 11.1 in which a synchronous generator supplies a synchronous motor. The motor is operating at rated voltage and rated MVA while drawing a load current at a power factor of 0.9 (lag) when a three phase symmetrical fault occurs at its terminals. Calculate the fault current that flow both from the generator and the motor. Verify the results with the available software. Figure 11.1 A generator supplying a motor load through a transmission line Aim (10) Manual Calculation (35) Program (35) Results (10) Viva-voce (10) Total (100) X’’=0.2 p.u.  50 MVA  20 kV  X=0.1 p.u.  50 MVA  20 kV/66kV  X=0.1 p.u.  50 MVA  20 kV/66kV  X’’=0.2 p.u.  25 MVA  18 kV  j10 ohms 
  • 12. 12. Consider the network shown in figure 12.1. For a line to ground fault at bus 2, determine the fault current and MVA at faulted bus, post fault voltages, fault current distribution in different elements of the network. Draw a single line diagram showing the above results. Check the results obtained using available software. Figure 12.1 Four bus system : 100 , 20 , ′′ 20%; 4% , : 100 , 20 345 ; 8% : 15%; 50% 100 : 100 , 20 , ′′ 20%; 4%; 5% Aim (10) Manual Calculation (35) Program (35) Single line diagram (5) Results (5) Viva-voce (10) Total (100)
  • 13. 13. Consider the system in which generator is connected to an infinite bus through a double circuit transmission line as shown in figure 13.1. The per unit system reactances that are converted in a common base, are also shown in figure 13.1. Assume the infinite bus voltage as 1 0 . . The generator is delivering 1.0 p.u. real power at a lagging power factor of 0.98 to the infinite bus. While the generator is operating in steady state, a three phase bolted short circuit occurs in the transmission line as shown in figure 13.1 very near to bus 4. Assume 3.5 ⁄ . The fault is cleared by opening the circuit breakers at the two ends of the line. Find the critical clearing time. Figure 13.1 Four bus System Aim (10) Manual Calculation (35) Program (35) Critical Clearing time (5) Results (5) Viva-voce (10) Total (100)
  • 14. 14. Consider the system in which generator is connected to an infinite bus through a double circuit transmission line as shown in figure 14.1. The per unit system reactances that are converted in a common base, are also shown in figure 14.1. Assume the infinite bus voltage as 1 0 . . The generator is delivering 1.0 p.u. real power at a lagging power factor of 0.95 to the infinite bus. While the generator is operating in steady state, a three phase bolted short circuit occurs in the transmission line as shown in figure 14.1 very near to bus 4. Assume 4 ⁄ . The fault is cleared by opening the circuit breakers at the two ends of the line. Find the critical clearing time. Figure 14.1 Four bus System Aim (10) Manual Calculation (35) Program (35) Critical Clearing time (5) Results (5) Viva-voce (10) Total (100)
  • 15. 15. It is proposed to simulate using the software available the load frequency dynamics of a single area power system whose data are given below: Rated capacity of the area=2000MW Normal operating load=1000 MW Nominal Frequency=50Hertz Inertia constant of the area=5 seconds Governor droop= 4% Governor time constant =0.08 Seconds Turbine time constant=0.3 seconds Assume linear load frequency characteristics. The area has a governor control but not a load frequency controller. The area is subjected to a load increase of 20 MW. a) Simulate the load-frequency dynamics of this area using available software and check the following i) Steady State frequency deviation in Hertz. Compare with the manual calculation ii) Plot the time response of frequency deviation in hertz and change in turbine power in p.u. MW. iii) Implement a suitable control to minimize the error. Aim (10) Manual Calculation (35) Simulation (35) Results (10) Viva-voce (10) Total (100)
  • 16. 16. Simulate a load frequency dynamics of a two area power system. Both the areas are identical and the system parameters are given below. Rated capacity of the area=2000MW Normal operating load=1000 MW Nominal Frequency=50Hertz Inertia constant of the area=5 seconds Governor droop= 4% Governor time constant =0.08 Seconds Turbine time constant=0.3 seconds Assume that the tie line has a capacity of 200 MW and is operating at a power angle of thirty degrees. Assume that both the areas do not have load frequency controller. Area 2 is subjected to a load increase of 20 MW. a) Simulate the load-frequency dynamics of this area using available software and check the following i) Steady State frequency deviation in Hertz and tie line flow deviation in p.u.MW. Compare with the manual calculation ii) Plot the time response of frequency deviation in hertz. iii) Implement a suitable control to minimize the error. Aim (10) Manual Calculation (35) Simulation (35) Results (10) Viva-voce (10) Total (100)
  • 17. 17. In a four bus system the generating units connected at buses 1 and 2 are supplying a total demand of 500MW connected at buses 3 and 4. The generating unit 1 and 2 have an incremental fuel cost in dollars per megawatt hour as given below 0.008 8.0; 0.0096 6.4 Generation limits: 50 500 40 400 Calculate the economic loading of each unit to meet a total customer load of 500 MW. What is the system and what is the transmission loss of the system? Determine the penalty factor for each unit and incremental fuel cost at each generating bus. Verify the results with available software. Also calculate the decrease in production costs of the two plants when the system load is reduced from 500MW to 430 MW. Assume that the loss coefficients at the specified load level of 500 MW in per unit on a 100 MVA base are given below 2 2 2 2 8.383 0.049 0.375 0.049 5.963 0.195 0.375 0.195 0.090 10 Aim (10) Manual Calculation (35) Program (35) Results (10) Viva-voce (10) Total (100)
  • 18. 18. Determine the economic generation schedule of three generating units in a power system to meet the system load of 850 MW. The data of the generating units are given below: Operating limits: 150 600 100 400 50 200 Production cost function in 10 RS/h 0.00128 6.48 459 0.00194 7.85 310 0.00428 7.97 78 Neglect transmission loss. Aim (10) Manual Calculation (35) Program (35) Results (10) Viva-voce (10) Total (100)
  • 19. 19. Determine the economic generation schedule of three generating units in a power system to meet the system load of 450 MW. The data of the generating units are given below: Operating limits: 150 600 100 400 50 200 Production cost function in 10 RS/h 0.00128 6.48 459 0.00194 7.85 310 0.00428 7.97 78 Neglect transmission loss. Aim (10) Manual Calculation (35) Program (35) Results (10) Viva-voce (10) Total (100)
  • 20. 20. Prepare the data for the network given in figure 20.1 and run EMTP. Obtain the plots of source voltage, load bus voltage and load current following the energisation of a single phase load. Double the source inductance and obtain the plots of the variables mentioned earlier. Figure 20.1: Energisation of 0.95 power factor load Aim (10) Data Preparation (35) Simulation (35) Results (10) Viva-voce (10) Total (100) 56.34   cos wt  SRC  BUS 1  BUS 12  BUS 13S  BUS 13L  19.72mH  22ohm  6mH 2mH 6mH  0.05ohm  0.81  micro  farad  0.81  micro  farad