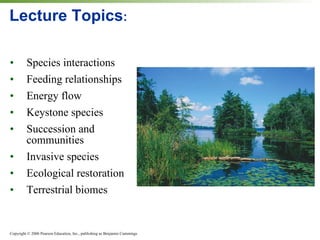
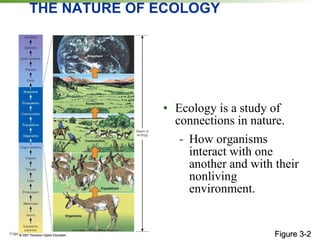
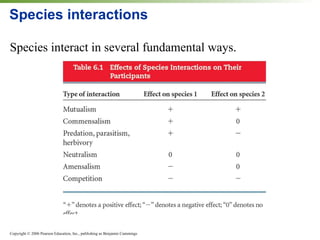
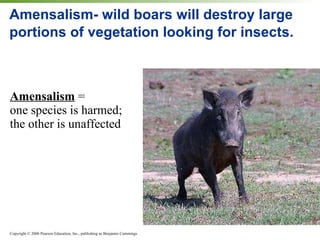
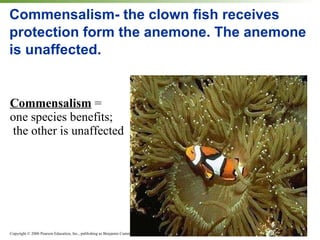
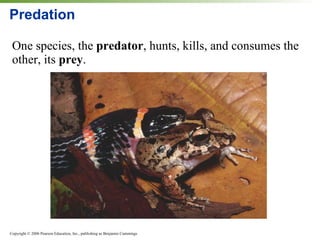
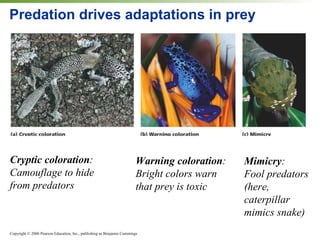
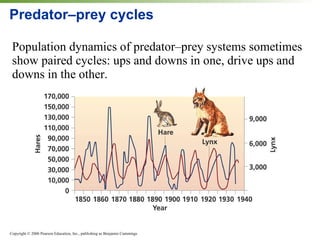
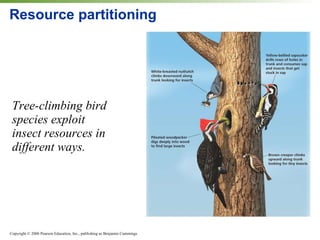
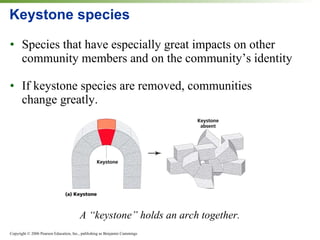
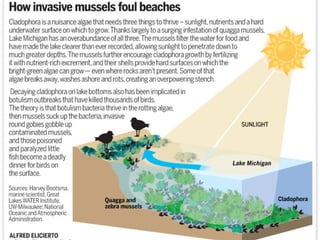
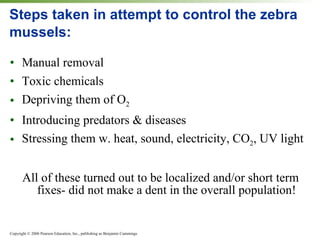
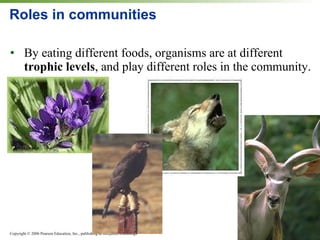
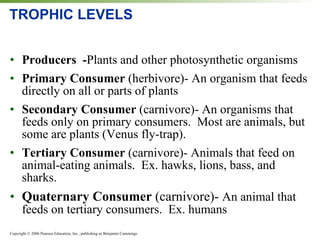
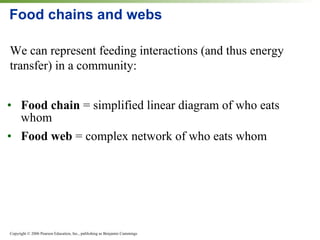
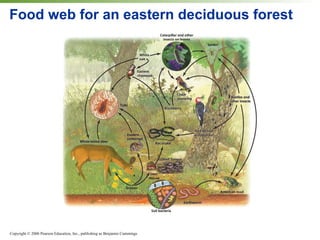
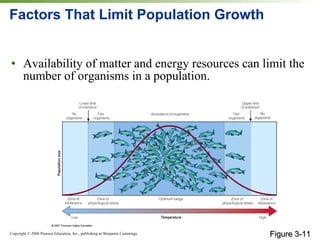
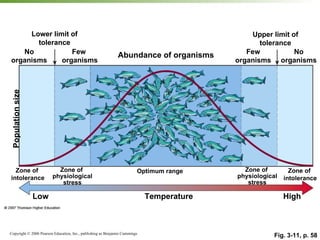
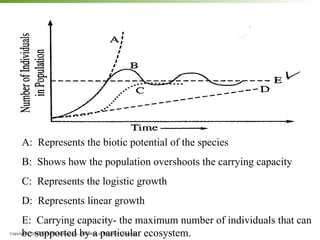
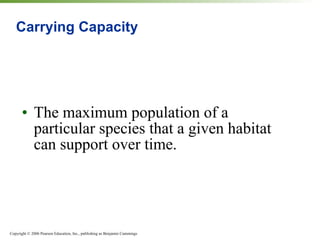
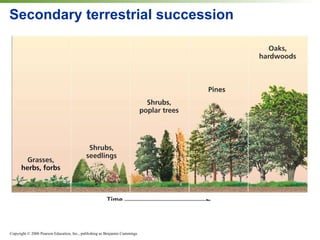
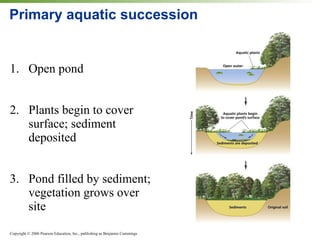
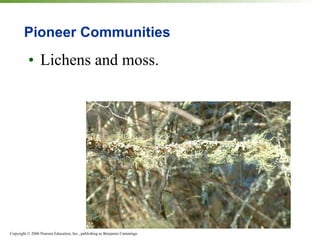
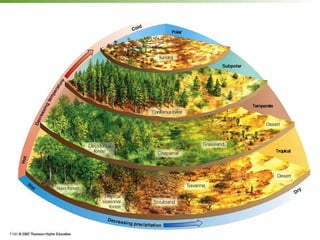
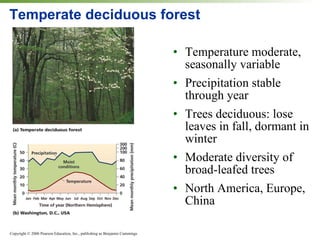
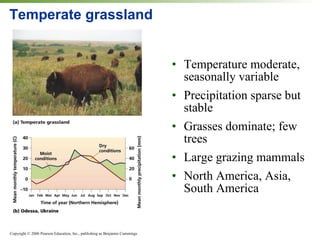
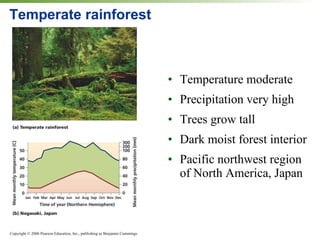
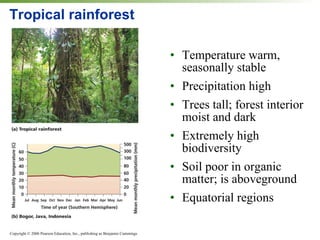
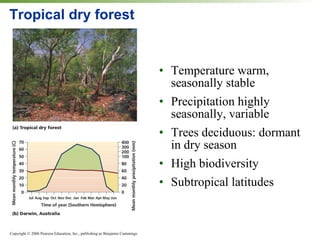
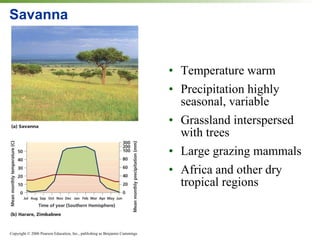
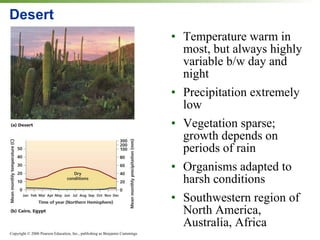
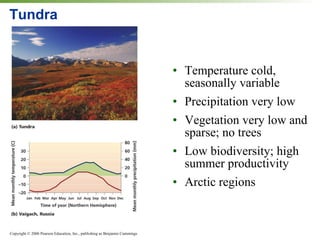
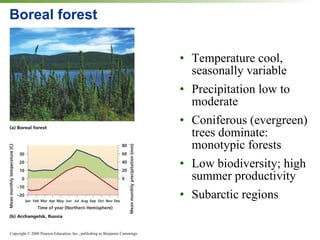
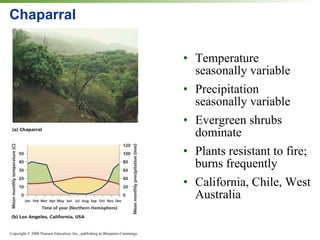
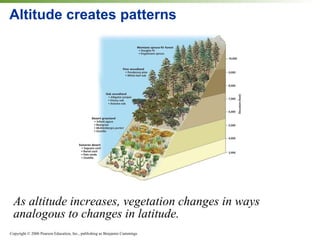
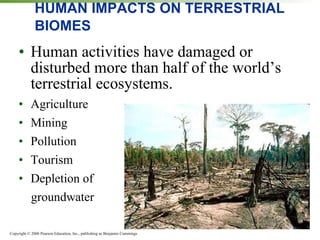
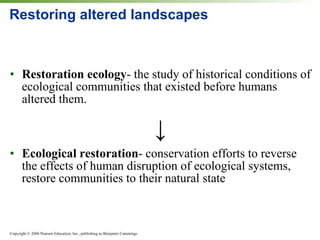
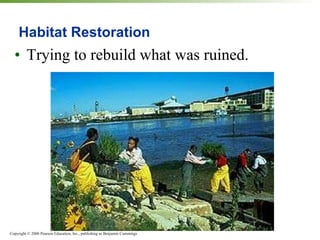
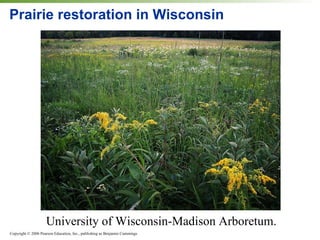
COMMUNITY ECOLOGY
Lecture Topics : Species interactions Feeding relationships Energy flow Keystone species Succession and communities Invasive species Ecological restoration Terrestrial biomes
THE NATURE OF ECOLOGY Ecology is a study of connections in nature. How organisms interact with one another and with their nonliving environment. Figure 3-2
ECOLOGY DEFINITIONS Biosphere  – region of the Earth that supports life (includes all the land, water and air in which organisms live) Biome  – A group of ecosystems that have the same climate and similar dominant communities Ecosystem  – all the biotic factor and abiotic factors living together within a given region
Community  – all the populations (biotic factors) that live and interact in one environment Population  – all the members of a single species that live in one area Species  – a group of organisms so similar to one another that they can breed and produce fertile offspring Niche  – a particular role a population plays in the community (“its job”); ex. Honeybee pollinates flowers; hawks prey on mice
Species interactions Species interact in several fundamental ways.
Amensalism- wild boars will destroy large portions of vegetation looking for insects.  Amensalism  =  one species is harmed;  the other is unaffected
Commensalism- the clown fish receives protection form the anemone. The anemone is unaffected. Commensalism  =  one species benefits; the other is unaffected
Predation One species, the  predator , hunts, kills, and consumes the other, its  prey .
Predation drives adaptations in prey Cryptic coloration : Camouflage to hide from predators Warning coloration : Bright colors warn that prey is toxic Mimicry : Fool predators (here, caterpillar mimics snake)
Predator – prey cycles Population dynamics of predator – prey systems sometimes show paired cycles: ups and downs in one, drive ups and downs in the other.
Parasitism One species, the  parasite , exploits the other species, the  host , gaining benefits and doing harm.
Herbivory One of the most common types of exploitation is  herbivory , which occurs when animals feed on the tissues of plants.
Mutualism Both species benefit one another. Hummingbird pollinates flower while gaining nectar for itself.
Species interactions When multiple species seek the same limited resource Interspecific competition  is between two or    more species. Intraspecific competition  is within a species. Usually does not involve active fighting, but subtle contests to procure resources.
Interspecific competition Different outcomes: Competitive exclusion  = one species excludes the other from a resource Species coexistence  = both species coexist at a ratio of population sizes, or  stable equilibrium
Interspecific competition Adjusting resource use, habitat use, or way of life over evolutionary time leads to: Resource partitioning  = species specialize in different ways of exploiting a resource Character displacement  = physical characters evolve to become different to better differentiate resource use
Resource partitioning Tree-climbing bird species exploit insect resources in different ways.
Keystone species Species that have especially great impacts on other community members and on the community’s identity If keystone species are removed, communities  change greatly. A “keystone” holds an arch together.
Keystone species When the keystone sea otter is removed, sea urchins overgraze kelp and destroy the kelp forest community.
Indicator Species:  Biological Smoke Alarms Species that serve as early warnings of damage to a community or an ecosystem. EX: Presence or absence of trout species because they are sensitive to temperature and oxygen levels.
Invasive Species Non-native organism that arrives in a community from elsewhere, spreads, and becomes dominant. Become invasive when  limiting factors  are removed or absent (predators, parasites, competitors) Controlling and eradicating = VERY EXPENSIVE Prevention is cheaper and more effective
Central Case: Black and White, and Spread All Over: Zebra Mussels Invade the Great Lakes The zebra mussel—a native of western Asia and eastern Europe—was discovered in the Great Lakes in 1988. Encountering none of the species that limited their population in the Old World, they spread across 40% of the U.S. watershed. These invaders have both economic and ecological impacts, changing communities in ways scientists are only beginning to understand.
 
Steps taken in attempt to control the zebra mussels: Manual removal Toxic chemicals Depriving them of O 2 Introducing predators & diseases Stressing them w. heat, sound, electricity, CO 2 , UV light All of these turned out to be localized and/or short term fixes- did not make a dent in the overall population!
Roles in communities By eating different foods, organisms are at different  trophic levels , and play different roles in the community.
TROPHIC LEVELS Producers  - Plants and other photosynthetic organisms Primary Consumer  (herbivore)- An organism that feeds directly on all or parts of plants Secondary Consumer  (carnivore)- An organisms that feeds only on primary consumers.  Most are animals, but some are plants (Venus fly-trap). Tertiary Consumer  (carnivore)- Animals that feed on animal-eating animals.  Ex. hawks, lions, bass, and sharks. Quaternary Consumer  (carnivore)-  An animal that feeds on tertiary consumers.  Ex. humans
Relationship Between Biomass and Energy Biomass is dry weight of the living tissue within each level & represents the chemical energy stored at each energy level. Water is neither a source of energy, nor has any nutritional value so it is not included in biomass .
ECOLOGICAL PYRAMID Shows the relationships between producers and consumers at the trophic levels in an ecosystem. Grass,  flowers Rabbits, mice Snakes Owls
In accordance with the 2nd law of thermodynamics, there is a decrease in the amount of energy available to each succeeding organism in a food chain or web. We assume that  10%  of the energy at each level is acquired by the higher level.  The remaining 90% is lost as low-grade heat.
Consumers Animals that eat plants are primary consumers, or  herbivores . Animals that eat animals are  carnivores . Animals that eat plants and animals are  omnivores. Detritivores  and  decomposers  eat nonliving organic matter; they recycle nutrients.
Food chains and webs Food chain  =   simplified linear diagram of who eats whom Food web  = complex network of who eats whom We can represent feeding interactions (and thus energy transfer) in a community:
Food web for an eastern deciduous forest
Factors That Limit Population Growth Availability of matter and energy resources can limit the number of organisms in a population. Figure 3-11
Fig. 3-11, p. 58 Zone of  intolerance Optimum range Zone of  physiological stress Zone of  physiological stress Zone of  intolerance Temperature Low High No organisms Few organisms Upper limit of tolerance Population size Abundance of organisms Few  organisms No organisms Lower limit of tolerance
A:  Represents the biotic potential of the species B:  Shows how the population overshoots the carrying capacity C:  Represents the logistic growth D:  Represents linear growth E:  Carrying capacity- the maximum number of individuals that can be supported by a particular ecosystem.
Carrying Capacity The maximum population of a particular species that a given habitat can support over time.
Succession A series of regular, predictable, quantifiable changes through which communities go •  Primary succession : Pioneer species colonize a newly exposed area (lava flows, glacial retreat, dried lake bed). •  Secondary succession :   The community changes following a disturbance (fire, hurricane, logging).
Secondary terrestrial succession
1. Open pond 2. Plants begin to cover surface; sediment deposited 3. Pond filled by sediment; vegetation grows over site Primary aquatic succession
Pioneer Communities Lichens and moss.
Climax Community The transitions between stages of succession eventually lead to a  climax community . The climax community remains in place, with little modification, until some disturbance restarts succession.
Biomes The most important factors in a biome are temperature and precipitation. Biomes tend to converge around latitude lines on the globe.
 
Temperate deciduous forest Temperature moderate, seasonally variable Precipitation stable through year  Trees deciduous: lose leaves in fall, dormant in winter Moderate diversity of broad-leafed trees North America, Europe, China
Temperate grassland Temperature moderate, seasonally variable Precipitation sparse but stable Grasses dominate; few trees Large grazing mammals North America, Asia, South America
Temperate rainforest Temperature moderate Precipitation very high Trees grow tall Dark moist forest interior Pacific northwest region of North America, Japan
Tropical rainforest Temperature warm, seasonally stable Precipitation high Trees tall; forest interior moist and dark Extremely high biodiversity Soil poor in organic matter; is aboveground Equatorial regions
Tropical dry forest Temperature warm, seasonally stable Precipitation highly seasonally, variable Trees deciduous: dormant in dry season High biodiversity Subtropical latitudes
Savanna Temperature warm Precipitation highly seasonal, variable Grassland interspersed with trees Large grazing mammals Africa and other dry tropical regions
Desert Temperature warm in most, but always highly variable b/w day and night Precipitation extremely low  Vegetation sparse; growth depends on periods of rain Organisms adapted to harsh conditions Southwestern region of North America, Australia, Africa
Tundra Temperature cold, seasonally variable Precipitation very low  Vegetation very low and sparse; no trees Low biodiversity; high summer productivity Arctic regions
Boreal forest Temperature cool, seasonally variable Precipitation low to moderate  Coniferous (evergreen) trees dominate: monotypic forests Low biodiversity; high summer productivity Subarctic regions
Chaparral Temperature seasonally variable Precipitation seasonally variable Evergreen shrubs dominate Plants resistant to fire; burns frequently California, Chile, West Australia
Altitude creates patterns As altitude increases, vegetation changes in ways analogous to changes in latitude.
HUMAN IMPACTS ON TERRESTRIAL BIOMES Human activities have damaged or disturbed more than half of the world’s terrestrial ecosystems. Agriculture Mining Pollution Tourism Depletion of groundwater
Restoring altered landscapes Restoration ecology - the study of historical conditions of ecological communities that existed before humans altered them. ↓ Ecological restoration - conservation efforts to reverse the effects of human disruption of ecological systems, restore communities to their natural state
Habitat Restoration Trying to rebuild what was ruined.                                                                                                                                                                               
Prairie restoration in Wisconsin University of Wisconsin-Madison Arboretum.
Reclamation Returning vegetation to an area that has been mined or disturbed by human use. This can be done by re-planting, cleaning up pollution, regulations (laws) or any other activity designed to “fix” a destroyed area.

Ecology1

  • 1.
  • 2.
    Lecture Topics :Species interactions Feeding relationships Energy flow Keystone species Succession and communities Invasive species Ecological restoration Terrestrial biomes
  • 3.
    THE NATURE OFECOLOGY Ecology is a study of connections in nature. How organisms interact with one another and with their nonliving environment. Figure 3-2
  • 4.
    ECOLOGY DEFINITIONS Biosphere – region of the Earth that supports life (includes all the land, water and air in which organisms live) Biome – A group of ecosystems that have the same climate and similar dominant communities Ecosystem – all the biotic factor and abiotic factors living together within a given region
  • 5.
    Community –all the populations (biotic factors) that live and interact in one environment Population – all the members of a single species that live in one area Species – a group of organisms so similar to one another that they can breed and produce fertile offspring Niche – a particular role a population plays in the community (“its job”); ex. Honeybee pollinates flowers; hawks prey on mice
  • 6.
    Species interactions Speciesinteract in several fundamental ways.
  • 7.
    Amensalism- wild boarswill destroy large portions of vegetation looking for insects. Amensalism = one species is harmed; the other is unaffected
  • 8.
    Commensalism- the clownfish receives protection form the anemone. The anemone is unaffected. Commensalism = one species benefits; the other is unaffected
  • 9.
    Predation One species,the predator , hunts, kills, and consumes the other, its prey .
  • 10.
    Predation drives adaptationsin prey Cryptic coloration : Camouflage to hide from predators Warning coloration : Bright colors warn that prey is toxic Mimicry : Fool predators (here, caterpillar mimics snake)
  • 11.
    Predator – preycycles Population dynamics of predator – prey systems sometimes show paired cycles: ups and downs in one, drive ups and downs in the other.
  • 12.
    Parasitism One species,the parasite , exploits the other species, the host , gaining benefits and doing harm.
  • 13.
    Herbivory One ofthe most common types of exploitation is herbivory , which occurs when animals feed on the tissues of plants.
  • 14.
    Mutualism Both speciesbenefit one another. Hummingbird pollinates flower while gaining nectar for itself.
  • 15.
    Species interactions Whenmultiple species seek the same limited resource Interspecific competition is between two or more species. Intraspecific competition is within a species. Usually does not involve active fighting, but subtle contests to procure resources.
  • 16.
    Interspecific competition Differentoutcomes: Competitive exclusion = one species excludes the other from a resource Species coexistence = both species coexist at a ratio of population sizes, or stable equilibrium
  • 17.
    Interspecific competition Adjustingresource use, habitat use, or way of life over evolutionary time leads to: Resource partitioning = species specialize in different ways of exploiting a resource Character displacement = physical characters evolve to become different to better differentiate resource use
  • 18.
    Resource partitioning Tree-climbingbird species exploit insect resources in different ways.
  • 19.
    Keystone species Speciesthat have especially great impacts on other community members and on the community’s identity If keystone species are removed, communities change greatly. A “keystone” holds an arch together.
  • 20.
    Keystone species Whenthe keystone sea otter is removed, sea urchins overgraze kelp and destroy the kelp forest community.
  • 21.
    Indicator Species: Biological Smoke Alarms Species that serve as early warnings of damage to a community or an ecosystem. EX: Presence or absence of trout species because they are sensitive to temperature and oxygen levels.
  • 22.
    Invasive Species Non-nativeorganism that arrives in a community from elsewhere, spreads, and becomes dominant. Become invasive when limiting factors are removed or absent (predators, parasites, competitors) Controlling and eradicating = VERY EXPENSIVE Prevention is cheaper and more effective
  • 23.
    Central Case: Blackand White, and Spread All Over: Zebra Mussels Invade the Great Lakes The zebra mussel—a native of western Asia and eastern Europe—was discovered in the Great Lakes in 1988. Encountering none of the species that limited their population in the Old World, they spread across 40% of the U.S. watershed. These invaders have both economic and ecological impacts, changing communities in ways scientists are only beginning to understand.
  • 24.
  • 25.
    Steps taken inattempt to control the zebra mussels: Manual removal Toxic chemicals Depriving them of O 2 Introducing predators & diseases Stressing them w. heat, sound, electricity, CO 2 , UV light All of these turned out to be localized and/or short term fixes- did not make a dent in the overall population!
  • 26.
    Roles in communitiesBy eating different foods, organisms are at different trophic levels , and play different roles in the community.
  • 27.
    TROPHIC LEVELS Producers - Plants and other photosynthetic organisms Primary Consumer (herbivore)- An organism that feeds directly on all or parts of plants Secondary Consumer (carnivore)- An organisms that feeds only on primary consumers. Most are animals, but some are plants (Venus fly-trap). Tertiary Consumer (carnivore)- Animals that feed on animal-eating animals. Ex. hawks, lions, bass, and sharks. Quaternary Consumer (carnivore)- An animal that feeds on tertiary consumers. Ex. humans
  • 28.
    Relationship Between Biomassand Energy Biomass is dry weight of the living tissue within each level & represents the chemical energy stored at each energy level. Water is neither a source of energy, nor has any nutritional value so it is not included in biomass .
  • 29.
    ECOLOGICAL PYRAMID Showsthe relationships between producers and consumers at the trophic levels in an ecosystem. Grass, flowers Rabbits, mice Snakes Owls
  • 30.
    In accordance withthe 2nd law of thermodynamics, there is a decrease in the amount of energy available to each succeeding organism in a food chain or web. We assume that 10% of the energy at each level is acquired by the higher level. The remaining 90% is lost as low-grade heat.
  • 31.
    Consumers Animals thateat plants are primary consumers, or herbivores . Animals that eat animals are carnivores . Animals that eat plants and animals are omnivores. Detritivores and decomposers eat nonliving organic matter; they recycle nutrients.
  • 32.
    Food chains andwebs Food chain = simplified linear diagram of who eats whom Food web = complex network of who eats whom We can represent feeding interactions (and thus energy transfer) in a community:
  • 33.
    Food web foran eastern deciduous forest
  • 34.
    Factors That LimitPopulation Growth Availability of matter and energy resources can limit the number of organisms in a population. Figure 3-11
  • 35.
    Fig. 3-11, p.58 Zone of intolerance Optimum range Zone of physiological stress Zone of physiological stress Zone of intolerance Temperature Low High No organisms Few organisms Upper limit of tolerance Population size Abundance of organisms Few organisms No organisms Lower limit of tolerance
  • 36.
    A: Representsthe biotic potential of the species B: Shows how the population overshoots the carrying capacity C: Represents the logistic growth D: Represents linear growth E: Carrying capacity- the maximum number of individuals that can be supported by a particular ecosystem.
  • 37.
    Carrying Capacity Themaximum population of a particular species that a given habitat can support over time.
  • 38.
    Succession A seriesof regular, predictable, quantifiable changes through which communities go • Primary succession : Pioneer species colonize a newly exposed area (lava flows, glacial retreat, dried lake bed). • Secondary succession : The community changes following a disturbance (fire, hurricane, logging).
  • 39.
  • 40.
    1. Open pond2. Plants begin to cover surface; sediment deposited 3. Pond filled by sediment; vegetation grows over site Primary aquatic succession
  • 41.
  • 42.
    Climax Community Thetransitions between stages of succession eventually lead to a climax community . The climax community remains in place, with little modification, until some disturbance restarts succession.
  • 43.
    Biomes The mostimportant factors in a biome are temperature and precipitation. Biomes tend to converge around latitude lines on the globe.
  • 44.
  • 45.
    Temperate deciduous forestTemperature moderate, seasonally variable Precipitation stable through year Trees deciduous: lose leaves in fall, dormant in winter Moderate diversity of broad-leafed trees North America, Europe, China
  • 46.
    Temperate grassland Temperaturemoderate, seasonally variable Precipitation sparse but stable Grasses dominate; few trees Large grazing mammals North America, Asia, South America
  • 47.
    Temperate rainforest Temperaturemoderate Precipitation very high Trees grow tall Dark moist forest interior Pacific northwest region of North America, Japan
  • 48.
    Tropical rainforest Temperaturewarm, seasonally stable Precipitation high Trees tall; forest interior moist and dark Extremely high biodiversity Soil poor in organic matter; is aboveground Equatorial regions
  • 49.
    Tropical dry forestTemperature warm, seasonally stable Precipitation highly seasonally, variable Trees deciduous: dormant in dry season High biodiversity Subtropical latitudes
  • 50.
    Savanna Temperature warmPrecipitation highly seasonal, variable Grassland interspersed with trees Large grazing mammals Africa and other dry tropical regions
  • 51.
    Desert Temperature warmin most, but always highly variable b/w day and night Precipitation extremely low Vegetation sparse; growth depends on periods of rain Organisms adapted to harsh conditions Southwestern region of North America, Australia, Africa
  • 52.
    Tundra Temperature cold,seasonally variable Precipitation very low Vegetation very low and sparse; no trees Low biodiversity; high summer productivity Arctic regions
  • 53.
    Boreal forest Temperaturecool, seasonally variable Precipitation low to moderate Coniferous (evergreen) trees dominate: monotypic forests Low biodiversity; high summer productivity Subarctic regions
  • 54.
    Chaparral Temperature seasonallyvariable Precipitation seasonally variable Evergreen shrubs dominate Plants resistant to fire; burns frequently California, Chile, West Australia
  • 55.
    Altitude creates patternsAs altitude increases, vegetation changes in ways analogous to changes in latitude.
  • 56.
    HUMAN IMPACTS ONTERRESTRIAL BIOMES Human activities have damaged or disturbed more than half of the world’s terrestrial ecosystems. Agriculture Mining Pollution Tourism Depletion of groundwater
  • 57.
    Restoring altered landscapesRestoration ecology - the study of historical conditions of ecological communities that existed before humans altered them. ↓ Ecological restoration - conservation efforts to reverse the effects of human disruption of ecological systems, restore communities to their natural state
  • 58.
    Habitat Restoration Tryingto rebuild what was ruined.                                                                                                                                                                               
  • 59.
    Prairie restoration inWisconsin University of Wisconsin-Madison Arboretum.
  • 60.
    Reclamation Returning vegetationto an area that has been mined or disturbed by human use. This can be done by re-planting, cleaning up pollution, regulations (laws) or any other activity designed to “fix” a destroyed area.

Editor's Notes

  • #36 Figure 3.11 Natural capital: range of tolerance for a population of organisms, such as fish, to an abiotic environmental factor—in this case, temperature. These restrictions keep particular species from taking over an ecosystem by keeping their population size in check.