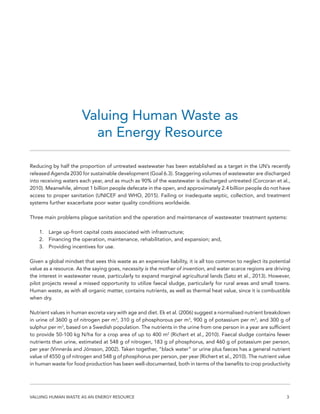
- Human waste contains nutrients and energy value in the form of biogas and dried sludge that can be used as fertilizer and alternative energy sources.
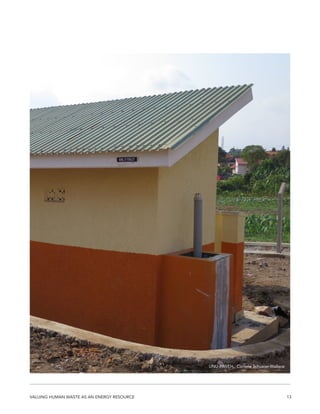
- A framework called "Waste to Wealth" was developed to convert human waste into resources using anaerobic digestion, with a focus on rural areas in Uganda. This provides economic and environmental benefits.
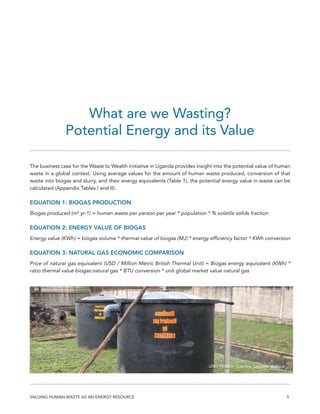
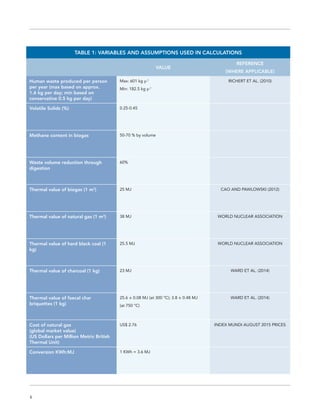
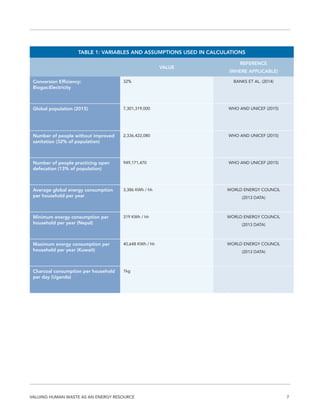
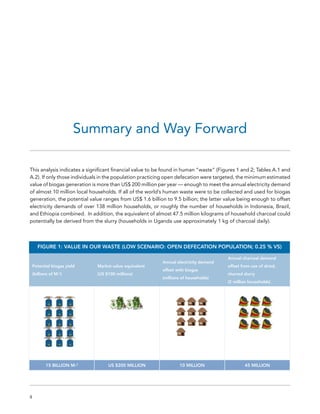
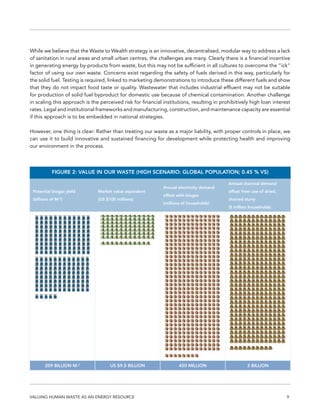
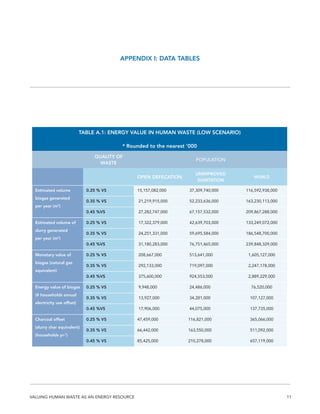
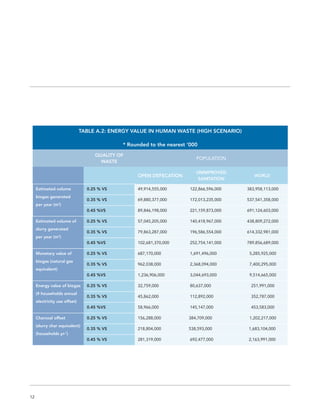
- Calculations show the potential energy value from human waste globally each year based on production rates, conversion efficiencies, and comparison to market values of natural gas. There is significant potential value being wasted without proper waste treatment systems.
The document discusses the concept of ecological footprint as a sustainability indicator. It defines ecological footprint as a measure of human demand on nature, and biocapacity as the capacity of ecosystems to provide resources and absorb waste. It notes that currently humanity uses 1.5 planets worth of resources annually. Ecological footprint accounting can track whether a population's demand exceeds the available biocapacity or results in an ecological deficit or overshoot. The indicator is useful for governments to assess resource use and guide more sustainable policies.
Ecological footprints measure the extent of biologically productive land and sea area required to produce the resources an individual, population or activity consumes and to absorb the corresponding waste, using prevailing technology levels. They are measured in global hectares, where one hectare represents the world average productivity. Current estimates indicate that humans are overshooting Earth's carrying capacity by 25-50% and that at current population growth and consumption rates, we will need 1.5 Earths by 2030 to sustain our footprint.
1. Carrying capacity is defined as the maximum population size that an environment can sustainably support. For humans, carrying capacity is difficult to determine due to variable resource use, technology, trade, and environmental impacts.
2. Some argue technology can continually expand human carrying capacity. Others argue technology only increases efficiency, not long-term capacity, which may decline due to environmental degradation.
3. Ecological footprint measures the land area required to sustain a population's resource use and waste, providing an estimate of human carrying capacity. Most developed nations have footprints exceeding a sustainable global share per person.
The document is a summary of the Living Planet Report 2012 published by the World Wildlife Fund (WWF). It discusses two main indicators used in the report - the Living Planet Index, which shows a decline of 52% in vertebrate populations between 1970-2010, and the Ecological Footprint, which shows humanity uses 50% more than what Earth can renew. It also discusses the main threats to biodiversity as being agricultural expansion, forestry, fishing and climate change. The report calls for action in several areas like preserving natural capital, sustainable production and consumption, equitable governance of resources, and redirecting financial flows to value nature.
This document provides information about Korea's ecological footprint and biocapacity from the Korea Ecological Footprint Report 2016. It discusses how the ecological footprint measures human demand on nature, while biocapacity measures the ecosystems' ability to meet that demand. The key findings are that the average Korean has an ecological footprint eight times larger than Korea's biocapacity, fisheries make up the largest component of Korea's biocapacity, and the carbon footprint makes up 73% of Korea's total ecological footprint.
Ecological Footprint assessment helps to identify what activities are having the biggest impact on nature and opens up possibilities to reduce our impact and live within the means of One Planet. It provides measurement of collective consumption of the population whether they are exceeding the Earth’s ecological limits or not. It is compared with Biocapacity which measures the amount of available bioproductive resources in ecosystem. The introduction of Ecological Footprint has been very necessary for the context of Bangladesh especially in Dhaka as the endless demand and the unplanned consumption pattern of the population here have been producing a very unsustainable situation.
The document discusses ecological footprint, which measures the amount of productive land and sea area required to support a person or population's lifestyle and consumption. It can be used to measure the environmental sustainability of urban or rural areas. The ecological footprint of a city is calculated based on land and sea requirements for housing, transportation, food, goods, services, and other factors. Urbanization tends to increase ecological footprints due to higher resource consumption. The document also provides data on the ecological footprints of various cities and nations from studies conducted in 1997 and 2007.
The document discusses ecological footprints, which measure the amount of productive land and water required to support an individual or entity's lifestyle and waste absorption. It provides data on countries' ecological footprints in global hectares per capita and deficit. The global average footprint exceeds biocapacity by 1.1 global hectares per person. Ecological footprints are estimated based on categories like carbon, food, and goods/services. They help educate about overconsumption and sustainability. Reducing footprints involves actions like using renewable energy and reducing waste and driving.
The document summarizes the Satoyama Initiative, which aims to promote sustainable socio-ecological production landscapes where there are positive interactions between humans and nature. It describes satoyama landscapes that developed from human activities like forestry and agriculture maintaining a mosaic of different land uses. The initiative recognizes the value of these landscapes and aims to maintain and rebuild mechanisms for managing them in a sustainable manner while conserving biodiversity. It proposes gathering case studies, analyses, and developing partnerships to effectively advance the initiative's vision and contribute to global goals.
The document discusses several issues with using the ecological footprint (EF) as a measure of sustainability. It highlights that EF fails to capture important factors like land degradation and the benefits of intensive agricultural production. It also argues that EF comparisons between countries can be misleading as boundaries are arbitrarily determined. Overall, the document asserts that EF is not an ideal tool for measuring sustainability due to these limitations and its failure to be fully inclusive of other relevant indicators.
The Ecological Footprint is a tool that measures humanity's demand on nature against the Earth's supply. It compares our consumption to the planet's biocapacity. In 2005, global footprint exceeded biocapacity, with humanity using 1.5 planets worth of resources. Canada has a footprint higher than world average but remains an "ecological creditor" with more domestic biocapacity. Ontario's 2005 per capita footprint of 8.4 global hectares is higher than Canada's average and would require 4 planets if everyone lived at that rate. Its larger footprint relates partly to consumption levels but also less efficient industries like manufacturing.
The authors argue that Aldo Leopold's vision of an "ethic" guiding humanity's relationship with the land should be extended to global health. Like the environmental challenges of Leopold's time, today's widespread health threats can only be addressed through a shared ethical commitment to health as an interconnected, communal entity. However, society has yet to internalize such a "global health ethic" to unify and sustain progress. Following Leopold, the authors advocate developing an ethic through open debate within society, rather than imposing specific goals, in order to inspire long-term commitment to health for all.
Claire's presentation on biodiversity loss was the best of all of my students'. She used good analysis and exposition, and cited all sources correctly.
Rebuilding the Relationship between People and Nature: The SATOYAMA Initiative
`
For more information, Please see websites below:
`
Organic Edible Schoolyards & Gardening with Children
http://scribd.com/doc/239851214
`
Double Food Production from your School Garden with Organic Tech
http://scribd.com/doc/239851079
`
Free School Gardening Art Posters
http://scribd.com/doc/239851159`
`
Increase Food Production with Companion Planting in your School Garden
http://scribd.com/doc/239851159
`
Healthy Foods Dramatically Improves Student Academic Success
http://scribd.com/doc/239851348
`
City Chickens for your Organic School Garden
http://scribd.com/doc/239850440
`
Simple Square Foot Gardening for Schools - Teacher Guide
http://scribd.com/doc/239851110
Biodiversity, ecosystem services, social sustainability and tipping points in...ILRI
The document discusses biodiversity, ecosystem services, social sustainability, and tipping points in African drylands. It aims to develop a conceptual framework linking policy, land use, and livelihoods through pastoralist decision-making. The objectives are to construct and validate models of pastoralist decision-making, evaluate policy scenarios, and disseminate findings to policymakers and communities. The methods include statistical analysis, modeling household decisions, experiments, and agent-based simulations to explore scenarios around payments for ecosystem services and climate change.
The Carbon Trust was commissioned by Public Health England ( PHE) to help them better understand environmental impacts of the new Eatwell Guide being founded and created .
They wished to obtain a wide ranging but well founded analysis covering complex sets of ingredients. It was considered useful to be able to review the results in light of the current typical UK diet
A look at how nature provides us with services and how valuing these services is important to well-being. Slideshow from Millennium Ecosystem Assessment, UNEP
Wei Liao, PhD
Anaerobic Digestion Research and Education Center (ADREC)
Biosystems and Agricultural Engineering
Michigan State University
January 14th, 2016
This document defines and describes different types of resources. It discusses resources as anything that satisfies human needs and wants, including materials, energy, services, staff, knowledge, and assets. Resources have the key characteristics of utility, limited availability, and potential for depletion or consumption. The document then defines and provides examples of different specific types of resources, including natural resources, biological resources, economic resources, human resources, land resources, soil resources, and discusses sustainable development and resource planning.
This document discusses ecological footprints and how to measure them. An ecological footprint calculates the amount of productive land and water required to support a population based on its consumption and waste production using current technology. The document notes that global footprints exceeded the Earth's carrying capacity in the mid-1980s. It provides ecological footprint sizes for various countries, with the highest footprints belonging to Qatar, the USA, and Australia.
This document provides an overview of the ecological footprint, a tool created by William Rees and Mathis Wackernagel to measure human demand on the biosphere. The ecological footprint measures the amount of biologically productive land and sea area required to support human consumption and waste absorption. It indicates that humanity is currently in global ecological overshoot, using more than what the Earth can regenerate. The document discusses the methodology, components, and implications of ecological footprint accounting.
The document provides an overview of the ecological footprint concept. It defines ecological footprint as a method that measures human demand on nature against the Earth's biological capacity to regenerate resources and absorb waste. Key points include:
- Humanity's ecological footprint has exceeded the Earth's biocapacity since the 1970s, meaning more than 1 Earth is needed each year to replenish what is used.
- The ecological footprint is calculated by adding up the productive land and sea area required to produce the resources an individual, group, or activity consumes and absorb their waste, expressed in global hectares.
- Many countries and individuals have an ecological deficit, using more than what local ecosystems can regenerate.
This chapter introduces concepts related to environmental sustainability. It discusses how deforestation on Easter Island led to societal collapse, providing a lesson about unsustainable practices. It then defines ecological footprint and explains how this measures human demand on natural resources. Four global trends are identified as particularly concerning: population growth, decline of ecosystems, atmospheric changes, and loss of biodiversity. The chapter presents the Millennium Ecosystem Assessment framework for understanding links between human well-being and ecosystem services and the need for conservation. It outlines strategic themes and integrative dimensions to consider in forging a sustainable future.
The document discusses different types of resources. It defines a resource as anything that can satisfy a need. Resources are classified as natural, human-made, and human. Natural resources are further divided based on development, origin, distribution, and whether they are renewable or non-renewable. The document emphasizes the importance of resource conservation and sustainable development. It provides examples and activities to illustrate different types of resources.
Economics of Green Infrastructure (GI) presentation by Patrick ten Brink of the Institute for European Environmental Policy at the European Parliament 24 September 2013
Ecosystem services and natural capital – the foundation of a green economy Marianne Kettunen
This document discusses how ecosystem services and natural capital are integral to establishing a green economy. It defines ecosystem services as the benefits people obtain from ecosystems, such as food, water, and recreation. Natural capital refers to the stock of natural resources and ecosystems that provide a flow of ecosystem services. A green economy aims to improve human well-being while reducing environmental risks. The document argues that a green economy must value and protect natural capital and the ecosystem services it provides. It provides several examples of the economic value of ecosystem services in order to illustrate how fully integrating them into policymaking can help build a truly green economy.
'Presentation Kettunen & ten Brink at Iddri May 07 on the Values of Biodiversity Related Ecosystem Services. Enhancing the integration of biodiversity into policy and decision-making
The document discusses climate equity and the impacts of climate change. It notes that 14 of the 15 warmest years on record have occurred in the 21st century. It then summarizes the key causes of climate change, including greenhouse gases and their unprecedented rise. The document outlines Pakistan's vulnerability to climate change in terms of water security, food security, energy security, and national security. It highlights examples of community-based climate adaptation, mitigation, and green development projects in northern Pakistan. The document concludes by discussing the need for global institutional support and Pakistan's intended nationally determined contributions to climate change mitigation.
The document discusses climate equity and climate change impacts in Pakistan. It summarizes that 14 of the 15 warmest years on record have occurred in the 21st century. It then outlines the key causes of climate change including greenhouse gases and their unprecedented rise. The document discusses Pakistan's vulnerability to climate change in terms of water security, food security, energy security, and national security. It provides examples of community-based climate change adaptation and mitigation projects in northern Pakistan. These include climate compatible irrigation infrastructure, community-owned clean energy utilities, agroforestry projects, and disaster response programs. The document advocates for global institutional support for climate action and for Pakistan to outline climate policies and goals in its Intended Nationally Determined
This document provides an overview and introduction to a report on the water footprint of Italy. It discusses key concepts around virtual water and water footprinting. It notes that the water footprint of national production in Italy is around 70 billion m3 per year, with agriculture being the largest user at 85% of the total footprint. The focus of the report will be analyzing Italy's water use, promoting more sustainable management of water resources, and increasing awareness of virtual water flows and impacts on water systems.
This document discusses the ecological footprints of the United Arab Emirates and Philippines. It begins with introducing ecological footprint as a measure of human demand on ecosystems compared to their regenerative capacity. The UAE has the world's highest per capita footprint of 10.68 global hectares due to its rapid development and reliance on imports. It launched an initiative to study and reduce its footprint. The Philippines' footprint exceeds its domestic biocapacity, increasing ecological deficit over time. Key drivers are examined for both countries' footprints.
The EF compares human demand on nature with nature’s regenerative capacity.
It is a measure of the demands and the consumption of natural resources by people.
The sizes of ecological footprint vary from country to country and from person to person.
Food systems and natural resources-2016 Food Security and Climate change im...New Food Innovation Ltd
"We are what we eat, they say . Our Existence and, therefore, any of aspirations we might have as a society depend on the availability of , and access to, food. At the same time , our food depends on the state of natural resources .The Food we grow, harvest and trade , transport , store , sell and consumer is therefore one of the essential connecting threads between culture and wellbeing, their health and that of the planet
Resource recycling and waste-to-energy: The cornerstones of circular economyIJRTEMJOURNAL
"Circular Economy" is the pursued goal of sustainable development of mankind for the 21st
century. In short, the fundamental spirit of circular economy is the concept of "Zero Waste". The example used
in our daily lives means 100% of waste treatment, leaving no trace. At this time, it would be an ideal goal that
the waste could be fully recovered into available raw materials or energies. In particular, "waste-to-energy" is
a key factor, because all the wastes are almost related to energy. Resource recycling of waste metal from the
household garbage is the best example. When smelting metals, the refining industry needs to reduce the metal
oxides (mineral materials) to metals, such as steel, aluminium, copper, etc. The reduction processes consume
considerable portion of energy for the entire smelting process, for example, 70.6% for steel and 77.4% for
aluminium. However, if the waste metallic products can be fully recovered, as long as by melting and reshaping,
the original oxide metal reduction processes that consume a lot of energy can be avoided. On the other hand,
when the general garbage cannot be recovered as a resource, they can be converted into fuel or electricity by
biological or thermal treatment. Another more important human waste utilization is the waste paper recycling.
The production of one tonne of raw pulp emits about 6 tonnes of carbon, consuming about 100 cubic meters of
water, using about 200 kilograms of chemical raw materials, and draining 300 tonnes of toxic waste water. The
entire papermaking process is how terrible environmental pollution! The recycled pulp of one tonne can save
energy 10-13GJ.The proportion of paper waste in Taiwan 2015 is 34.69% and the estimated amount is 2.5
million tonnes. If the paper waste could be fully recycled, it could save energy about 0.725 million kloe (kilolitre oil equivalent). In other words, it virtually reduces Taiwan's oil imports of 4.56 million barrels and CO2
emissions of 2.5 million tonnes annually.
This document summarizes the key findings of the 2010 edition of the Ecological Footprint Atlas published by Global Footprint Network. It finds that humanity is currently in global ecological overshoot, using more resources than the Earth can renew. This overshoot puts increasing pressure on critical ecosystems and risks shortages of essential resources. The document advocates for governments and organizations to use Ecological Footprint accounting to better understand their resource demands and dependencies to guide more sustainable economic development and policy within planetary boundaries. It highlights improvements made to the National Footprint Accounts methodology in the 2010 edition and outlines how governments can utilize their Ecological Footprint data to secure long-term economic success and resilience in a resource-constrained world.
This document discusses reducing the environmental impact of caring for patients with kidney disease. It presents a position statement from the Italian Society of Nephrology with 10 initial actions focused on more sustainable dialysis management: 1) reducing the need for dialysis through conservative strategies; 2) limiting drugs and favoring lifestyle/diet approaches; 3) encouraging reuse of hospital materials; 4) recycling paper and glass; 5) recycling non-contaminated plastic; 6) reducing water use; 7) reducing energy use; 8) including environmental criteria in evaluating dialysis machines; 9) properly sorting contaminated and non-contaminated waste; 10) considering environmental impacts in facility construction. The statement aims to increase awareness and coordinate industry/social
This document discusses reducing the environmental impact of caring for patients with kidney disease. It presents a position statement from the Italian Society of Nephrology with 10 initial actions focused on dialysis management: 1) reducing the need for dialysis through conservative strategies; 2) limiting drugs and favoring lifestyle/diet approaches; 3) encouraging reuse of hospital materials; 4) recycling paper and glass; 5) recycling non-contaminated plastic; 6) reducing water usage; 7) reducing energy usage; 8) including environmental criteria when evaluating dialysis machines; 9) properly sorting contaminated and non-contaminated waste; 10) considering environmental impacts in facility construction. The statement aims to increase awareness and coordinate industry/social interactions to
Overconsumption: Our use of the Worlds Natural ResourcesDr Lendy Spires
The document discusses the history of human resource use from hunter-gatherer societies to modern industrial societies. It finds that resource consumption per capita has increased dramatically over time, from around 1 tonne per year for hunter-gatherers to over 15-30 tonnes currently for people in industrialized nations. The industrial revolution significantly increased resource use with the introduction of fossil fuels like coal and oil, providing much more energy. While early agrarian and hunter-gatherer societies relied mainly on renewable resources, modern industrial societies have greatly increased their extraction and consumption of both renewable and non-renewable global resources.
From "Greening" the present system to real transformation, Anders Wijkman et. alEnergy for One World
The document summarizes key points from the Earth4All report, which follows up on The Limits to Growth 50 years later. It recommends five turnarounds needed for planetary stability and human wellbeing: 1) halving greenhouse gas emissions each decade through clean energy, 2) becoming nature positive in food systems by 2030, 3) adopting new economic models, 4) reducing inequality, and 5) empowering women and investing in education. These turnarounds must be underpinned by radically transforming resource management, as resource extraction drives environmental challenges and will drastically increase without action. The world must learn to provide human wellbeing without exceeding planetary boundaries.
Energy And Water Quality Of Municipal Water Supply And...Alison Reed
The document discusses four key topics:
1) Four main groups of microalgae: red, green, brown, and diatoms
2) Using microalgae to treat industrial wastewater which contains high levels of pollutants
3) The textile industry generates large volumes of wastewater that can be treated with microalgae
4) Two methods for wastewater treatment - activated carbon and constructed wetlands
1. The document proposes Agri-Parks and Agri-Hubs as cooperatives that apply agroecology principles to sustainably meet food, fuel, and fiber needs locally.
2. Agri-Hubs would be centered around four pillars of sustainable development and consist of clustered agroecology activities managed by skilled local cooperatives.
3. They would provide training, production, processing, marketing and other services to members and the community while promoting environmental restoration, self-sufficiency, and social well-being.
Futre Of Agroforestry Science Dg Seminarguestd2d93b8
The document discusses how major institutions are increasingly recognizing agroforestry's potential to address issues like climate change, poverty, and land degradation. Climate change in particular is driving interest, as agriculture and forestry account for 20% of greenhouse gas emissions. The author argues agroforestry can transform farming by increasing carbon storage through reduced tillage and more trees. Adopting agroforestry worldwide could offset 1 gigaton of annual carbon emissions. The document predicts agroforestry will become seen as central to addressing climate change and sustainability goals.
The document discusses how climate change is driving major institutions like the World Bank to partner with the World Agroforestry Centre (WAC) due to agroforestry's potential role in mitigation and adaptation. It notes that 20% of greenhouse gases come from land use change and deforestation. To address climate change, agriculture systems will need to reverse carbon losses by sequestering more carbon above and below ground through practices like agroforestry. The WAC is well-positioned to provide solutions through its research on integrating trees into agricultural landscapes to improve livelihoods and the environment. The WAC is in the process of developing a new strategic plan focused on using science to understand and promote agrofore
The document discusses how major institutions are increasingly recognizing agroforestry's potential to address issues like climate change, poverty, and land degradation. Climate change in particular is driving interest, as agriculture and forestry account for 20% of greenhouse gas emissions. The rising threat of climate change means farming systems worldwide will need to reverse carbon emissions through practices like agroforestry that store carbon in soils and vegetation. Agroforestry thus offers a way to simultaneously combat climate change and poverty through sustainable land use.
The ecological footprint measures humanity's demand on natural resources and how much land and water is required to produce what we consume and absorb our waste. Since the 1980s, humanity's annual demand has exceeded what the Earth can regenerate. It now takes 1.5 years for the Earth to regenerate what we use in one year. The ecological footprint was conceived in 1990 to measure our pressure on the planet and encourage living within Earth's limits to support long-term sustainability.
Planetary boundaries are nine Earth system processes identified as being critical for human society and the planet. Three of the nine boundaries cited in the document are biodiversity loss, climate change, and pollution. Biodiversity refers to genetic diversity within species, species diversity, and ecosystem diversity, and it underpins crucial ecosystem services that humans rely on. The current rate of species extinction is estimated to be hundreds to thousands of times higher than the natural background rate, constituting a sixth mass extinction. Five drivers of biodiversity loss are discussed: land-use change, overexploitation, climate change, pollution, and invasive species. Business impacts and relies on biodiversity through its activities and value chains, so it must consider both mitigating
Similar to Valuing human-waste-as-an-energy-resource-web (20)
hematic appreciation test is a psychological assessment tool used to measure an individual's appreciation and understanding of specific themes or topics. This test helps to evaluate an individual's ability to connect different ideas and concepts within a given theme, as well as their overall comprehension and interpretation skills. The results of the test can provide valuable insights into an individual's cognitive abilities, creativity, and critical thinking skills
Unlocking the mysteries of reproduction: Exploring fecundity and gonadosomati...AbdullaAlAsif1
The pygmy halfbeak Dermogenys colletei, is known for its viviparous nature, this presents an intriguing case of relatively low fecundity, raising questions about potential compensatory reproductive strategies employed by this species. Our study delves into the examination of fecundity and the Gonadosomatic Index (GSI) in the Pygmy Halfbeak, D. colletei (Meisner, 2001), an intriguing viviparous fish indigenous to Sarawak, Borneo. We hypothesize that the Pygmy halfbeak, D. colletei, may exhibit unique reproductive adaptations to offset its low fecundity, thus enhancing its survival and fitness. To address this, we conducted a comprehensive study utilizing 28 mature female specimens of D. colletei, carefully measuring fecundity and GSI to shed light on the reproductive adaptations of this species. Our findings reveal that D. colletei indeed exhibits low fecundity, with a mean of 16.76 ± 2.01, and a mean GSI of 12.83 ± 1.27, providing crucial insights into the reproductive mechanisms at play in this species. These results underscore the existence of unique reproductive strategies in D. colletei, enabling its adaptation and persistence in Borneo's diverse aquatic ecosystems, and call for further ecological research to elucidate these mechanisms. This study lends to a better understanding of viviparous fish in Borneo and contributes to the broader field of aquatic ecology, enhancing our knowledge of species adaptations to unique ecological challenges.
The debris of the ‘last major merger’ is dynamically youngSérgio Sacani
The Milky Way’s (MW) inner stellar halo contains an [Fe/H]-rich component with highly eccentric orbits, often referred to as the
‘last major merger.’ Hypotheses for the origin of this component include Gaia-Sausage/Enceladus (GSE), where the progenitor
collided with the MW proto-disc 8–11 Gyr ago, and the Virgo Radial Merger (VRM), where the progenitor collided with the
MW disc within the last 3 Gyr. These two scenarios make different predictions about observable structure in local phase space,
because the morphology of debris depends on how long it has had to phase mix. The recently identified phase-space folds in Gaia
DR3 have positive caustic velocities, making them fundamentally different than the phase-mixed chevrons found in simulations
at late times. Roughly 20 per cent of the stars in the prograde local stellar halo are associated with the observed caustics. Based
on a simple phase-mixing model, the observed number of caustics are consistent with a merger that occurred 1–2 Gyr ago.
We also compare the observed phase-space distribution to FIRE-2 Latte simulations of GSE-like mergers, using a quantitative
measurement of phase mixing (2D causticality). The observed local phase-space distribution best matches the simulated data
1–2 Gyr after collision, and certainly not later than 3 Gyr. This is further evidence that the progenitor of the ‘last major merger’
did not collide with the MW proto-disc at early times, as is thought for the GSE, but instead collided with the MW disc within
the last few Gyr, consistent with the body of work surrounding the VRM.
Or: Beyond linear.
Abstract: Equivariant neural networks are neural networks that incorporate symmetries. The nonlinear activation functions in these networks result in interesting nonlinear equivariant maps between simple representations, and motivate the key player of this talk: piecewise linear representation theory.
Disclaimer: No one is perfect, so please mind that there might be mistakes and typos.
dtubbenhauer@gmail.com
Corrected slides: dtubbenhauer.com/talks.html
The binding of cosmological structures by massless topological defectsSérgio Sacani
Assuming spherical symmetry and weak field, it is shown that if one solves the Poisson equation or the Einstein field
equations sourced by a topological defect, i.e. a singularity of a very specific form, the result is a localized gravitational
field capable of driving flat rotation (i.e. Keplerian circular orbits at a constant speed for all radii) of test masses on a thin
spherical shell without any underlying mass. Moreover, a large-scale structure which exploits this solution by assembling
concentrically a number of such topological defects can establish a flat stellar or galactic rotation curve, and can also deflect
light in the same manner as an equipotential (isothermal) sphere. Thus, the need for dark matter or modified gravity theory is
mitigated, at least in part.
The use of Nauplii and metanauplii artemia in aquaculture (brine shrimp).pptxMAGOTI ERNEST
Although Artemia has been known to man for centuries, its use as a food for the culture of larval organisms apparently began only in the 1930s, when several investigators found that it made an excellent food for newly hatched fish larvae (Litvinenko et al., 2023). As aquaculture developed in the 1960s and ‘70s, the use of Artemia also became more widespread, due both to its convenience and to its nutritional value for larval organisms (Arenas-Pardo et al., 2024). The fact that Artemia dormant cysts can be stored for long periods in cans, and then used as an off-the-shelf food requiring only 24 h of incubation makes them the most convenient, least labor-intensive, live food available for aquaculture (Sorgeloos & Roubach, 2021). The nutritional value of Artemia, especially for marine organisms, is not constant, but varies both geographically and temporally. During the last decade, however, both the causes of Artemia nutritional variability and methods to improve poorquality Artemia have been identified (Loufi et al., 2024).
Brine shrimp (Artemia spp.) are used in marine aquaculture worldwide. Annually, more than 2,000 metric tons of dry cysts are used for cultivation of fish, crustacean, and shellfish larva. Brine shrimp are important to aquaculture because newly hatched brine shrimp nauplii (larvae) provide a food source for many fish fry (Mozanzadeh et al., 2021). Culture and harvesting of brine shrimp eggs represents another aspect of the aquaculture industry. Nauplii and metanauplii of Artemia, commonly known as brine shrimp, play a crucial role in aquaculture due to their nutritional value and suitability as live feed for many aquatic species, particularly in larval stages (Sorgeloos & Roubach, 2021).
Authoring a personal GPT for your research and practice: How we created the Q...Leonel Morgado
Thematic analysis in qualitative research is a time-consuming and systematic task, typically done using teams. Team members must ground their activities on common understandings of the major concepts underlying the thematic analysis, and define criteria for its development. However, conceptual misunderstandings, equivocations, and lack of adherence to criteria are challenges to the quality and speed of this process. Given the distributed and uncertain nature of this process, we wondered if the tasks in thematic analysis could be supported by readily available artificial intelligence chatbots. Our early efforts point to potential benefits: not just saving time in the coding process but better adherence to criteria and grounding, by increasing triangulation between humans and artificial intelligence. This tutorial will provide a description and demonstration of the process we followed, as two academic researchers, to develop a custom ChatGPT to assist with qualitative coding in the thematic data analysis process of immersive learning accounts in a survey of the academic literature: QUAL-E Immersive Learning Thematic Analysis Helper. In the hands-on time, participants will try out QUAL-E and develop their ideas for their own qualitative coding ChatGPT. Participants that have the paid ChatGPT Plus subscription can create a draft of their assistants. The organizers will provide course materials and slide deck that participants will be able to utilize to continue development of their custom GPT. The paid subscription to ChatGPT Plus is not required to participate in this workshop, just for trying out personal GPTs during it.
EWOCS-I: The catalog of X-ray sources in Westerlund 1 from the Extended Weste...Sérgio Sacani
Context. With a mass exceeding several 104 M⊙ and a rich and dense population of massive stars, supermassive young star clusters
represent the most massive star-forming environment that is dominated by the feedback from massive stars and gravitational interactions
among stars.
Aims. In this paper we present the Extended Westerlund 1 and 2 Open Clusters Survey (EWOCS) project, which aims to investigate
the influence of the starburst environment on the formation of stars and planets, and on the evolution of both low and high mass stars.
The primary targets of this project are Westerlund 1 and 2, the closest supermassive star clusters to the Sun.
Methods. The project is based primarily on recent observations conducted with the Chandra and JWST observatories. Specifically,
the Chandra survey of Westerlund 1 consists of 36 new ACIS-I observations, nearly co-pointed, for a total exposure time of 1 Msec.
Additionally, we included 8 archival Chandra/ACIS-S observations. This paper presents the resulting catalog of X-ray sources within
and around Westerlund 1. Sources were detected by combining various existing methods, and photon extraction and source validation
were carried out using the ACIS-Extract software.
Results. The EWOCS X-ray catalog comprises 5963 validated sources out of the 9420 initially provided to ACIS-Extract, reaching a
photon flux threshold of approximately 2 × 10⁻⁸ photons cm−2
s
−1
. The X-ray sources exhibit a highly concentrated spatial distribution,
with 1075 sources located within the central 1 arcmin. We have successfully detected X-ray emissions from 126 out of the 166 known
massive stars of the cluster, and we have collected over 71 000 photons from the magnetar CXO J164710.20-455217.
Remote Sensing and Computational, Evolutionary, Supercomputing, and Intellige...University of Maribor
Slides from talk:
Aleš Zamuda: Remote Sensing and Computational, Evolutionary, Supercomputing, and Intelligent Systems.
11th International Conference on Electrical, Electronics and Computer Engineering (IcETRAN), Niš, 3-6 June 2024
Inter-Society Networking Panel GRSS/MTT-S/CIS Panel Session: Promoting Connection and Cooperation
https://www.etran.rs/2024/en/home-english/
aziz sancar nobel prize winner: from mardin to nobel
Valuing human-waste-as-an-energy-resource-web
1. Valuing Human Waste as
an Energy Resource
A RESEARCH BRIEF ASSESSING THE GLOBAL WEALTH IN WASTE
2. United Nations University
Institute for Water, Environment and Health (UNU-INWEH)
Valuing Human Waste as an Energy Resource
A Research Brief Assessing the Global Wealth in Waste
4. 3VALUING HUMAN WASTE AS AN ENERGY RESOURCE
Valuing Human Waste as
an Energy Resource
Reducing by half the proportion of untreated wastewater has been established as a target in the UN’s recently
released Agenda 2030 for sustainable development (Goal 6.3). Staggering volumes of wastewater are discharged
into receiving waters each year, and as much as 90% of the wastewater is discharged untreated (Corcoran et al.,
2010). Meanwhile, almost 1 billion people defecate in the open, and approximately 2.4 billion people do not have
access to proper sanitation (UNICEF and WHO, 2015). Failing or inadequate septic, collection, and treatment
systems further exacerbate poor water quality conditions worldwide.
Three main problems plague sanitation and the operation and maintenance of wastewater treatment systems:
1. Large up-front capital costs associated with infrastructure;
2. Financing the operation, maintenance, rehabilitation, and expansion; and,
3. Providing incentives for use.
Given a global mindset that sees this waste as an expensive liability, it is all too common to neglect its potential
value as a resource. As the saying goes, necessity is the mother of invention, and water scarce regions are driving
the interest in wastewater reuse, particularly to expand marginal agricultural lands (Sato et al., 2013). However,
pilot projects reveal a missed opportunity to utilize faecal sludge, particularly for rural areas and small towns.
Human waste, as with all organic matter, contains nutrients, as well as thermal heat value, since it is combustible
when dry.
Nutrient values in human excreta vary with age and diet. Ek et al. (2006) suggest a normalised nutrient breakdown
in urine of 3600 g of nitrogen per m3
, 310 g of phosphorous per m3
, 900 g of potassium per m3
, and 300 g of
sulphur per m3
, based on a Swedish population. The nutrients in the urine from one person in a year are sufficient
to provide 50-100 kg N/ha for a crop area of up to 400 m2
(Richert et al., 2010). Faecal sludge contains fewer
nutrients than urine, estimated at 548 g of nitrogen, 183 g of phosphorus, and 460 g of potassium per person,
per year (Vinnerås and Jönsson, 2002). Taken together, “black water” or urine plus faeces has a general nutrient
value of 4550 g of nitrogen and 548 g of phosphorus per person, per year (Richert et al., 2010). The nutrient value
in human waste for food production has been well-documented, both in terms of the benefits to crop productivity
5. 4
(for example, a 2-6 fold increase in relative yield, depending on the crop type) and cost benefit analysis (Richert
et al., 2010). Human waste is utilised for food production in various forms around the world, with guidelines for
ensuring its safe use (WHO, 2006).
The potential energy value of human waste has been given less attention to date and its benefits are less likely
to be appreciated. There are two potential sources of energy from human waste. “Biogas” is generated through
anaerobic (oxygen free) digestion resulting from bacteria breakdown of faecal matter and any other organic
material. Biogas is approximately 60% methane by volume and has an average thermal value of 25MJ per m3
(Cao
and Powlowski, 2012). Dried and charred faecal sludge has been found to have similar energy content to coal
and charcoal, with a heating value of approximately 25 MJ/kg, depending on the temperature at which charring
occurs (Ward et al., 2014). This is an extremely important observation. While biogas has been harnessed in many
large municipal wastewater treatment plants, and some countries have undertaken concerted (and successful)
efforts to develop household biogas systems using either animal or human faeces, there has been little uptake
of processed faecal sludge as an alternative to coal and charcoal. Given that the global production of fuelwood
reached 1.9 billion cubic metres in 2013 (World Bioenergy Association, 2015) and that deforestation is contributing
to soil and land degradation, as well as declining water quality, the use of dried sludge as an alternative energy
source is a significant social, environmental, and economic opportunity.
In this context, a “Waste to Wealth”1
national framework for Uganda was developed by UNU-INWEH with a
seed grant from federally-funded Grand Challenges Canada and in partnership with the Ugandan Ministry of
Water and Environment, its agencies, and other NGO and academic partners. Waste to Wealth makes a case for
using modern bioenergy technologies to convert human and other organic wastes into resources that provide
economic benefits, as well as protecting the environment and human health. It is founded in the application of
anaerobic digestion technologies linked to sanitation systems. With a focus on rural growth centers and small
towns in Uganda, as well as high population density institutions such as schools and prisons, the biogas and
residual material left from energy conversion will be used as a resource with economic value to provide the
return on investment necessary to improve sanitation. The ultimate goal of Waste to Wealth is self-financing
and sustaining decentralised (on site) faecal waste management in Uganda. By identifying the value in waste for
energy and/or fertiliser, Waste to Wealth provides an incentive to use toilets and a mechanism to finance the
capital costs as well as operation, maintenance, and expansion of sanitation infrastructure. In addition to the
economic opportunities, sanitation interventions have known benefits to individual, household, and community
health and wellbeing (Hutton, 2015).
1 Initial proof of concept funded through a Government of Canada supported Grand Challenges Canada grant.
For more information: www.inweh.unu.edu/waste-to-wealth
6. 5VALUING HUMAN WASTE AS AN ENERGY RESOURCE
The business case for the Waste to Wealth initiative in Uganda provides insight into the potential value of human
waste in a global context. Using average values for the amount of human waste produced, conversion of that
waste into biogas and slurry, and their energy equivalents (Table 1), the potential energy value in waste can be
calculated (Appendix Tables I and II):
EQUATION 1: BIOGAS PRODUCTION
Biogas produced (m3
yr-1) = human waste per person per year * population * % volatile solids fraction
EQUATION 2: ENERGY VALUE OF BIOGAS
Energy value (KWh) = biogas volume * thermal value of biogas (MJ) * energy efficiency factor * KWh conversion
EQUATION 3: NATURAL GAS ECONOMIC COMPARISON
Price of natural gas equivalent (USD / Million Metric British Thermal Unit) = Biogas energy equivalent (KWh) *
ratio thermal value biogas:natural gas * BTU conversion * unit global market value natural gas
What are we Wasting?
Potential Energy and its Value
UNU-INWEH, Corinne Schuster-Wallace
7. 6
TABLE 1: VARIABLES AND ASSUMPTIONS USED IN CALCULATIONS
VALUE
REFERENCE
(WHERE APPLICABLE)
Human waste produced per person
per year (max based on approx.
1.6 kg per day; min based on
conservative 0.5 kg per day)
Max: 601 kg y-1
Min: 182.5 kg y-1
RICHERT ET AL. (2010)
Volatile Solids (%) 0.25-0.45
Methane content in biogas 50-70 % by volume
Waste volume reduction through
digestion
60%
Thermal value of biogas (1 m3
) 25 MJ CAO AND PAWLOWSKI (2012)
Thermal value of natural gas (1 m3
) 38 MJ WORLD NUCLEAR ASSOCIATION
Thermal value of hard black coal (1
kg)
25.5 MJ WORLD NUCLEAR ASSOCIATION
Thermal value of charcoal (1 kg) 23 MJ WARD ET AL. (2014)
Thermal value of faecal char
briquettes (1 kg)
25.6 ± 0.08 MJ (at 300 °C); 3.8 ± 0.48 MJ
(at 750 °C)
WARD ET AL. (2014)
Cost of natural gas
(global market value)
(US Dollars per Million Metric British
Thermal Unit)
US$ 2.76 INDEX MUNDI AUGUST 2015 PRICES
Conversion KWh:MJ 1 KWh = 3.6 MJ
8. 7VALUING HUMAN WASTE AS AN ENERGY RESOURCE
TABLE 1: VARIABLES AND ASSUMPTIONS USED IN CALCULATIONS
VALUE
REFERENCE
(WHERE APPLICABLE)
Conversion Efficiency:
Biogas:Electricity
32% BANKS ET AL. (2014)
Global population (2015) 7,301,319,000 WHO AND UNICEF (2015)
Number of people without improved
sanitation (32% of population)
2,336,422,080 WHO AND UNICEF (2015)
Number of people practicing open
defecation (13% of population)
949,171,470 WHO AND UNICEF (2015)
Average global energy consumption
per household per year
3,386 KWh / hh WORLD ENERGY COUNCIL
(2013 DATA)
Minimum energy consumption per
household per year (Nepal)
319 KWh / hh WORLD ENERGY COUNCIL
(2013 DATA)
Maximum energy consumption per
household per year (Kuwait)
40,648 KWh / hh WORLD ENERGY COUNCIL
(2013 DATA)
Charcoal consumption per household
per day (Uganda)
1kg
9. 8
This analysis indicates a significant financial value to be found in human “waste” (Figures 1 and 2; Tables A.1 and
A.2). If only those individuals in the population practicing open defecation were targeted, the minimum estimated
value of biogas generation is more than US$ 200 million per year — enough to meet the annual electricity demand
of almost 10 million local households. If all of the world’s human waste were to be collected and used for biogas
generation, the potential value ranges from US$ 1.6 billion to 9.5 billion; the latter value being enough to offset
electricity demands of over 138 million households, or roughly the number of households in Indonesia, Brazil,
and Ethiopia combined. In addition, the equivalent of almost 47.5 million kilograms of household charcoal could
potentially be derived from the slurry (households in Uganda use approximately 1 kg of charcoal daily).
Summary and Way Forward
FIGURE 1: VALUE IN OUR WASTE (LOW SCENARIO: OPEN DEFECATION POPULATION; 0.25 % VS)
Potential biogas yield
(billions of M-3
)
Market value equivalent
(US $100 millions)
Annual electricity demand
offset with biogas
(millions of households)
Annual charcoal demand
offset from use of dried,
charred slurry
(5 million households)
Human waste produced
per person per year (max
based on approx. 1.6 kg
per day; min based on
conservative 0.5 kg per
day)
15 BILLION M-3
US $200 MILLION 10 MILLION 45 MILLION
10. 9VALUING HUMAN WASTE AS AN ENERGY RESOURCE
While we believe that the Waste to Wealth strategy is an innovative, decentralised, modular way to address a lack
of sanitation in rural areas and small urban centres, the challenges are many. Clearly there is a financial incentive
in generating energy by-products from waste, but this may not be sufficient in all cultures to overcome the “ick”
factor of using our own waste. Concerns exist regarding the safety of fuels derived in this way, particularly for
the solid fuel. Testing is required, linked to marketing demonstrations to introduce these different fuels and show
that they do not impact food taste or quality. Wastewater that includes industrial effluent may not be suitable
for production of solid fuel byproduct for domestic use because of chemical contamination. Another challenge
in scaling this approach is the perceived risk for financial institutions, resulting in prohibitively high loan interest
rates. Legal and institutional frameworks and manufacturing, construction, and maintenance capacity are essential
if this approach is to be embedded in national strategies.
However, one thing is clear: Rather than treating our waste as a major liability, with proper controls in place, we
can use it to build innovative and sustained financing for development while protecting health and improving
our environment in the process.
FIGURE 2: VALUE IN OUR WASTE (HIGH SCENARIO: GLOBAL POPULATION; 0.45 % VS)
Potential biogas yield
(billions of M-3
)
Market value equivalent
(US $100 millions)
Annual electricity demand
offset with biogas
(millions of households)
Annual charcoal demand
offset from use of dried,
charred slurry
(5 million households)
Human waste produced
per person per year (max
based on approx. 1.6 kg
per day; min based on
conservative 0.5 kg per
day)
209 BILLION M-3
US $9.5 BILLION 450 MILLION 2 BILLION
11. 10
REFERENCES
Ek M., Bergström R., Bjurhem J.-E., Björlenius B. and Hellström D. 2006. Concentration of nutrients from urine and reject water
from anaerobically digested sludge. Water Science & Technology, 54(11-12):437–444. doi:10.2166/wst.2006.924.
Cao Y. and Pawłowski A. 2012. Sewage sludge-to-energy approaches based on anaerobic digestion and pyrolysis: Brief
overview and energy efficiency assessment. Renewable and Sustainable Energy Reviews, 16(3):1657-1665.
http://dx.doi.org/10.1016/j.rser.2011.12.014.
Corcoran E., Nellemann C., Baker E., Bos R., Osborn D. and Savelli H. (eds). 2010. Sick Water? The central role of wastewater
management in sustainable development. A Rapid Response Assessment. United Nations Environment Programme,
UN-HABITAT, GRID-Arendal. www.grida.no.
Hutton G. 2015. Benefits and Costs of the Water Sanitation and Hygiene Targets for the Post-2015 Development Agenda.
Post-2015 Consensus. Copenhagen Consensus Centre Working Report (Draft).
Richert A., Gensch R., Jönsson H., Stenström T.-A. and Dagerskog L. 2010. Practical Guidance on the Use of Urine in Crop
Production. Stockholm Environment Institute, EcoSanRes Series, 2010-1.
Sato T., Qadir M., Yamamoto S., Endo T. and Zahoor A. 2013. Global, regional, and country level need for data on wastewater
generation, treatment, and use. Agricultural Water Management, 130:1-13.
http://dx.doi.org/10.1016/j.agwat.2013.08.007.
UNICEF and WHO. 2015. Progress on Sanitation and Drinking Water; 2015 Update and MDG Assessment. UNICEF and WHO.
Available from: http://www.wssinfo.org/fileadmin/user_upload/resources/JMP-Update-report-2015_English.pdf.
Vinnerås B. and Jönsson H. 2002. The performance and potential of faecal separation and urine diversion to recycle plant
nutrients in household wastewater. Bioresource Technology, 84(3):275-282.
http://dx.doi.org/10.1016/S0960-8524(02)00054-8.
Ward B.J., Tesfayohanes Y.W. and Montoya L.D. 2014. Evaluation of Solid Fuel Char Briquettes from Human Waste. Environ.
Sci. Technol. 48(16):9852–9858. DOI: 10.1021/es500197h.
WHO and UNICEF. 2015. Progress on sanitation and drinking water – 2015 update and MDG assessment. New York, USA,
World Health Organization.
World Bioenergy Association. 2015. WBA Global Bioenergy Statistics 2015. www.worldbioenergy.org.
World Energy Council. 2013. Average electricity consumption per electrified household. Available from:
https://www.wec-indicators.enerdata.eu/household-electricity-use.html.
WHO. 2006. Guidelines for the safe use of wastewater, excreta and greywater use in agriculture and aquaculture. Socio cultural,
environmental and economic Aspects. World Health Organisation.
12. 11VALUING HUMAN WASTE AS AN ENERGY RESOURCE
APPENDIX I: DATA TABLES
TABLE A.1: ENERGY VALUE IN HUMAN WASTE (LOW SCENARIO)
* Rounded to the nearest ‘000
QUALITY OF
WASTE
POPULATION
OPEN DEFECATION
UNIMPROVED
SANITATION
WORLD
Estimated volume
biogas generated
per year (m3
)
0.25 % VS 15,157,082,000 37,309,740,000 116,592,938,000
0.35 % VS 21,219,915,000 52,233,636,000 163,230,113,000
0.45 %VS 27,282,747,000 67,157,532,000 209,867,288,000
Estimated volume of
slurry generated
per year (m3
)
0.25 % VS 17,322,379,000 42,639,703,000 133,249,072,000
0.35 % VS 24,251,331,000 59,695,584,000 186,548,700,000
0.45 %VS 31,180,283,000 76,751,465,000 239,848,329,000
Monetary value of
biogas (natural gas
equivalent)
0.25 % VS 208,667,000 513,641,000 1,605,127,000
0.35 % VS 292,133,000 719,097,000 2,247,178,000
0.45 %VS 375,600,000 924,553,000 2,889,229,000
Energy value of biogas
(# households annual
electricity use offset)
0.25 % VS 9,948,000 24,486,000 76,520,000
0.35 % VS 13,927,000 34,281,000 107,127,000
0.45 %VS 17,906,000 44,075,000 137,735,000
Charcoal offset
(slurry char equivalent)
(households yr-1
)
0.25 % VS 47,459,000 116,821,000 365,066,000
0.35 % VS 66,442,000 163,550,000 511,092,000
0.45 % VS 85,425,000 210,278,000 657,119,000
13. 12
TABLE A.2: ENERGY VALUE IN HUMAN WASTE (HIGH SCENARIO)
* Rounded to the nearest ‘000
QUALITY OF
WASTE
POPULATION
OPEN DEFECATION
UNIMPROVED
SANITATION
WORLD
Estimated volume
biogas generated
per year (m3
)
0.25 % VS 49,914,555,000 122,866,596,000 383,958,113,000
0.35 % VS 69,880,377,000 172,013,235,000 537,541,358,000
0.45 %VS 89,846,198,000 221,159,873,000 691,124,603,000
Estimated volume of
slurry generated
per year (m3
)
0.25 % VS 57,045,205,000 140,418,967,000 438,809,272,000
0.35 % VS 79,863,287,000 196,586,554,000 614,332,981,000
0.45 %VS 102,681,370,000 252,754,141,000 789,856,689,000
Monetary value of
biogas (natural gas
equivalent)
0.25 % VS 687,170,000 1,691,496,000 5,285,925,000
0.35 % VS 962,038,000 2,368,094,000 7,400,295,000
0.45 %VS 1,236,906,000 3,044,693,000 9,514,665,000
Energy value of biogas
(# households annual
electricity use offset)
0.25 % VS 32,759,000 80,637,000 251,991,000
0.35 % VS 45,862,000 112,892,000 352,787,000
0.45 %VS 58,966,000 145,147,000 453,583,000
Charcoal offset
(slurry char equivalent)
(households yr-1
)
0.25 % VS 156,288,000 384,709,000 1,202,217,000
0.35 % VS 218,804,000 538,593,000 1,683,104,000
0.45 % VS 281,319,000 692,477,000 2,163,991,000
15. United Nations University
Institute for Water, Environment and Health
204 - 175 Longwood Road South
Hamilton, ON., Canada. L8P 0A1
1-905-667-5511
inweh.unu.edu
ISBN: 978-92-808-6078-8