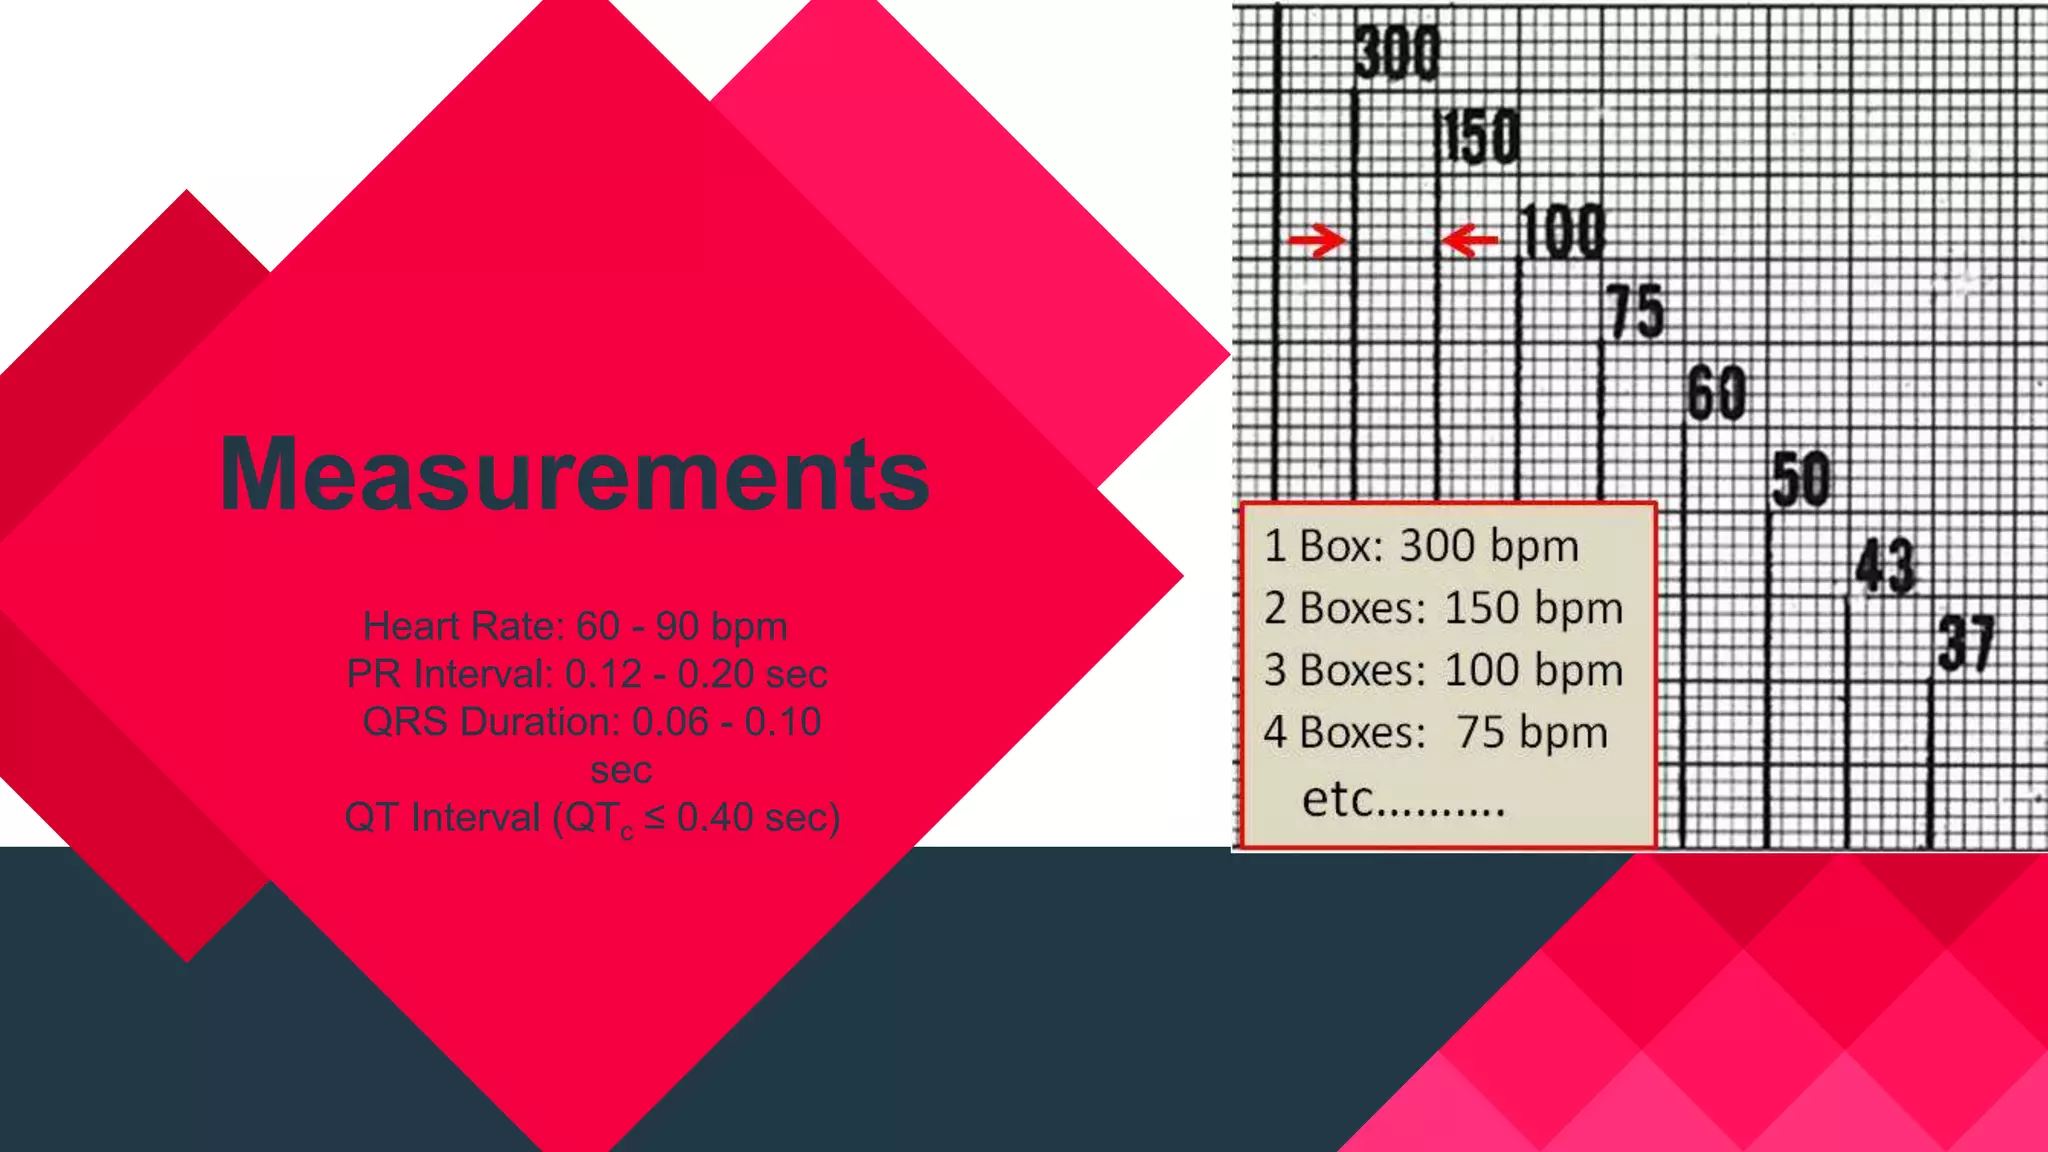
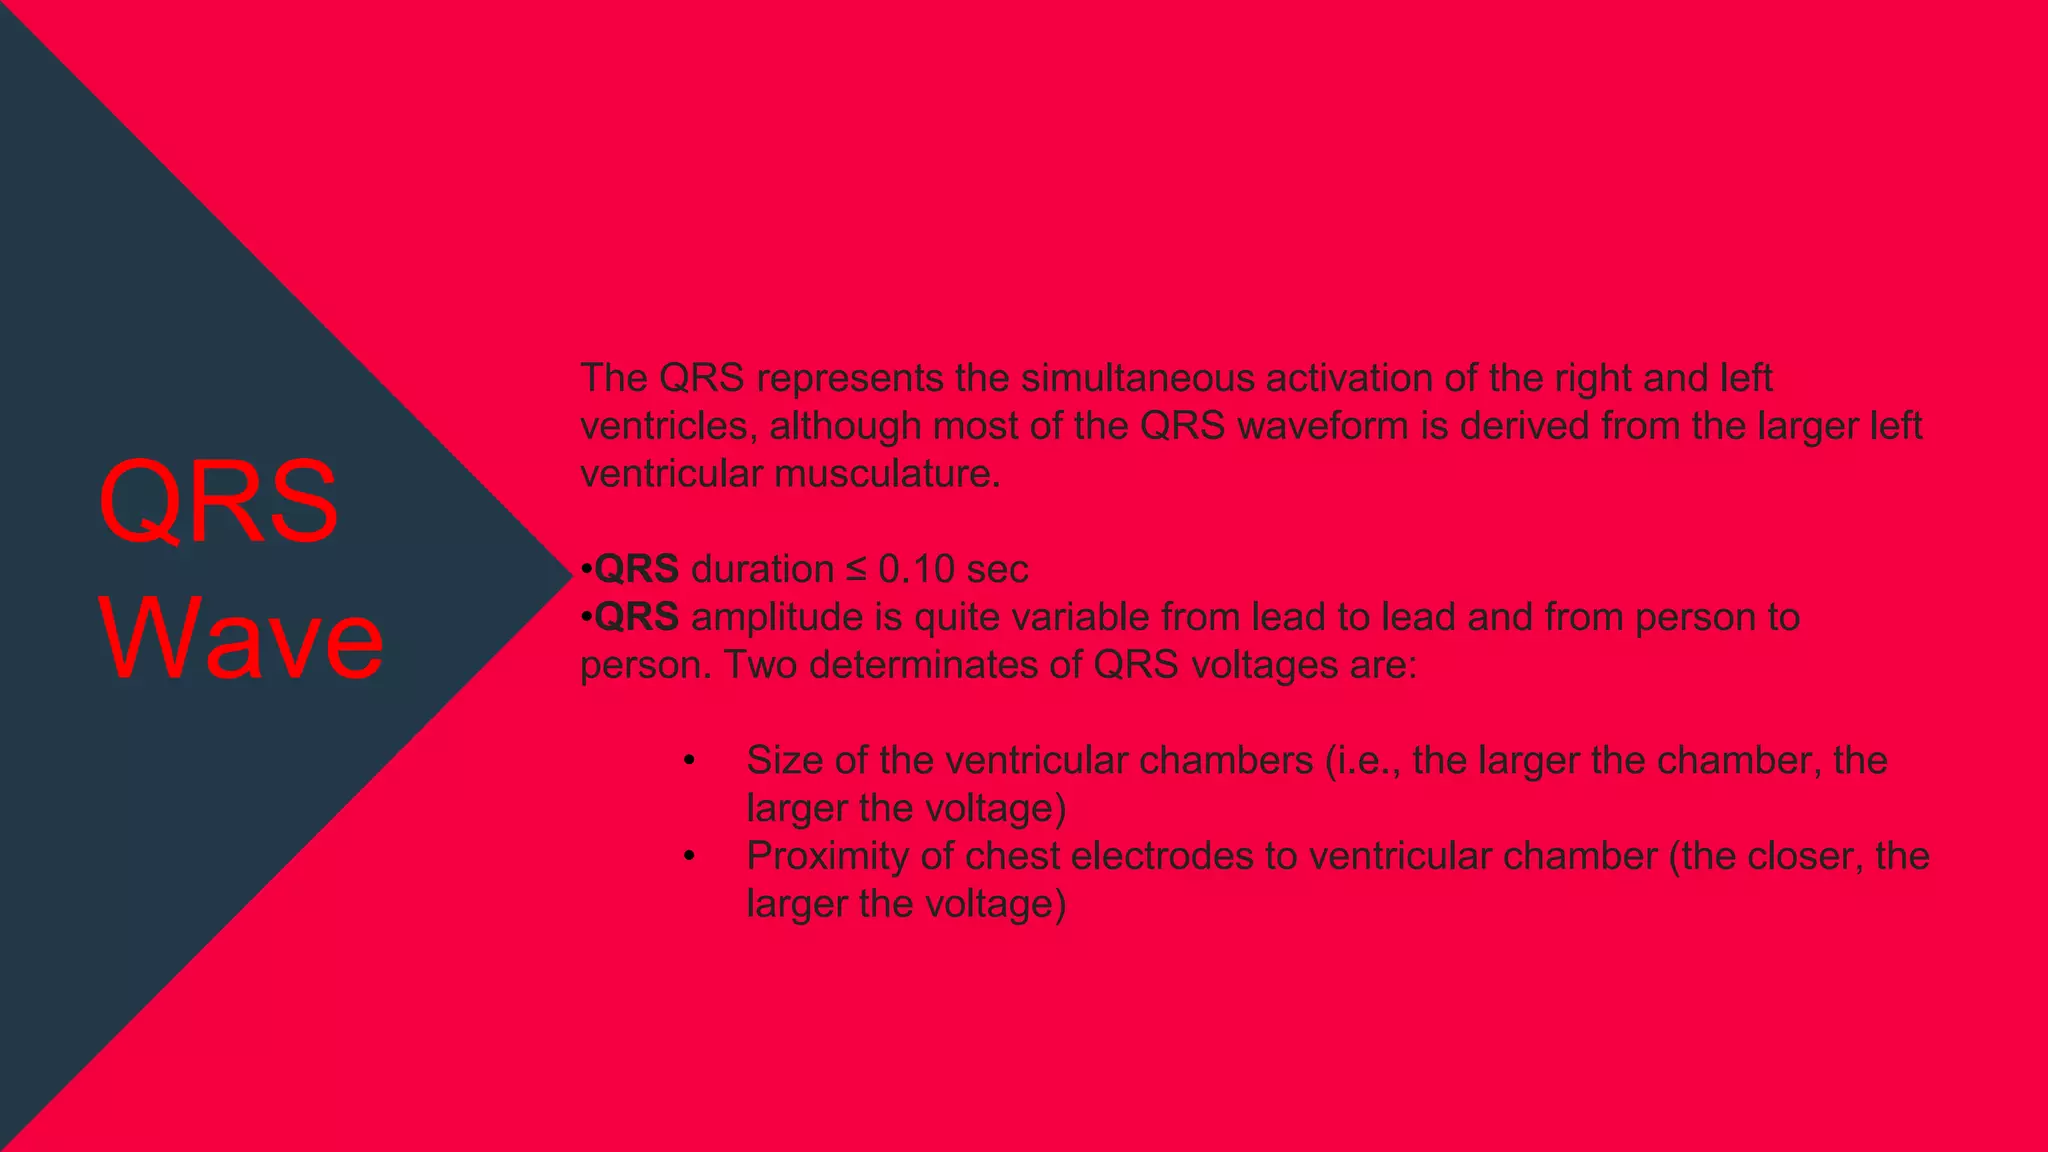
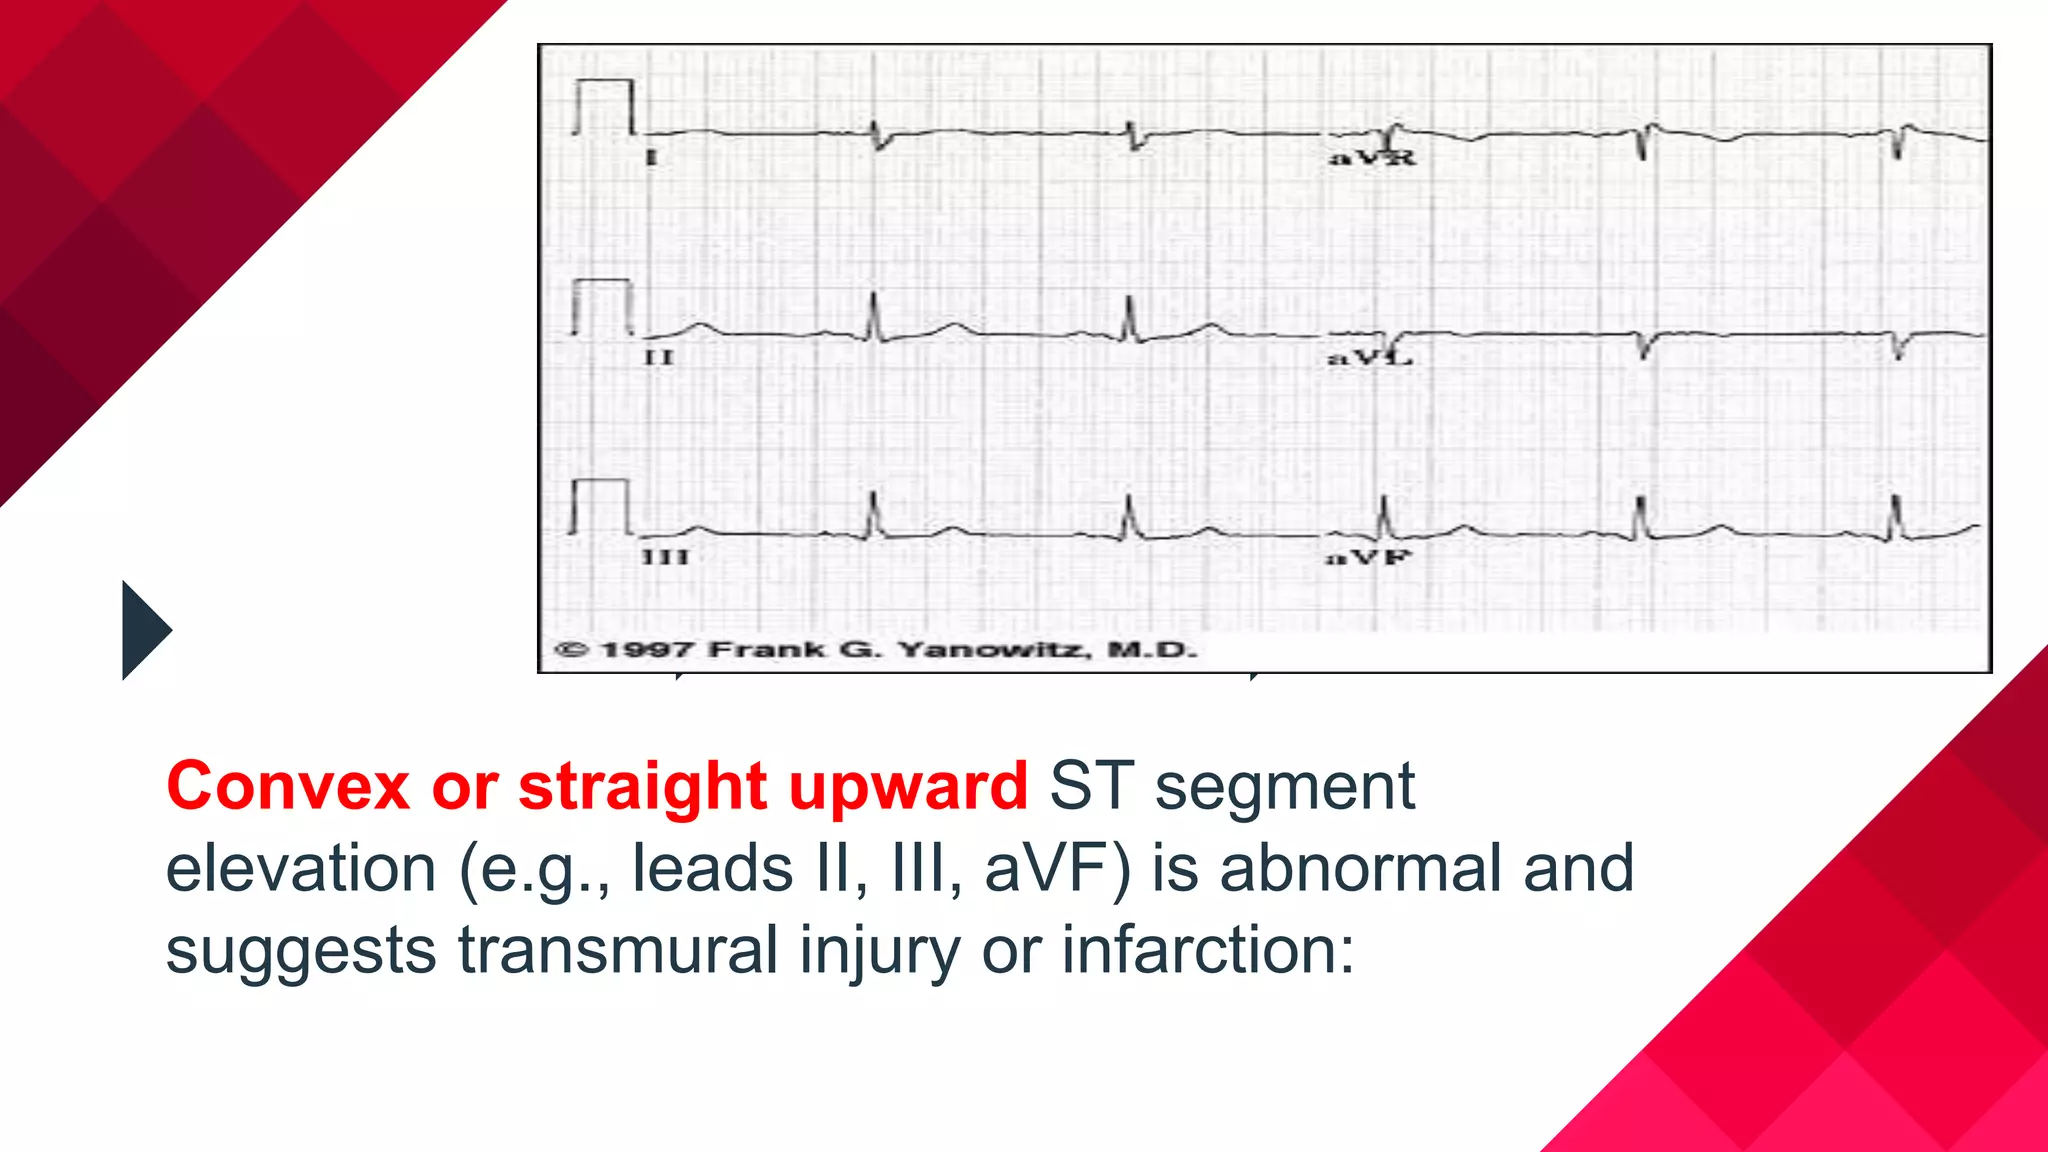
Characteristics of the
Normal ECG
Shirin Gorjian
Master of Science in Nursing Education
Hamadan University of Medical Sciences
Measurements
Heart Rate: 60 - 90 bpm
PR Interval: 0.12 - 0.20 sec
QRS Duration: 0.06 - 0.10
sec
QT Interval (QTc ≤ 0.40 sec)
Rhythm
Normal sinus rhythm
The P waves in leads I and II
must be upright (positive)
if the rhythm is coming
from the sinus node.
Conduction
Normal Sino-atrial (SA), Atrio-
ventricular (AV), and
Intraventricular (IV)
conduction
Both the PR interval and QRS
duration should be within
the limits specified above.
P Wave
It is important to remember that the P wave represents the sequential
activation of the right and left atria, and it is common to see notched or
biphasic P waves of right and left atrial activation.
P duration < 0.12 sec
P amplitude < 2.5 mm
Frontal plane P wave axis: 0° to +75°
May see notched P waves in frontal plane
The QRS represents the simultaneous activation of the right and left
ventricles, although most of the QRS waveform is derived from the larger left
ventricular musculature.
•QRS duration ≤ 0.10 sec
•QRS amplitude is quite variable from lead to lead and from person to
person. Two determinates of QRS voltages are:
• Size of the ventricular chambers (i.e., the larger the chamber, the
larger the voltage)
• Proximity of chest electrodes to ventricular chamber (the closer, the
larger the voltage)
QRS
Wave
⏷ The normal QRS axis range (+90° to -30° ); this
implies that the QRS be mostly positive (upright) in
leads II and I.
⏷ Normal q-waves reflect normal septal activation
(beginning on the LV septum); they are narrow
(<0.04s duration) and small (<25% the amplitude of
the R wave). They are often seen in leads I and aVL
when the QRS axis is to the left of +60°, and in leads
II, III, aVF when the QRS axis is to the right of +60°.
Septal q waves should not be confused with the
pathologic Q waves of myocardial infarction.
Frontal plane
leads:
Precordial
leads:
⏷ Small r-waves begin in V1 or V2 and progress in
size to V5. The R-V6 is usually smaller than R-V5.
⏷ In reverse, the s-waves begin in V6 or V5 and
progress in size to V2. S-V1 is usually smaller than
S-V2.
⏷ The usual transition from S>R in the right precordial
leads to R>S in the left precordial leads is V3 or V4.
⏷ Small "septal" q-waves may be seen in leads V5
and V6.
NORMAL ECG
ST
Segment
and T
wave
⏷ In a sense, the term "ST segment" is a
misnomer, because a discrete ST segment
distinct from the T wave is usually absent.
More often the ST-T wave is a smooth,
continuous waveform beginning with the J-
point (end of QRS), slowly rising to the peak
of the T and followed by a rapid descent to
the isoelectric baseline or the onset of the U
wave. This gives rise to an asymmetrical T
wave. In some normal individuals,
particularly women, the T wave is
symmetrical and a distinct, horizontal ST
segment is present.
⏷ The normal T wave is usually in the same
direction as the QRS except in the right
precordial leads. In the normal ECG the T
wave is always upright in leads I, II, V3-6,
and always inverted in lead aVR.
Normal ST segment elevation:
this occurs in leads with large S waves (e.g., V1-3), and
the normal configuration is concave upward. ST
segment elevation with concave upward appearance
may also be seen in other leads; this is often
called early repolarization, although it's a term with
little physiologic meaning (see example of "early
repolarization" in leads V4-6):
Convex or straight upward ST segment
elevation (e.g., leads II, III, aVF) is abnormal and
suggests transmural injury or infarction:
ST segment depression is
always an abnormal finding,
although often nonspecific (see
ECG above)
ST segment depression is often characterized as
"upsloping", "horizontal", or "downsloping".
U WAVE
⏷ The normal U Wave:
⏷ (the most neglected of the ECG waveforms)
⏷ U wave amplitude is usually < 1/3 T wave
amplitude in same lead.
⏷ U wave direction is the same as T wave
direction in that lead.
⏷ U waves are more prominent at slow heart
rates and usually best seen in the right
precordial leads.
⏷ Origin of the U wave is thought to be related
to after depolarizations which interrupt or
follow repolarization.
A picture is worth a thousand words
Awesome words
Because key words are great for catching your audience’s
attention
Thanks!
Does anyone have any questions?
addyouremail@freepik.com
+91 620 421 838
yourcompany.com
Refrences
Frank G. Yanowitz, MD
Professor of Medicine (Retired)
University of Utah School of Medicine
https://library.med.utah.edu/

Characteristic of normal ECG

  • 1.
    Characteristics of the NormalECG Shirin Gorjian Master of Science in Nursing Education Hamadan University of Medical Sciences
  • 2.
    Measurements Heart Rate: 60- 90 bpm PR Interval: 0.12 - 0.20 sec QRS Duration: 0.06 - 0.10 sec QT Interval (QTc ≤ 0.40 sec)
  • 3.
    Rhythm Normal sinus rhythm TheP waves in leads I and II must be upright (positive) if the rhythm is coming from the sinus node.
  • 4.
    Conduction Normal Sino-atrial (SA),Atrio- ventricular (AV), and Intraventricular (IV) conduction Both the PR interval and QRS duration should be within the limits specified above.
  • 5.
    P Wave It isimportant to remember that the P wave represents the sequential activation of the right and left atria, and it is common to see notched or biphasic P waves of right and left atrial activation. P duration < 0.12 sec P amplitude < 2.5 mm Frontal plane P wave axis: 0° to +75° May see notched P waves in frontal plane
  • 6.
    The QRS representsthe simultaneous activation of the right and left ventricles, although most of the QRS waveform is derived from the larger left ventricular musculature. •QRS duration ≤ 0.10 sec •QRS amplitude is quite variable from lead to lead and from person to person. Two determinates of QRS voltages are: • Size of the ventricular chambers (i.e., the larger the chamber, the larger the voltage) • Proximity of chest electrodes to ventricular chamber (the closer, the larger the voltage) QRS Wave
  • 7.
    ⏷ The normalQRS axis range (+90° to -30° ); this implies that the QRS be mostly positive (upright) in leads II and I. ⏷ Normal q-waves reflect normal septal activation (beginning on the LV septum); they are narrow (<0.04s duration) and small (<25% the amplitude of the R wave). They are often seen in leads I and aVL when the QRS axis is to the left of +60°, and in leads II, III, aVF when the QRS axis is to the right of +60°. Septal q waves should not be confused with the pathologic Q waves of myocardial infarction. Frontal plane leads:
  • 8.
    Precordial leads: ⏷ Small r-wavesbegin in V1 or V2 and progress in size to V5. The R-V6 is usually smaller than R-V5. ⏷ In reverse, the s-waves begin in V6 or V5 and progress in size to V2. S-V1 is usually smaller than S-V2. ⏷ The usual transition from S>R in the right precordial leads to R>S in the left precordial leads is V3 or V4. ⏷ Small "septal" q-waves may be seen in leads V5 and V6.
  • 9.
  • 10.
    ST Segment and T wave ⏷ Ina sense, the term "ST segment" is a misnomer, because a discrete ST segment distinct from the T wave is usually absent. More often the ST-T wave is a smooth, continuous waveform beginning with the J- point (end of QRS), slowly rising to the peak of the T and followed by a rapid descent to the isoelectric baseline or the onset of the U wave. This gives rise to an asymmetrical T wave. In some normal individuals, particularly women, the T wave is symmetrical and a distinct, horizontal ST segment is present. ⏷ The normal T wave is usually in the same direction as the QRS except in the right precordial leads. In the normal ECG the T wave is always upright in leads I, II, V3-6, and always inverted in lead aVR.
  • 11.
    Normal ST segmentelevation: this occurs in leads with large S waves (e.g., V1-3), and the normal configuration is concave upward. ST segment elevation with concave upward appearance may also be seen in other leads; this is often called early repolarization, although it's a term with little physiologic meaning (see example of "early repolarization" in leads V4-6):
  • 12.
    Convex or straightupward ST segment elevation (e.g., leads II, III, aVF) is abnormal and suggests transmural injury or infarction:
  • 13.
    ST segment depressionis always an abnormal finding, although often nonspecific (see ECG above)
  • 14.
    ST segment depressionis often characterized as "upsloping", "horizontal", or "downsloping".
  • 15.
    U WAVE ⏷ Thenormal U Wave: ⏷ (the most neglected of the ECG waveforms) ⏷ U wave amplitude is usually < 1/3 T wave amplitude in same lead. ⏷ U wave direction is the same as T wave direction in that lead. ⏷ U waves are more prominent at slow heart rates and usually best seen in the right precordial leads. ⏷ Origin of the U wave is thought to be related to after depolarizations which interrupt or follow repolarization.
  • 16.
    A picture isworth a thousand words
  • 17.
    Awesome words Because keywords are great for catching your audience’s attention
  • 18.
    Thanks! Does anyone haveany questions? addyouremail@freepik.com +91 620 421 838 yourcompany.com
  • 19.
    Refrences Frank G. Yanowitz,MD Professor of Medicine (Retired) University of Utah School of Medicine https://library.med.utah.edu/