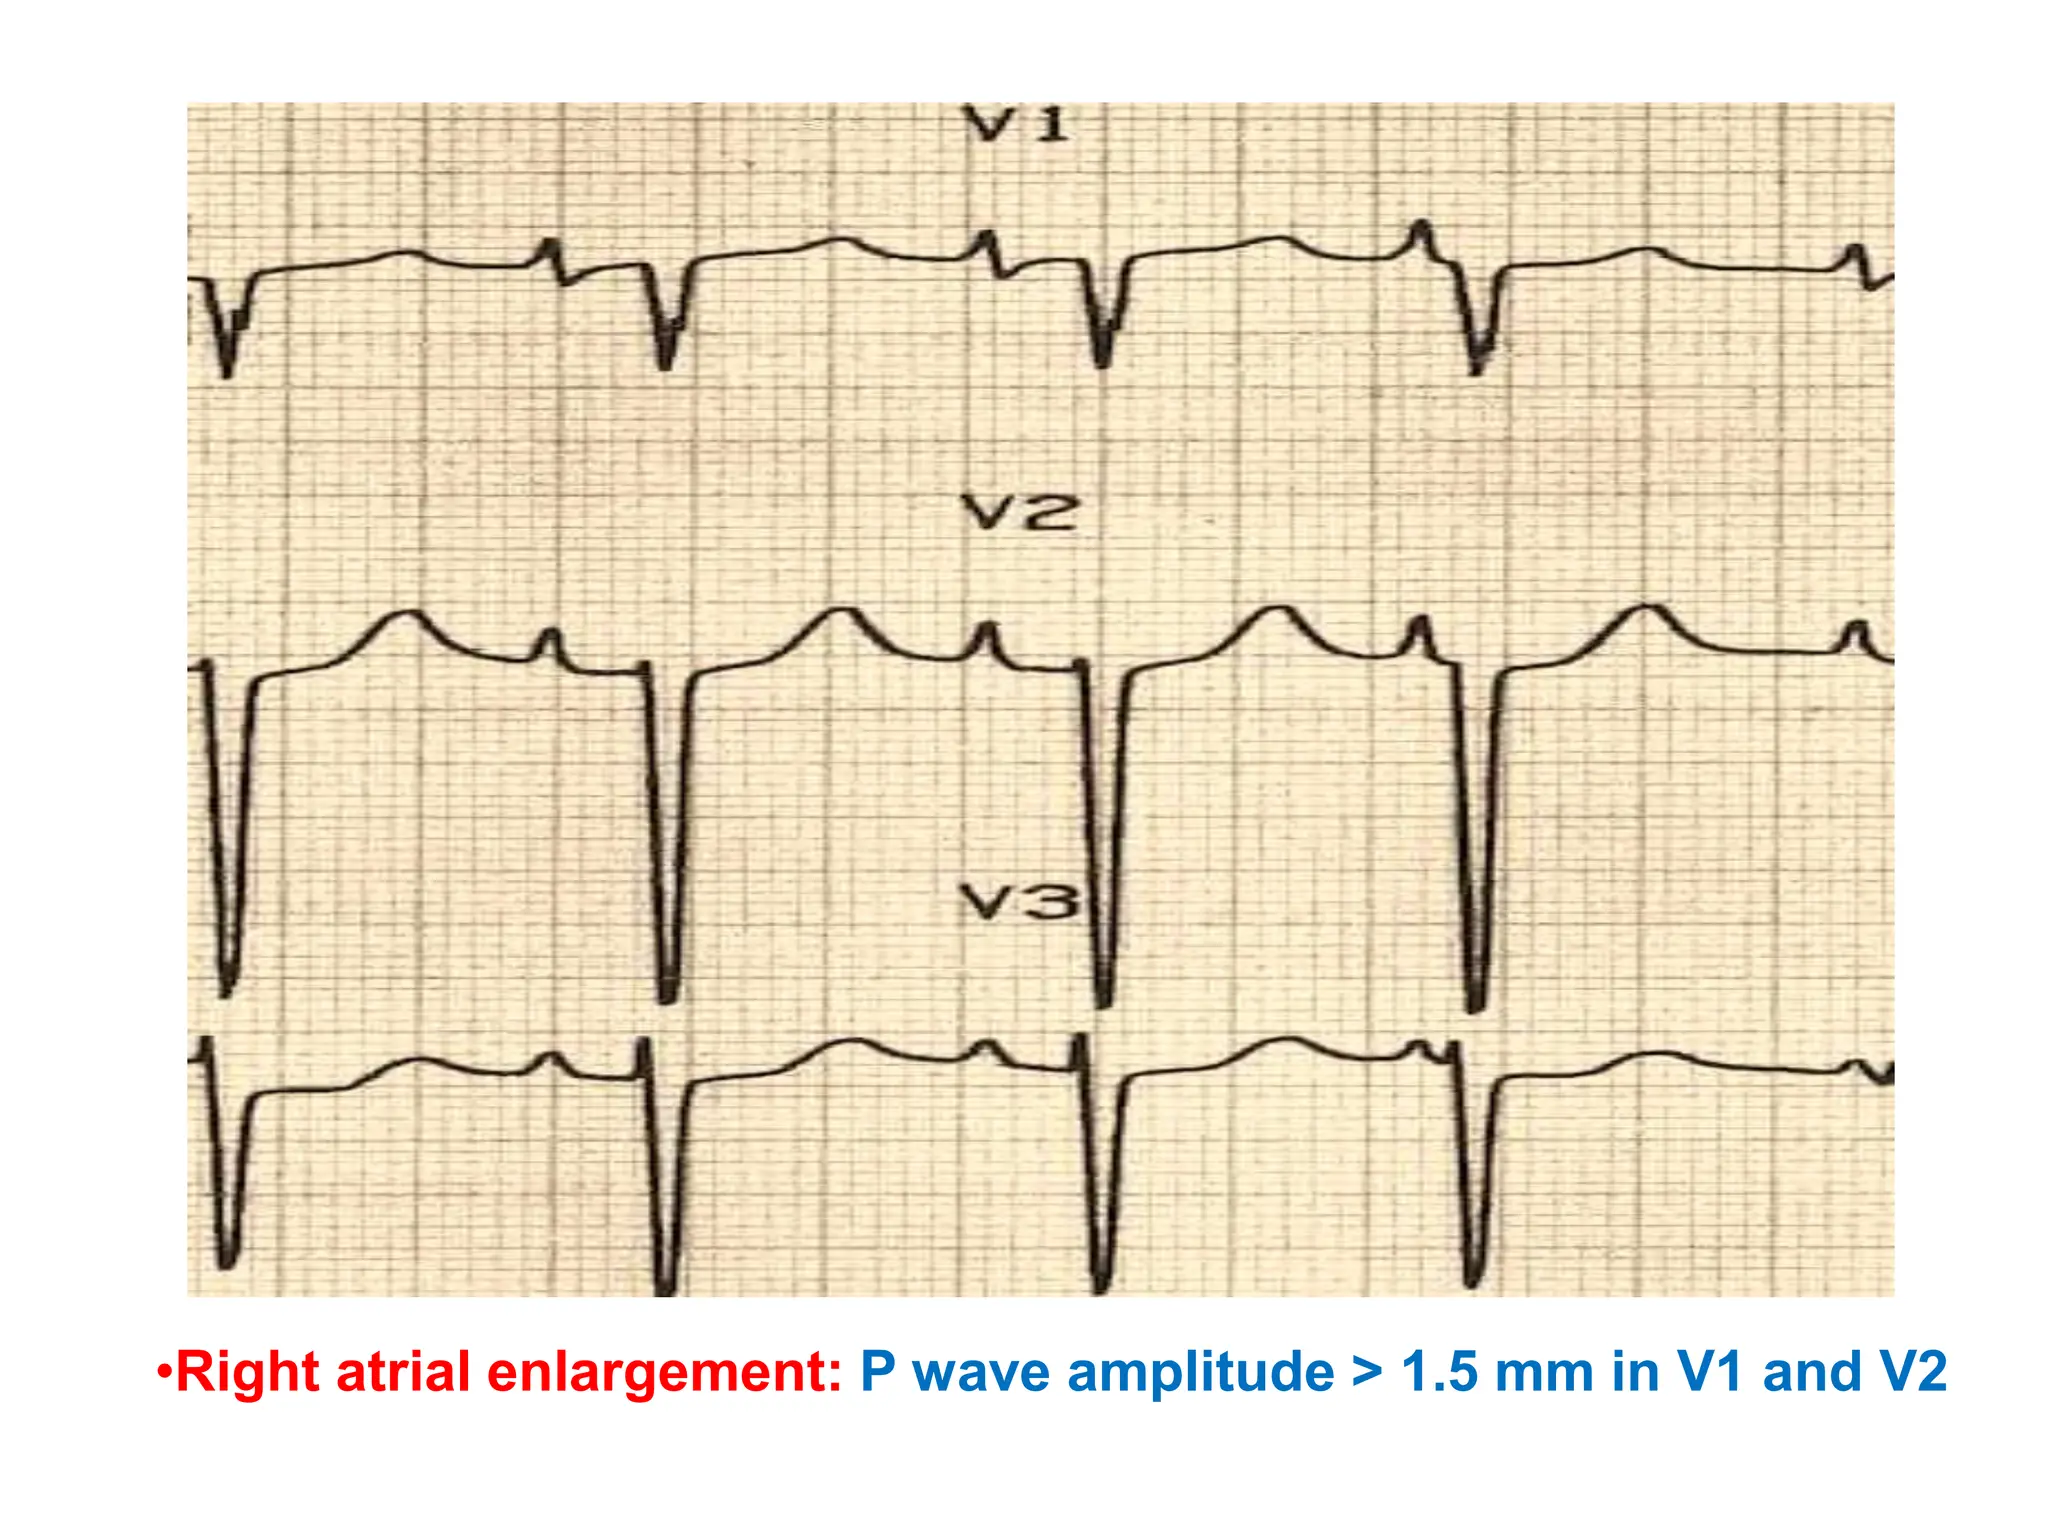
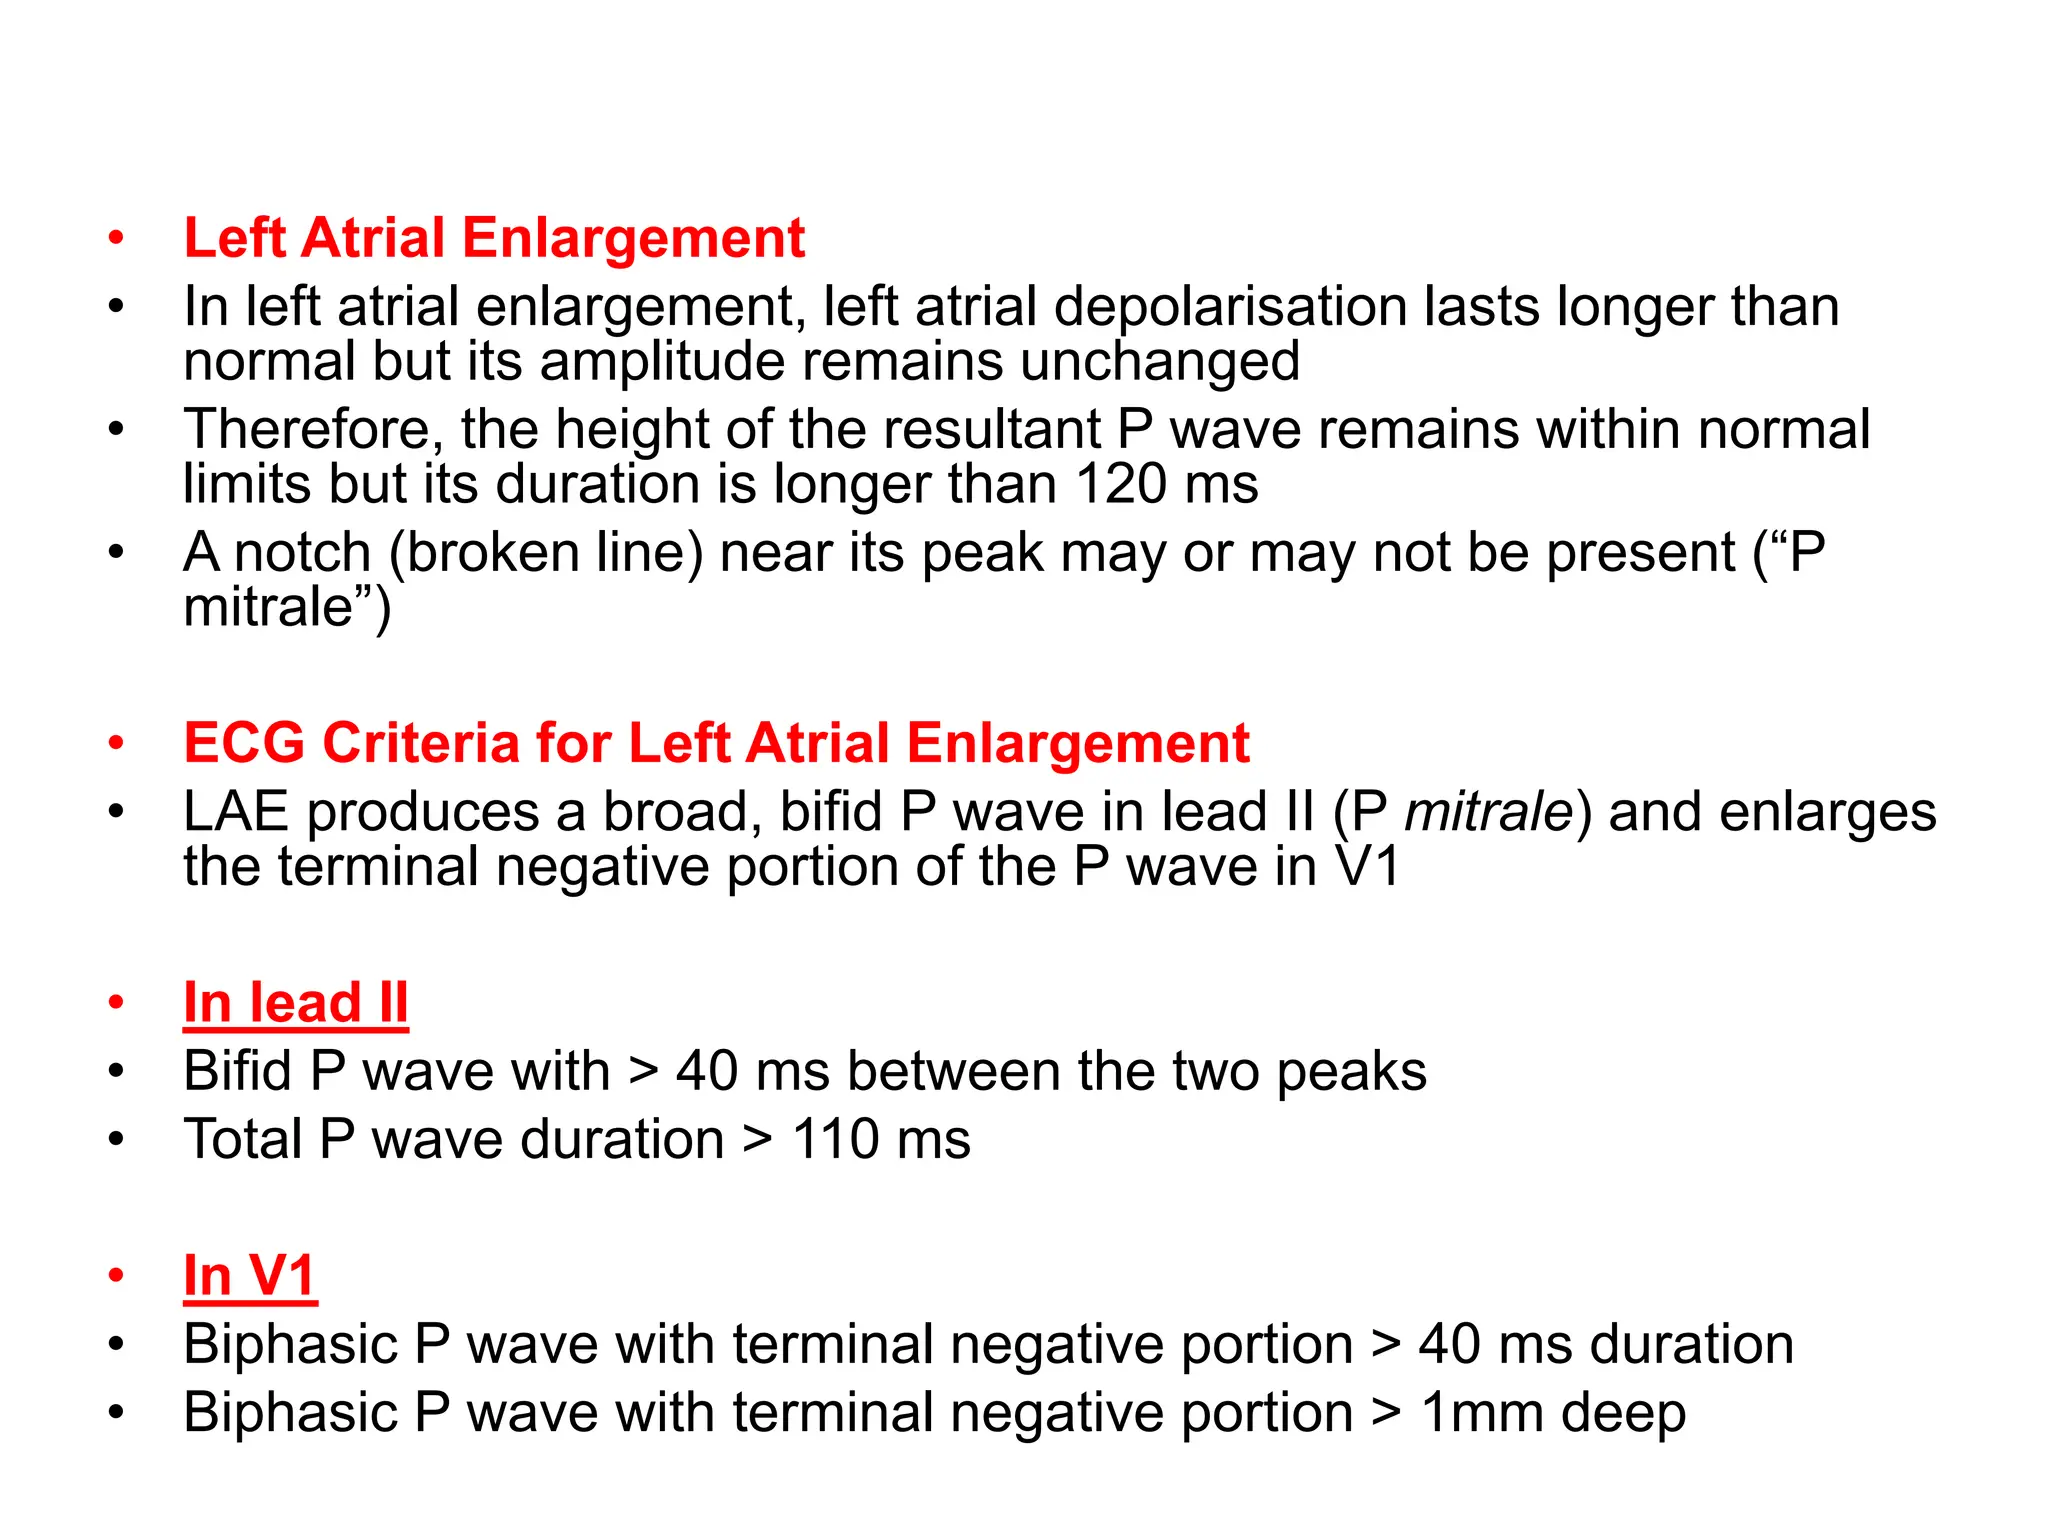
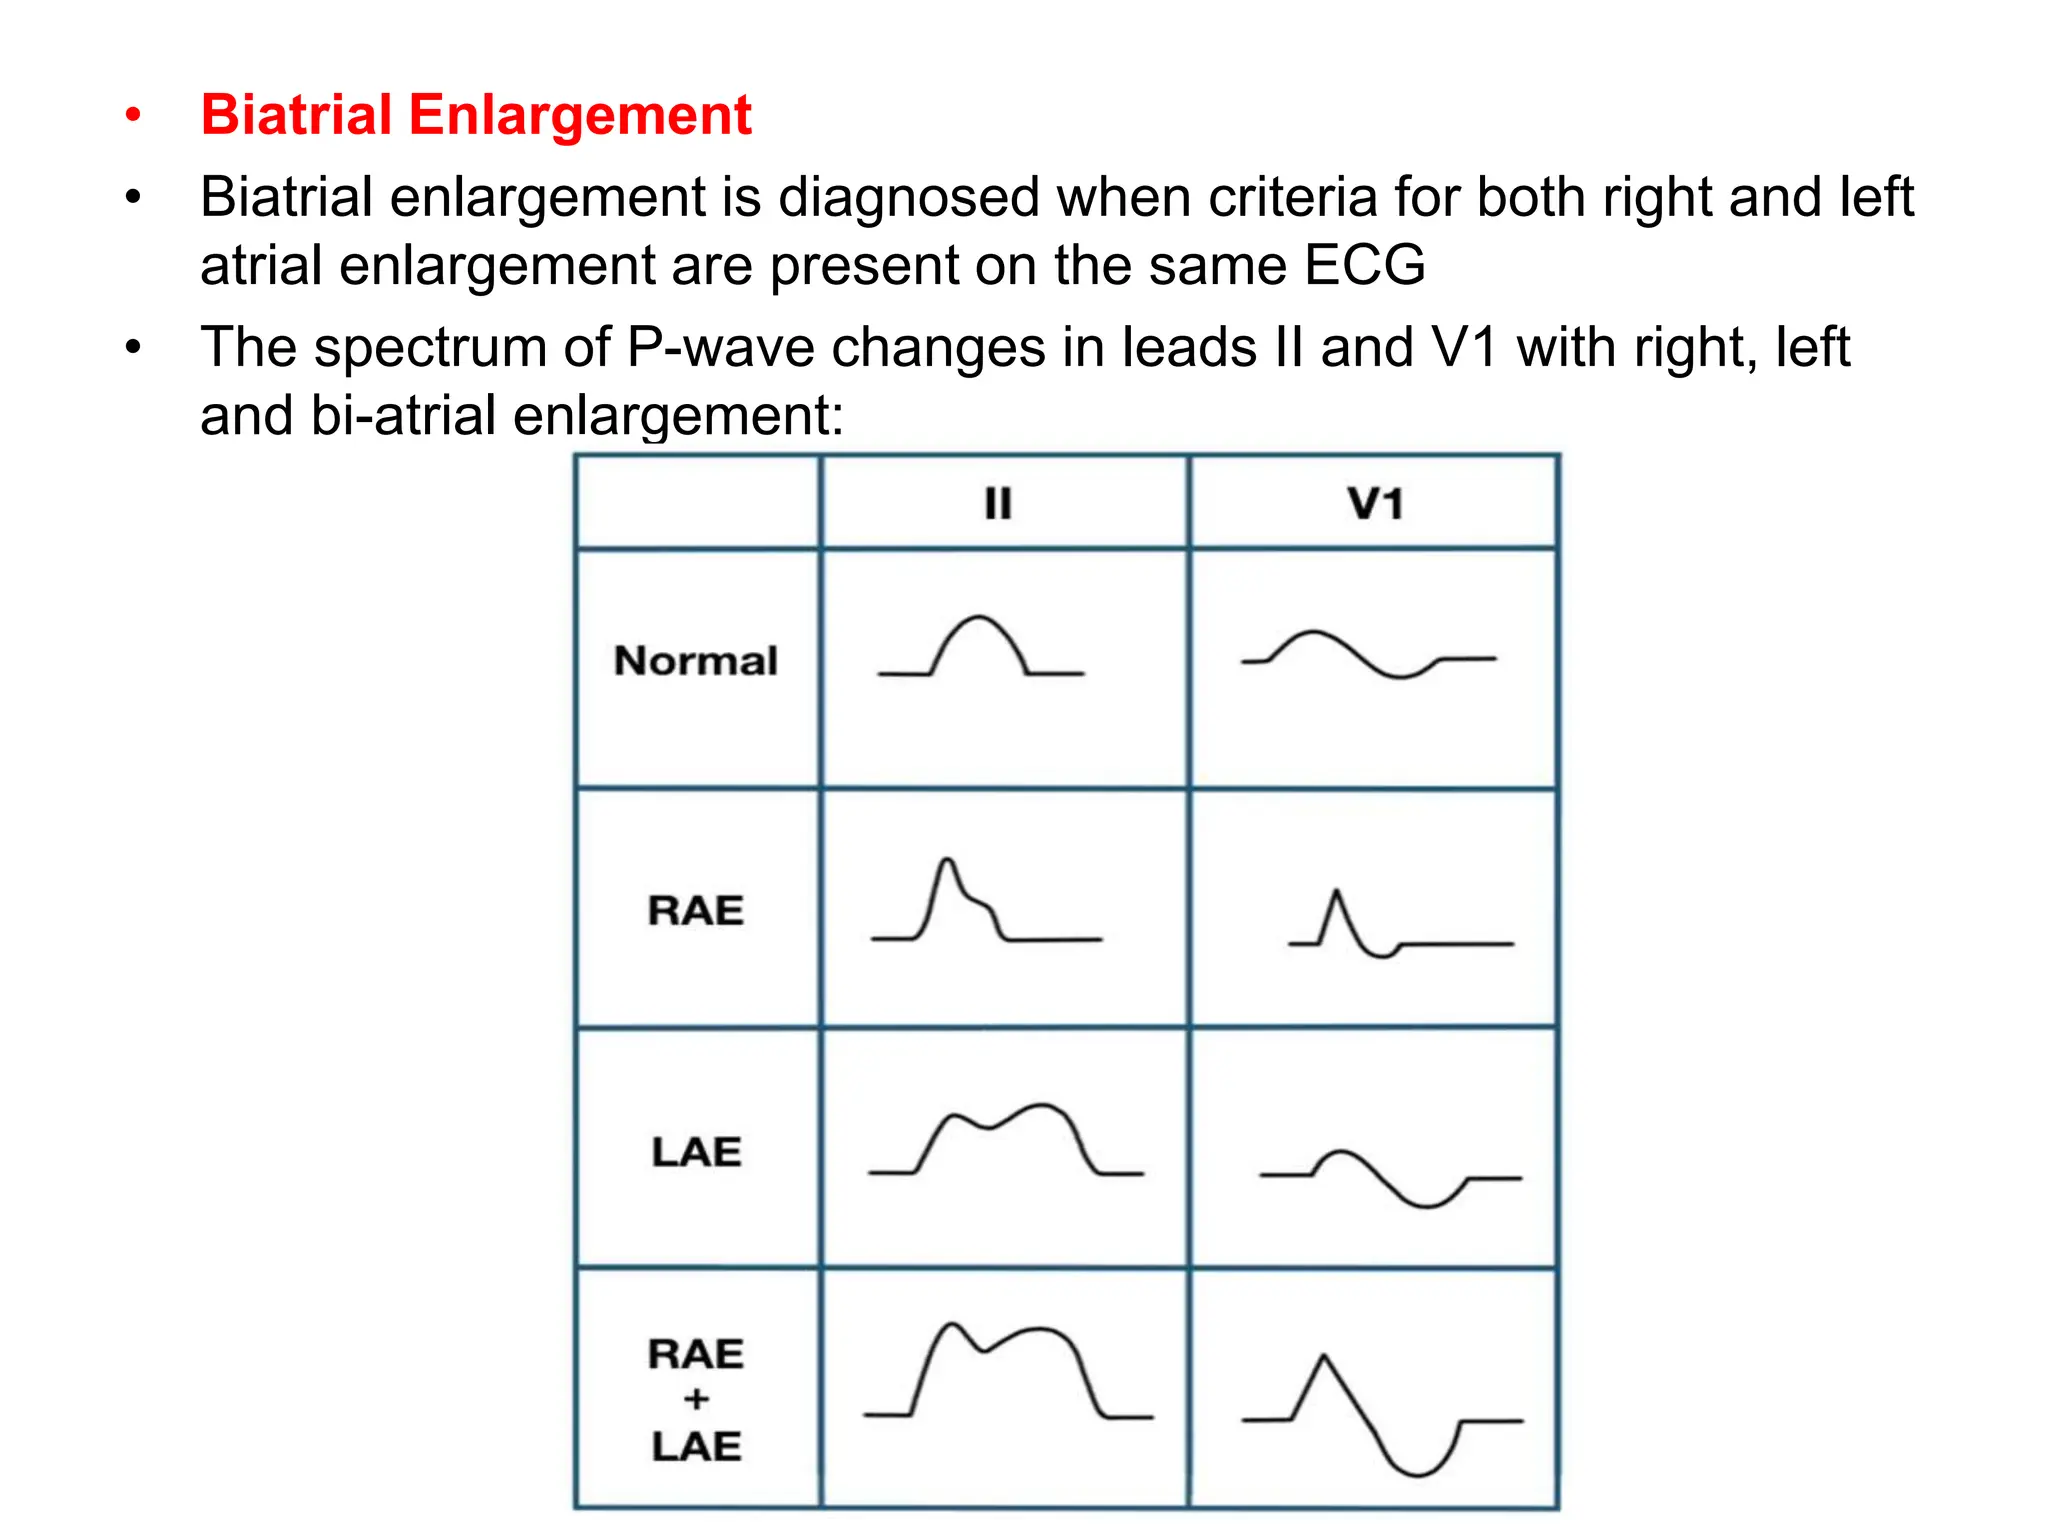
P WAVE
Dr.G.VENKATA RAMANA
MBBS DNB FAMILY MEDICINE
P Wave Overview
• First positive deflection on the ECG
• Represents atrial depolarisation
• Characteristics of the Normal Sinus P Wave
• Morphology
• Smooth contour
• Monophasic in lead II
• Biphasic in V1
• Axis
• Normal P wave axis is between 0° and +75°
• P waves should be upright in leads I and II, inverted in aVR
• Duration
• < 0.12 s (<120ms or 3 small squares)
• Amplitude
• < 2.5 mm (0.25mV) in the limb leads
• < 1.5 mm (0.15mV) in the precordial leads
• Atrial abnormalities are most easily seen in the inferior leads (II, III and aVF)
and lead V1, as the P waves are most prominent in these leads
The Atrial Waveform – Relationship to the P wave
• Atrial depolarisation proceeds sequentially from right to left, with the
right atrium activated before the left atrium
• The right and left atrial waveforms summate to form the P wave
• First 1/3 of the P wave  Right atrial activation
• Final 1/3 of the P wave  Left atrial activation
• Middle 1/3 of the P wave  Combination of the two
• In most leads (e.g. lead II), the right and left atrial waveforms move in
the same direction, forming a monophasic P wave
• However, in lead V1 the right and left atrial waveforms move in
opposite directions
• This produces a biphasic P wave with the initial positive deflection
corresponding to right atrial activation and the subsequent negative
deflection denoting left atrial activation
Normal P-wave Morphology – Lead II
• The right atrial depolarisation wave (brown) precedes
that of the left atrium (blue)
• The combined depolarisation wave, the P wave, is less
than 120 ms wide and less than 2.5 mm high
• Normal P-wave Morphology – Lead V1
• The P wave is typically biphasic in V1, with similar sizes
of the positive and negative deflections
• P WAVE
• Present or Absent
• If P waves absent
• Completely absent
• Intermittently absent
• Present but not obvious
• If P waves present look for
• Morphology
• Uniformity
• Amplitude
• Duration
• No of P waves per QRS complex
• P waves are completely absent
• Atrial fibrillation
• Sinus arrest or SA block (prolonged)
• Hyperkalemia
• P waves are present but not obvious
• AVNRT
• Third degree AV block
• P waves are intermittently absent
• Sinus arrest or SA block (intermittent)
• Are any P waves inverted?
• If ‘yes’, consider:
• Electrode misplacement
• Dextrocardia
• Retrograde atrial depolarization
Atrial fibrillation
• Irregular ventricular response
• Coarse fibrillatory waves are visible in V1
• “Sagging” ST segment depression is visible in V6, II, III and aVF, suggestive of digoxin effect
SINUS ARREST OR SA BLOCK
• Anatomical Basis
• The SA node consists of two main groups of cells:
• A central core of pacemaking cells (P cells) that produce
the sinus impulses
• An outer layer of transitional cells (T cells) that transmit
the sinus impulses out into the right atrium.
• Sinus node dysfunction can result from either:
• Failure of the P cells to produce an impulse
• This leads to sinus pauses and sinus arrest
• Failure of the T cells to transmit the impulse
• This leads to sino-atrial exit block
• Common P Wave Abnormalities
• P pulmonale (peaked P waves), seen with right atrial
enlargement
• P mitrale (bifid P waves), seen with left atrial
enlargement
• P wave inversion, seen with ectopic atrial and junctional
rhythms
• Variable P wave morphology, seen in multifocal atrial
rhythms
Right Atrial Enlargement
• In right atrial enlargement, right atrial depolarisation lasts
longer than normal and its waveform extends to the end
of left atrial depolarisation
• Although the amplitude of the right atrial depolarisation
current remains unchanged, its peak now falls on top of
that of the left atrial depolarisation wave
• The combination of these two waveforms produces a P
waves that is taller than normal (> 2.5 mm), although the
width remains unchanged (< 120 ms)
• Right atrial enlargement produces a peaked P wave (P
pulmonale) with amplitude:
• > 2.5 mm in the inferior leads (II, III and AVF)
• > 1.5 mm in V1 and V2
• Causes of right atrial enlargement
• Primary pulmonary hypertension
• Secondary pulmonary hypertension
chronic bronchitis
emphysema
massive pulmonary embolism
• Pulmonary stenosis
• Tricuspid stenosis
•Right atrial enlargement: P pulmonale
•P wave amplitude > 2.5mm in leads II, III and aVF
•Right atrial enlargement: P wave amplitude > 1.5 mm in V1 and V2
• P Pulmonale
• The presence of tall, peaked P waves in lead II is a sign
of right atrial enlargement, usually due to pulmonary
hypertension (e.g. cor pulmonale from chronic
respiratory disease)
• Left Atrial Enlargement
• In left atrial enlargement, left atrial depolarisation lasts longer than
normal but its amplitude remains unchanged
• Therefore, the height of the resultant P wave remains within normal
limits but its duration is longer than 120 ms
• A notch (broken line) near its peak may or may not be present (“P
mitrale”)
• ECG Criteria for Left Atrial Enlargement
• LAE produces a broad, bifid P wave in lead II (P mitrale) and enlarges
the terminal negative portion of the P wave in V1
• In lead II
• Bifid P wave with > 40 ms between the two peaks
• Total P wave duration > 110 ms
• In V1
• Biphasic P wave with terminal negative portion > 40 ms duration
• Biphasic P wave with terminal negative portion > 1mm deep
• P Mitrale
• The presence of broad, notched (bifid) P waves
in lead II is a sign of left atrial enlargement,
classically due to mitral stenosis
P waves with terminal portion > 1mm deep in V1
• Biatrial Enlargement
• Biatrial enlargement is diagnosed when criteria for both right and left
atrial enlargement are present on the same ECG
• The spectrum of P-wave changes in leads II and V1 with right, left
and bi-atrial enlargement:
• Inverted P Waves
• P-wave inversion indicates a non-sinus origin of the P waves
• Causes
• Dextrocardia
• Abnormal atrial depolarization
• Atrial ectopics
• AV junctional rhythms
• Ventricular tachycardia (retrogradely conducted)
• Ventricular ectopics (retrogradely conducted)
• Variable P-Wave Morphology
• The presence of multiple P wave morphologies indicates
multiple ectopic pacemakers within the atria and/or AV
junction
• If ≥ 3 different P wave morphologies are seen,
then multifocal atrial rhythm is diagnosed:
• If ≥ 3 different P wave morphologies are seen and the
rate is ≥ 100, then multifocal atrial
tachycardia (MAT) is diagnosed:

P WAVE IN ECG,ABNORMALITIES OF P WAVE IN ECG

  • 1.
  • 2.
    P Wave Overview •First positive deflection on the ECG • Represents atrial depolarisation • Characteristics of the Normal Sinus P Wave • Morphology • Smooth contour • Monophasic in lead II • Biphasic in V1 • Axis • Normal P wave axis is between 0° and +75° • P waves should be upright in leads I and II, inverted in aVR • Duration • < 0.12 s (<120ms or 3 small squares) • Amplitude • < 2.5 mm (0.25mV) in the limb leads • < 1.5 mm (0.15mV) in the precordial leads • Atrial abnormalities are most easily seen in the inferior leads (II, III and aVF) and lead V1, as the P waves are most prominent in these leads
  • 3.
    The Atrial Waveform– Relationship to the P wave • Atrial depolarisation proceeds sequentially from right to left, with the right atrium activated before the left atrium • The right and left atrial waveforms summate to form the P wave • First 1/3 of the P wave  Right atrial activation • Final 1/3 of the P wave  Left atrial activation • Middle 1/3 of the P wave  Combination of the two • In most leads (e.g. lead II), the right and left atrial waveforms move in the same direction, forming a monophasic P wave • However, in lead V1 the right and left atrial waveforms move in opposite directions • This produces a biphasic P wave with the initial positive deflection corresponding to right atrial activation and the subsequent negative deflection denoting left atrial activation
  • 4.
    Normal P-wave Morphology– Lead II • The right atrial depolarisation wave (brown) precedes that of the left atrium (blue) • The combined depolarisation wave, the P wave, is less than 120 ms wide and less than 2.5 mm high
  • 5.
    • Normal P-waveMorphology – Lead V1 • The P wave is typically biphasic in V1, with similar sizes of the positive and negative deflections
  • 6.
    • P WAVE •Present or Absent • If P waves absent • Completely absent • Intermittently absent • Present but not obvious • If P waves present look for • Morphology • Uniformity • Amplitude • Duration • No of P waves per QRS complex
  • 7.
    • P wavesare completely absent • Atrial fibrillation • Sinus arrest or SA block (prolonged) • Hyperkalemia • P waves are present but not obvious • AVNRT • Third degree AV block • P waves are intermittently absent • Sinus arrest or SA block (intermittent) • Are any P waves inverted? • If ‘yes’, consider: • Electrode misplacement • Dextrocardia • Retrograde atrial depolarization
  • 8.
    Atrial fibrillation • Irregularventricular response • Coarse fibrillatory waves are visible in V1 • “Sagging” ST segment depression is visible in V6, II, III and aVF, suggestive of digoxin effect
  • 9.
    SINUS ARREST ORSA BLOCK • Anatomical Basis • The SA node consists of two main groups of cells: • A central core of pacemaking cells (P cells) that produce the sinus impulses • An outer layer of transitional cells (T cells) that transmit the sinus impulses out into the right atrium. • Sinus node dysfunction can result from either: • Failure of the P cells to produce an impulse • This leads to sinus pauses and sinus arrest • Failure of the T cells to transmit the impulse • This leads to sino-atrial exit block
  • 16.
    • Common PWave Abnormalities • P pulmonale (peaked P waves), seen with right atrial enlargement • P mitrale (bifid P waves), seen with left atrial enlargement • P wave inversion, seen with ectopic atrial and junctional rhythms • Variable P wave morphology, seen in multifocal atrial rhythms
  • 17.
    Right Atrial Enlargement •In right atrial enlargement, right atrial depolarisation lasts longer than normal and its waveform extends to the end of left atrial depolarisation • Although the amplitude of the right atrial depolarisation current remains unchanged, its peak now falls on top of that of the left atrial depolarisation wave • The combination of these two waveforms produces a P waves that is taller than normal (> 2.5 mm), although the width remains unchanged (< 120 ms) • Right atrial enlargement produces a peaked P wave (P pulmonale) with amplitude: • > 2.5 mm in the inferior leads (II, III and AVF) • > 1.5 mm in V1 and V2
  • 18.
    • Causes ofright atrial enlargement • Primary pulmonary hypertension • Secondary pulmonary hypertension chronic bronchitis emphysema massive pulmonary embolism • Pulmonary stenosis • Tricuspid stenosis
  • 19.
    •Right atrial enlargement:P pulmonale •P wave amplitude > 2.5mm in leads II, III and aVF
  • 20.
    •Right atrial enlargement:P wave amplitude > 1.5 mm in V1 and V2
  • 21.
    • P Pulmonale •The presence of tall, peaked P waves in lead II is a sign of right atrial enlargement, usually due to pulmonary hypertension (e.g. cor pulmonale from chronic respiratory disease)
  • 22.
    • Left AtrialEnlargement • In left atrial enlargement, left atrial depolarisation lasts longer than normal but its amplitude remains unchanged • Therefore, the height of the resultant P wave remains within normal limits but its duration is longer than 120 ms • A notch (broken line) near its peak may or may not be present (“P mitrale”) • ECG Criteria for Left Atrial Enlargement • LAE produces a broad, bifid P wave in lead II (P mitrale) and enlarges the terminal negative portion of the P wave in V1 • In lead II • Bifid P wave with > 40 ms between the two peaks • Total P wave duration > 110 ms • In V1 • Biphasic P wave with terminal negative portion > 40 ms duration • Biphasic P wave with terminal negative portion > 1mm deep
  • 23.
    • P Mitrale •The presence of broad, notched (bifid) P waves in lead II is a sign of left atrial enlargement, classically due to mitral stenosis
  • 24.
    P waves withterminal portion > 1mm deep in V1
  • 25.
    • Biatrial Enlargement •Biatrial enlargement is diagnosed when criteria for both right and left atrial enlargement are present on the same ECG • The spectrum of P-wave changes in leads II and V1 with right, left and bi-atrial enlargement:
  • 26.
    • Inverted PWaves • P-wave inversion indicates a non-sinus origin of the P waves • Causes • Dextrocardia • Abnormal atrial depolarization • Atrial ectopics • AV junctional rhythms • Ventricular tachycardia (retrogradely conducted) • Ventricular ectopics (retrogradely conducted)
  • 27.
    • Variable P-WaveMorphology • The presence of multiple P wave morphologies indicates multiple ectopic pacemakers within the atria and/or AV junction • If ≥ 3 different P wave morphologies are seen, then multifocal atrial rhythm is diagnosed:
  • 28.
    • If ≥3 different P wave morphologies are seen and the rate is ≥ 100, then multifocal atrial tachycardia (MAT) is diagnosed: